

Abstract
Bacteriophage λ begins its infection cycle by ejecting its DNA into its host Escherichia coli cell, after which either a lytic or a lysogenic pathway is followed, resulting in different cell fates. In this study, using a new technique to monitor the spatiotemporal dynamics of the phage DNA in vivo, we found that the phage DNA moves via two distinct modes, localized motion and motion spanning the whole cell. One or the other motion is preferred, depending on where the phage DNA is ejected into the cell. By examining the phage DNA trajectories, we found the motion to be subdiffusive. Moreover, phage DNA motion is the same in the early phase of the infection cycle, irrespective of whether the lytic or lysogenic pathway is followed; hence, cell-fate decision-making appears not to be correlated with the phage DNA motion. However, after the cell commits to one pathway or the other, phage DNA movement slows during the late phase of the lytic cycle, whereas it remains the same during the entire lysogenic cycle. Throughout the infection cycle, phage DNA prefers the regions around the quarter positions of the cell.
Introduction
Bacteriophage (or simply phage) λ is one of the best studied systems due to its relatively simple genetic regulatory circuitry and its importance as the simplest paradigm of cell-fate decisions (1,2). Upon infection by phage λ, an Escherichia coli bacterium enters one of two pathways: lytic (virulent) or lysogenic (dormant). In the lytic pathway, ∼100 new viruses are produced inside the cell and then released to the environment after cell lysis (cell death). In the lysogenic pathway, the viral DNA is integrated into the E. coli genome, where the virus remains in a dormant state inside the cell, and the cell does not appear to be harmed. Although this lysogenic state is extremely stable, it can be switched to the lytic state if the cell undergoes DNA damage by inducing agents such as ultraviolet light. The lytic pathway, lysogenic pathway, and lysogenic induction serve as important model systems for understanding developmental pathways and the switch between two pathways (3).
The lysis/lysogeny decision-making process has been well studied at the level of cell culture (1,3–7) and, more recently, at higher resolution (8–12). The nutritional condition of the cell is an important influential factor in the choice between cell lysis and lysogeny, since host factors regulate the expression of viral key genes for lysis/lysogeny (4,6,13). In the 1970s, using a bulk assay, multiplicity of infection (MOI), i.e., the number of infecting phages per cell, was identified as an important factor in the lysis/lysogeny decision. Through quantification of cell lysogeny as a function of average phage input (API or <MOI>, the average number of infecting phages per cell), and assuming that the adsorption of phage particles to the E. coli surface follows a Poisson distribution, the authors concluded that cell lysogenization requires two or more wild-type phages when cells are grown in rich medium (4). Recently, by means of single-cell methods, cell length (size) was established as another important factor in the lysis/lysogeny decision, where smaller cells tend to lysogenize more frequently (8,9). More intriguingly, quantitative data at the single-cell/single-virus level suggested that individual viruses make individual decisions inside the cell and then cooperate in such a way that only a unanimous vote by all the infecting viruses can lead to cell lysogeny (8). Based on the data from that experiment (8), the authors of a theoretical study proposed an alternative scenario in which the resulting cell fate could be due to partial gene-dosage compensation (11). The quantitative understanding of the lysis/lysogeny decision-making process is still incomplete. To fully unravel the decision-making process, still greater resolution is needed.
A few studies have shown that when phage λ is mixed with E. coli, it prefers to attach to cellular poles or at midcell (future pole), presumably for λ DNA ejection into the host (8,14,15). The ejected λ DNA then serves as the blueprint for the viral gene expression eventually leading to different cell fates. It appears that the preferred DNA ejection site only influences the rate of successful ejection, and that once the phage DNA is successfully ejected into the E. coli cytoplasm, the lysogenization frequency remains the same (8). In this study, we probe this system in more detail by following the DNA movement inside the cell, asking whether phage DNA movement has any correlation to cell fate and what kind of motion phage DNA exhibits in cells at different developmental stages depending on the cell-fate decision. This may help to reveal the mechanism of lysis/lysogeny decision-making at the subcellular level. Many lines of study have shown that a bacterium is not a “well-mixed soup”, that instead, macromolecules undergo spatiotemporal organization (16). For example, different proteins involved in cell division are localized differently inside the cell in E. coli: FtsZ is positioned at midcell when cells are about to divide (17), the MinCDE family oscillates between cell poles (18), and different chromosomal loci move subdiffusively in the cytoplasm (19). The local environment of the phage DNA may have a significant influence on the stochastic gene expression leading to different cell fates (8).
In this study, to our knowledge, we first report a new plasmid-based method for labeling phage λ to count the infecting phages for quantitative study under the fluorescence microscope. To our knowledge, we then describe a new technique in which we use fluorescently fused E. coli SeqA protein to monitor the intracellular motion of λ phage DNA in living cells. Using this new system, we characterize the motion of λ DNA particles at different stages of the infection cycle. We find that λ DNA particles exhibit subdiffusive behavior similar to that of the large particles reported in the literature. At the early stage of the infection cycle, before the lytic or lysogenic pathway is chosen, λ DNA moves similarly in all cells, which suggests that its movement does not affect the lysis/lysogeny decision. In contrast, λ DNA movement varies after the cell commits to one pathway or the other.
Materials and Methods
Bacterial strains, plasmids, phages, and primers
The strains, plasmids, phages, and primers used are described in Table 1.
Table 1.
Bacterial strains, plasmids, phages, and primers
| Strain Name | Relevant Genotype | Source/Reference |
|---|---|---|
| Bacterial strains | ||
| MG1655 | sup0 | lab collection |
| W3350 | sup0 | lab collection |
| LE392 | supE, supF | lab collection |
| BA15 | MG1655, dam- | M. Radman |
| LZ204 | MG1655, dam-, seqA-ecfp, cmR | this work |
| LZ208 | LZ204[pPRE-mCherry] | this work |
| Phage strains | ||
| λLZ613 | parental, cI857bor::kanR | this work |
| λLZ220 | fully methylated, gpD-mosaic, cI857bor::kanR | this work |
| λLZ221 | unmethylated, gpD-mosaic, cI857bor::kanR | this work |
| λIG2903 | b::kanRcI857 | Zeng et al. (8) |
| λLZ7 | gpD-mosaic, b::kanRcI857 | this work |
| λLZ3 | gpD-mosaic, b::kanRcI857 | this work |
| λLZ6 | gpD-mosaic, b::kanRcI857 | this work |
| Plasmids | ||
| pPRE-mCherry | mCherry under the control of PRE, ampR | Zeng et al. (8) |
| pPLate∗D | gpD under the control of λ late promoter, ampR | Zeng et al. (8) |
| pACYC177-PLate∗D-eyfp | gpD-EYFP under the control of λ late promoter, ampR | this work |
| pGG503 | Dam under the native promoter, tetR | Herman and Modrich (23) |
| Primers | ||
| PLZ1λ1 | 5′-GCTGAAAAATTCAGTGTAAGGGATGTTTATGACG | this work |
| PLZ1λ3back | 5′-GAAGGGGATCCTTACTTGTACAGCTC | this work |
| SA6for | 5′-TCCCCGCGGAACGTTGCAGACAAAGGACAAAG | Babic et al. (26) |
| SA7back | 5′-ACATGCATGCCAATACGCTTCCAGTATTC | Babic et al. (26) |
| ECFP forward 1 | 5′-ATCTGCTAGCGTGAGCAAGGGCGAGG | this work |
| ECFP reverse 1 | 5′-AGATGGATCCTCATTACTTGTACAGCTCGTCCATGC | this work |
| pSeqA-CFP, Cm forward 1 | 5′-TTGCGTCACCTGCTATCGTCG | this work |
| pSeqA-CFP, Cm reverse 1 | 5′-GGACAGGGCGTGAGTATCTTTACC | this work |
Construction of the plasmid pACYC177-PLate∗D-eyfp
The construction of the plasmid is as follows: D-eyfp was first amplified from λeyfp (20) using primers PLZ1λ1 and PLZ1λ3back and cloned between the EcoRI and BamHI restriction sites. This D-eyfp replaced gene D in pPLate∗D plasmid (8), resulting in a plasmid pPLate∗D-eyfp with the origin of replication of pBR322, denoted pBR322-PLate∗D-eyfp. The fragment PLate∗D-eyfp was digested with enzymes BamHI and HindIII and ligated to pACYC177 or pACYC184 vectors, resulting in the plasmid pACYC177-PLate∗D-eyfp or pACYC184-PLate∗D-eyfp with the origin of replication of p15A. To produce fluorescent gpD-mosaic phages, lysogens harboring the D-eyfp plasmid were heat-induced, followed by a series of phage purification steps (8). The fluorescent gpD-mosaic phages λLZ7, λLZ3, and λLZ6 were produced from W3350(λIG2903)[pACYC177-PLate∗D-eyfp], W3350(λIG2903)[pBR322-PLate∗D-eyfp], and W3350(λIG2903)[pACYC184-PLate∗D-eyfp], respectively, and λLZ220 (see next section for details) and λLZ221 were produced from MG1655(λLZ613)[pACYC177-PLate∗D-eyfp][pGG503] and BA15(λLZ613)[pACYC177-PLate∗D-eyfp], respectively.
Fully methylated fluorescent phages
The parental phage λLZ613 was created by crossing λ cI857 with plasmid pER157 (21) (gift of Ryland Young, Texas A&M University) to replace the bor region with the Kanamycin antibiotic cassette through the standard protocol (1). The bor gene encodes an outer membrane lipoprotein, which is not involved in lysis/lysogeny decision making (22). Under the normal dam+ E. coli environment, the produced λ phage is undermethylated (or partially methylated) due to the limited availability of Dam methylase. The fully methylated λ phage can be obtained with the help of the Dam methylase overproduction plasmid pGG503 (23,24). This pGG503 plasmid (gift of Paul Modrich, Duke University, and Martin Marinus, University of Massachusetts Medical School) was then transformed into the phage lysogen MG1655(λLZ613)[pACYC177-PLate∗D-eyfp]. Stable fluorescent mosaic phage λLZ220 was produced and purified as described previously (8,25). Briefly, 500 mL of phage lysogen is grown in Luria-Bertani broth supplemented with 0.5 μg/mL thiamine HCl to OD600 ≈ 0.6 followed by heat induction to produce crude lysate. The crude lysate is then precipitated by polyethylene glycol, ultracentrifuged in CsCl step gradient and equilibrium gradient, and dialyzed against SM buffer (100 mM NaCl, 10 mM MgSO4, 0.01% gelatin, and 50 mM Tris-Cl, pH 7.5). We stained the fully methylated fluorescent phage (λLZ220) with 4′,6-diamidino-2-phenylindole (DAPI; Sigma-Aldrich, St. Louis, MO) to test DNA packaging efficiency. We mixed 10 μL of phage (∼2 × 10⁹ pfu/mL) with 10 μL DAPI (10 μg/mL) and incubated the mixture at room temperature for 10 min or on ice for 30 min. We then applied 1 μL of phage-DAPI mixture to a coverslip (no. 1.5, Fisher Scientific, Waltham, MA) and covered it with a 1.5% phosphate-buffered saline-agarose slab. The sample was imaged under the fluorescence microscope with five z-axis (vertical) slices taken at 200 nm intervals, using 100 ms exposure in the yellow fluorescent protein (YFP) and DAPI channels (for details, see Microscopy and imaging). Typical images are seen in Fig. 1 A. Only ∼1% of the fluorescent phage particles examined (7 of 680) lacked the DAPI signal (indicating that these particles did not successfully package the viral DNA or had already ejected their DNA elsewhere), and ∼1% (8 of 680) lacked the YFP signal, which could be due to the YFP signal being undetectable or to this phage having changed its location during imaging. Fig. 1 A demonstrates the colocalization and uniformity of YFP and DAPI signals from each phage. Individual phages can be easily distinguished under the microscope.
Figure 1.
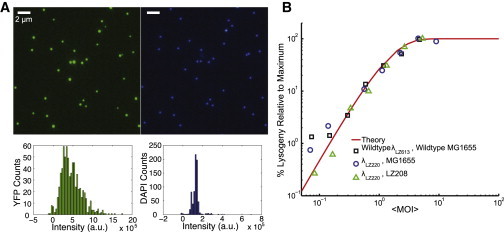
Fluorescently labeled phage and the control lysogenization experiment in bulk. (A) Fluorescence and DNA packaging efficiency of the fully methylated fluorescent phage (λLZ220). DAPI (4′,6-diamidino-2-phenylindole) was used to label the phage genome. (Upper) YFP (left) and DAPI signals (right) from the phages under the fluorescence microscope. YFP and DAPI signals colocalize very well, and individual phages are easily distinguishable. Only ∼1% of the fluorescent phage particles examined (7 of 680) lacked the DAPI signal (indicating that these particles did not successfully package the viral DNA or had already ejected their DNA elsewhere), and ∼1% (8 of 680) lacked the YFP signal which could be due to an undetectable YFP signal or to this phage having changed location during imaging. (Lower) Intensity histograms for YFP (left) and DAPI signals (right). (B) Fully methylated fluorescent phage λLZ220 shows the same lysogenization response to MOI in dam−E. coli LZ208 (the normal dam+ strain, MG1655) as the wild-type phage λLZ613 in MG1655. Symbols represent the experimental measurements, and the red line shows the theoretical prediction based on the n ≥ 2 Poisson distribution (4). To see this figure in color, go online.
Construction of the SeqA-ECFP
Our approach is based on a method developed by Babic and co-workers (26), which has been used to directly visualize horizontal gene transfer in E. coli. Starting with pSeqA-C (gift of Miroslav Radman, Université Paris Descartes Faculté de Médecine), as described by Babic et al. (26), a 700 bp region on the 3′ end of seqA was amplified from MG1655 chromosomal DNA using primers SA6for and SA7back and cloned between SacII and SphI restriction sites of pSeqA-C downstream of the cmR. This homology region allows later integration into the E. coli chromosome. The resulting plasmid is pSeqA-C3H. An ecfp insert was amplified from plasmid pPROTet.E-ecfp (gift of Christopher Rao, University of Illinois at Urbana-Champaign) using primers ECFP forward 1 and ECFP reverse 1 with restriction sites NheI and BamHI added to the ends. pSeqA-C3H was digested with NheI and BamHI (excising the yfp region), and the vector was extracted. The insert was also digested with NheI and BamHI, ligated with the vector, and transformed to select for chloramphenicol resistance (cmR). The resulting plasmid, pSeqA-CFP, contains seqA-ecfp and the 3H homology region, with a cmR cassette located in between. This whole region (∼3 kb) was amplified using primers pSeqA-CFP, Cm forward 1 and pSeqA-CFP, Cm reverse 1. This resulting fragment was integrated into the dam− strain BA15 (gift of Miroslav Radman, Université Paris Descartes Faculté de Médecine), resulting in the host strain LZ204 using the Wanner gene replacement method (27).
Fully methylated fluorescent phage shows the same lysogenic response in different hosts in bulk
Through our bulk experiments (the same experimental procedure as in our previous work (8)), we show that in different host strains (dam−, LZ208 and wild type dam+, MG1655), fully methylated fluorescent mosaic phage λLZ220 behaves like wild-type phage in wild-type cells, exhibiting the same lysogenic response as a function of MOI (Fig. 1 B).
Microscopy and imaging
An overnight culture of LZ208 was diluted 1:100 in M9 minimal medium (11.3 g/L M9 salts, 1 mM MgSO4, 0.5 μg/mL thiamine HCl, 0.1% casamino acids, 100 μM CaCl2, and 0.4% maltose) and grown to OD600 ≈ 0.4 at 37°C. Cells were concentrated and resuspended in ice-cold M9 to OD600 ≈ 4. λLZ220 phages were added to reach an MOI of ∼1, followed by incubation on ice for 30 min and an additional 5 min incubation at 35°C to trigger phage DNA ejection (4,8,14,28). The phage-cell mixture was diluted 1:10 in M9, and 1 μL of the diluted phage-cell mixture was placed on a thin 1.5% or 2% M9 agarose slab (∼1 mm thick). After 1 min, a coverslip (no.1.5, Fisher Scientific) was gently laid over the mixture and the sample was imaged under the fluorescence microscope at 30°C by a cage incubator (InVivo Scientific, St. Louis, MO). Microscopy was performed on an inverted epifluorescence microscope (Ti-E, Nikon, Tokyo, Japan) using a 100× objective (Plan Fluo, NA 1.40, oil immersion) and standard filter sets. Images were acquired using a cooled EMCCD camera (iXon3 897, Andor, Belfast, United Kingdom). Acquisition was performed using Nikon Elements software.
To localize all phages surrounding the cells, a series of 15 z-axis (vertical) images at a spacing of 200 nm were taken through the YFP channel using 100 ms exposure. To obtain more data in each time-lapse movie, cells were imaged at multiple stage positions (typically eight) in each experiment. During the time-lapse movie, the sample was imaged in phase contrast (100 ms exposure, for cell recognition), YFP (100 ms exposure, for phage detection), cyan fluorescent protein (CFP) (30 ms exposure, for phage DNA detection inside the cell), and mCherry (100 ms exposure, for detection of the PRE transcriptional reporter signal) channels. The time-lapse movies were taken either continuously or at time intervals of 200 ms, 500 ms, 1 s, 5 s, 10 s, and 20 s for ∼30 frames till the sample was photobleached. These were short movies used to characterize phage DNA diffusion. We also took longer movies, at a time interval of 5 min, until the cell fate was observable (∼4 h). For long time-lapse movies, with time, as infections led to one of the possible pathways, lytic cells were identified by SeqA-CFP foci and cell lysis. Lysogenic cells were identified by SeqA-CFP foci and the increased mCherry fluorescence indicating PRE activity followed by cell division. Typical time-lapse movies for lytic and lysogenic cells are shown in Movies S1 and S2, respectively, and a few snapshots from these are shown in Fig. 2 B. To ensure that our imaging condition does not affect the lysis/lysogeny decision making (e.g., the leaking ultraviolet light could induce lysogenization), we performed time-lapse movies of phage lysogen growth with the same imaging parameters and the lysogen grew normally.
Figure 2.
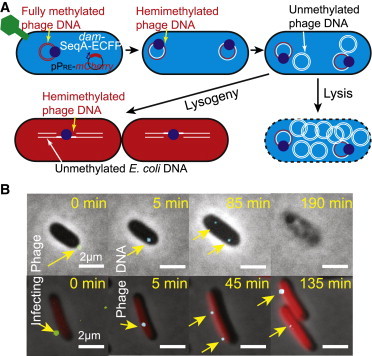
Assaying the phage infection process. (A) Representative schematic of phage DNA labeled by SeqA-ECFP protein. The initial SeqA-ECFP focus corresponds to the ejected phage DNA. Two foci will appear when the phage DNA replicates to two hemimethylated phage DNAs. These two foci will remain for the infection cycle. The cell also harbors pPRE-mCherry plasmid. Red fluorescence (mCherry) will accumulate if the cell follows the lysogenic pathway. (B) Overlay images from a time-lapse movie showing phage DNA entering a lytic cell (upper) and a lysogenic cell (lower). At 0 min, the phage (green dot) can be seen on the cell surface. At 5 min, the SeqA-ECFP focus (cyan dot) appears, representing the ejected phage DNA. Two foci appear at a later time (at 85 min in the lytic cell and 45 min in the lysogenic cell). The lytic cell then lyses and the lysogenic cell divides, with each daughter cell having one focus. To see this figure in color, go online.
All data analysis was performed in Matlab (The MathWorks, Natick, MA). Cell recognition in the phase-contrast channel was performed using the Schnitzcell routine (gift of Michael Elowitz, California Institute of Technology), cell lineage tracking was performed by a homemade script, and spot recognition was similar to Spatzcells (29). We performed short movies with 30 time frames at time intervals of 30 ms (continuous streaming, two experiments, eight cells), 200 ms (three experiments, four cells), 1 s (five experiments, 12 cells), 2 s (six experiments, nine cells), 5 s (nine experiments, 16 cells), 10 s (six experiments, 11 cells), and 20 s (three experiments, six cells). For long movies, we performed a total of 13 experiments (lasting ∼4 h at a time interval of 5 min) in which we measured the fates of 326 cells infected by 413 phages.
Results
A plasmid-based approach for the construction of stable, well-behaved fluorescent phage lambda
To obtain a quantitative picture of the dynamics in the λ system, it would be desirable to follow the viral life cycle under the microscope in real time, at the resolution of individual phages and cells. There are different ways to label phage particles fluorescently (8,9,14,20,30–32), and the key issue is to ensure that the labeled phages are functional and well-behaved for the examination of viral life cycle. Recently, we constructed two fluorescent phages, λLZ1 and λLZ2, based on λeyfp (8,20). Fluorescent gpD-mosaic λLZ2 was created by coexpression of fluorescent gpD-EYFP encoded by the eyfp gene fused λ D gene in the lysogen of λLZ1 and wild-type gpD from a plasmid under control of the λ late promoter. We tested the candidacy of fluorescent phages (fluorescent gpD-EYFP λLZ1 and gpD-mosaic λLZ2) to behave like wild-type for single-virus study under the microscope. Through our study, we found that gpD-EYFP λLZ1 cannot survive through phage purification steps, meaning that the phage keeps losing its titer significantly along the way, which indicates that the capsid made with pure gpD-EYFP proteins is not stable. In addition, other tests on the unpurified phage, including phage morphology through electron microscopy, DNA packing efficiency through DAPI staining, and MOI response through bulk assay, also failed. On the other hand, fluorescent gpD-mosaic λLZ2 passed all the control tests using the successfully purified stock, i.e., it had morphology similar to that of the wild-type, close to 100% DNA packaging efficiency within 1% accuracy, and a cell lysogeny-versus-API trend similar to that of wild-type cells based on bulk assay. The number of gpD-EYFP versus wild-type gpD proteins in the capsid of fluorescent gpD-mosaic λLZ2 is ∼1:4 based on a comparison of the fluorescence intensities of gpD-EYFP λLZ1 and gpD-mosaic λLZ2 under the microscope (Fig. S1 in the Supporting Material). As there are ∼420 copies of gpD per phage head (1), λLZ1 presumably contains ∼420 copies of fluorescent gpD-EYFP, so gpD-mosaic λLZ2 contains ∼100 copies of fluorescent gpD-EYFP. The appropriate ratio of these two versions of gpD is key to the stability of the phage capsid and the brightness of the phage.
As described above for the construction of fluorescent gpD-mosaic phage λLZ2, the fluorescent gpD-EYFP proteins are from the λ lysogen DNA containing the gene D-eyfp, and the wild-type gpD proteins are from plasmid pPLate∗D. Here, to achieve coexpression of wild-type gpD and fluorescent gpD-EYFP proteins, we can switch the sources of production of these two types of proteins, so that wild-type gpD proteins are from the λ lysogen DNA and fluorescent gpD-EYFP proteins are from a plasmid. This can facilitate the study of a number of phage mutants without requiring D-eyfp recombinant viruses of each mutant, and it also eliminates the possibility of perturbing phage behavior during manipulation of the phage genome. The constructed plasmid, pACYC177-PLate∗D-eyfp, containing the λ D gene, fused with enhanced YFP (EYFP) is under the control of the λ late promoter (see Materials and Methods for details). The resulting phage from lysogen W3350(λIG2903)[pACYC177-PLate∗D-eyfp] is referred to as fluorescent gpD-mosaic phage λLZ7. Again, to verify that the fluorescent version of λLZ7 behaves like wild-type λIG2903, we repeated the same control experiments used to verify fluorescent gpD-mosaic λLZ2, and compared this phage with λLZ2. λLZ7 efficiently packages the viral DNA, is structurally stable, and exhibits the appropriate lysis/lysogeny decision phenotype (Fig. S2).
Phage DNA detection
To follow phage DNA from the point of infection through the entire infection cycle, it was necessary to provide fluorescent labels for both the phage particle and its DNA. To this end, we constructed a host, LZ204, that is methylation-deficient (dam−) and constitutively expresses the fluorescent fusion protein SeqA-ECFP. SeqA binds to λ DNA in both fully methylated and hemimethylated form with the same efficiency and affinity (33,34). The phage λLZ220 was fully methylated by production in a dam+ host with a Dam methylase overproduction plasmid pGG503 (23,24) (the fluorescent phage and bulk test are shown in Fig. 1). The wild-type phage λ produced in a wild-type cell is undermethylated (or partially methylated) owing to lack of Dam methylase (24). In addition, the λLZ220 phage is fluorescently labeled through the plasmid-based approach described above, as a result of being mosaic for the gpD decoration protein. To monitor the lysis/lysogeny decision under the fluorescence microscope, LZ204 was transformed with the lysogenic reporter plasmid pPRE-mCherry (8). Infected cells that follow the lysogenic pathway develop red fluorescence as a result of key lysogenic establishment protein CII-dependent activation of PRE, as opposed to the overt lysis that terminates the lytic pathway (8,35).
Before phage infection, the SeqA-ECFP fusion proteins exhibit uniform cytoplasmic distribution inside the dam− host. After fully methylated phage DNA is ejected into the cell, SeqA-ECFP would be expected to bind to the phage DNA, forming a fluorescent focus. When the phage DNA replicates in the dam− host, this fully methylated phage DNA would be converted into two hemimethylated duplex DNAs, and thus, two fluorescent foci should be visible. As the phage DNA replicates further in the dam− host, the number of foci should remain at two for the rest of the infection cycle. A schematic of this experimental setup is shown in Fig. 2 A. All of these expectations were fulfilled, for a total of 333 infections with the fully methylated and fluorescently labeled λLZ220 phages. Images and movies of representative lytic and lysogenic infections are shown in Fig. 2 B and Movies S1 and S2. The fluorescence intensity of the first fluorescent focus, corresponding to the initial λ DNA ejected into the cytoplasm, was shown to be mostly uniform (Fig. 3 A). Since phage particles may locate at different z-planes, we expect a range of fluorescence intensities, since we image only at the focal plane to avoid photobleaching. As expected, unmethylated phage (λLZ221) produced in a dam− host generated no fluorescent foci at any time during the infection cycle.
Figure 3.
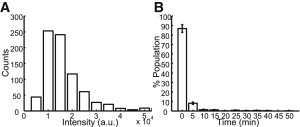
(A) Histogram of the fluorescence intensity of the SeqA-ECFP foci representing the phage DNA ejected into the cytoplasm. (B) Histogram of the time of the appearance of the SeqA-ECFP foci (N = 519). Approximately 95% of the spots appear within 5 min under these experimental conditions. Data are shown as the mean ± SE (counting error).
Phage DNA dynamics during the immediately early stage of phage infection in living cells
To examine the motion of phage DNA particles and characterize the diffusion coefficient of phage DNA inside the cell, we performed experiments with different time resolutions (time intervals of 30 ms, 200 ms, 500 ms, 1 s, 5 s, 10 s, and 20 s). Since these movies are short (typically 30 frames) and the initially ejected DNA has not yet been replicated, we normally observe one SeqA-ECFP focus per cell. Therefore, the phage DNA dynamics reported below is for the immediately early stage of phage infection, before the cell commits to either the lytic or lysogenic pathway. The phage DNA trajectories enable us to estimate the diffusion coefficient of these particles. In the literature, various tracer particles were reported to exhibit subdiffusive motion in bacteria (19,36–38). Here, to extract the subdiffusivity of this two-dimensional diffusive system, we use the equation (19) , where is the ensemble-averaged mean square displacement between two time points, Dapp is the apparent diffusion coefficient, τ is the time interval, α is the subdiffusion scaling exponent, n is the number of trajectories, and m is the number of time points. Fig. 4 A shows as a function of τ for the 12 cells with a time interval of 1 s between measurements. Each trajectory can be fitted into a power function with α = 0.43 ± 0.20 (mean ± SD). Deviation from the power fit at longer times might be due to the effect of averaging over a small number of position pairs and/or limited cell size (36). The average value of 0.43 is in reasonable agreement with those reported for E. coli chromosome loci (19). However, there is a great cell-to-cell variability, reflected by the large standard deviation of 0.20, with α ranging from 0.25 to 0.92. To eliminate the effect of phototoxicity to cell health on particle movement, we also performed experiments with different time intervals between measurements of 30 ms, 200 ms, 500 ms, 2 s, 5 s, 10 s, and 20 s. We found that the average α value is almost constant for time intervals of 1 s, 2 s, 5 s, and 10 s (Fig. 4 B), indicating that the measurements converge. The red line shows the mean of measurements at those four intervals, α = 0.47 (± 0.03). For time intervals <1 s, α < 0.4. For those of 30 ms and 200 ms, α < 0.20, possibly due to phototoxicity of the cells caused by excessive exposure of the sample to light. The 20 s interval has an α of <0.30, which might be due to the limited cell size. Nevertheless, with the subdiffusion scaling exponent of α < 1, the phage-DNA-protein complex exhibits subdiffusive motion in E. coli cells.
Figure 4.
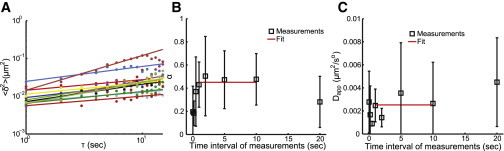
Subdiffusive motion of phage DNA particles. (A) δ2 as a function of time interval τ for the experiment with 1 s intervals between measurements (loglog plot). The experimental data and the power fit for each trajectory are shown as colored squares and lines, respectively. (B) The subdiffusion scaling exponent, α, for different time intervals between measurements. Open squares represent experimental measurements, and the red line is the fit to the measurements taken at 1 s, 2 s, 5 s, and 10 s intervals. (C) Apparent diffusion coefficient, Dapp, for the different time intervals between measurements. Symbols and red line are defined as in (B). To see this figure in color, go online.
The apparent diffusion coefficient extracted from the measurements at intervals of 1 s, 2 s, 5 s, and 10 s is Dapp = (2.5 ± 0.9) × 10−3 μm2/s0.47. Here, our phage-DNA-protein aggregates are expected to be large particles. There are 116 GATC sites distributed along the 48.5 kbp λ genome for SeqA-ECFP protein to bind. It was reported that in in vitro experiments, one SeqA tetramer binds to each of the hemimethylated GATC sequences, which are up to 31 bases apart on the DNA (39,40). We estimate that roughly a few tens of SeqA-ECFP molecules, each a few nanometers in size, will bind on the phage genome. From this parameter and the size of the λ genomic DNA, we estimate the phage-DNA-protein complex to be on the order of 100 nm (41). In the literature, the diffusion coefficient for large protein or RNA-protein aggregates on the order of 100 nm ranges widely from the order of 10−4 μm2/s to 10−2 μm2/s, and the particles are reported to exhibit either subdiffusive or normal diffusion (36,37,42,43). As shown in Fig. 4 C, the standard deviation for each measurement is very large, which is consistent with the literature for large particles exhibiting nonhomogeneous diffusive motions inside the cell and dynamic heterogeneity within the cytoplasm of individual cells (37).
Phage DNA shows different patterns of motion during the late stage of phage infection in lytic and lysogenic cells
To examine whether phage DNA movements are correlated with cell fate, we performed hours-long time-lapse movies (typically 4 h at a time interval of 5 min) with the optimized microscope parameters for cell growth. We observed that initial fluorescent spots appear near the phage infection site, presumably the site at which the phage DNA is ejected into the cytoplasm. As shown in Fig. 3 A, the intensities of the fluorescent spots are relatively uniform, indicating a stable binding of SeqA-ECFP proteins to phage DNA. Most phages (∼95 ± 5%) ejected their DNA within 5 min after we started the time-lapse movies (Fig. 3 B). However, ∼5% of the phage particles ejected their DNA after prolonged adsorption. One explanation might be cell-to-cell variability of phage DNA ejection in vivo, where ejection of DNA could occur in a single step or with pauses between events (30), possibly due to the absence of side tail fibers in the laboratory λ or λpapa (44).
From the time-lapse movies, we observed that fluorescent particles exhibit both localized motion and motion spanning the whole cell. Images of a typical cell are shown in Fig. 5. The initial ejected phage DNA is located around the cell polar position and moves locally for ∼25 min. This fluorescent focus then splits into two foci, corresponding to the two copies of replicated phage DNA particles. One of the particles continues to move locally, whereas the other traverses the entire cell within 20 min. Subsequently, two foci move locally. This nonhomogeneous motion is also observed in studies of RNA-protein complex and large GFP-μNs particles in E. coli (36,37,43). Therefore, one possible explanation for the nonhomogeneous motion is the large particle size. Another possibility is that the motion is associated with the phage DNA being at different stages of the infection cycle. After ejecting its DNA inside the host cell, phage DNA undergoes replications, switching from θ mode to σ mode, packaging into the phage head for the lytic cycle or integrating into the host genome and replicating along with the host for the lysogenic cycle. We elaborate on this point in the next section and the Discussion section.
Figure 5.
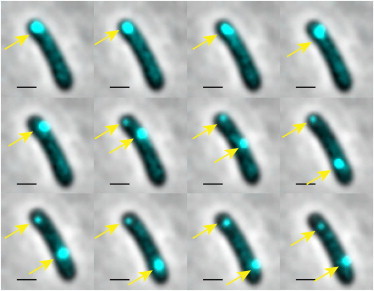
Phage DNA particles exhibit both localized motion and motion spanning the whole cell. Images were taken 5 min apart. During the first five frames, one fluorescent focus, representing the initial ejected DNA particle, moves locally. At frame 6, one fluorescent focus splits into two foci representing two phage DNA particles. During frames 6–9, the top phage DNA particle moves locally, and the bottom particle travels the whole cell. During frames 10–12, both phage DNA particles move locally. Scale bar, 1 μm. To see this figure in color, go online.
Under our experimental conditions, lytic cells take ∼125 min to lyse and lysogenic cells take ∼140 min to divide, as compared to 110 min for uninfected cells (Fig. S3, A–C, respectively). The delayed division for lysogen might be a result of Kil protein expressed in infected cells (45). Kil is known to inhibit the expression of ftsZ, the key gene for cell division (46). We then track the phage DNA movement for 150 min to capture the entire infection cycle. To characterize the phage DNA motion, we plotted the mean square displacement (MSD), as well as the MSD between two time points, , as a function of time over the entire infection cycle. MSD is defined as , where is the coordinate of a given particle at moment t, is the coordinate of this particle at the beginning of the trajectory, and n is the number of total trajectories. is defined as . It can be seen in Fig. 6 A that during the first 50 min after infection, the MSDs of the labeled λ DNA in lytic and lysogenic cells follow a similar trend along the cell major axis (the x direction), but ultimately reach a much higher plateau in lytic cells (1.78 μm2 for lytic cells vs. 0.92 μm2 for lysogenic cells, with a difference of 0.86 μm2). One may ask whether the cell size contributes to the MSD difference, since phage DNA particles may have more room to move in larger cells. Indeed, the average lytic cell is longer than lysogenic cells for a mean of 0.8 μm (Fig. 7, A and B). To further explore this effect, we grouped the lytic cells into short (N = 217 cells) and long (N = 86 cells) cell subgroups and made the average size of the short cells similar to that of the lysogenic cells (Fig. 7 C). We found that the plateau of MSD in x is higher for longer cells (Fig. 7 D). We also noticed that the plateau of lytic short cells (1.29 μm2) is higher than that of lysogenic cells with the same average cell size. Therefore, the cell size only partially accounts for the MSD plateau difference between lytic and lysogenic cells. The other possible explanation for the lower plateau in lysogenic cells is that movement of the host genome is restricted because phage DNA has already integrated into the host and moves along with the host attB locus, which may only jiggle around (19).
Figure 6.
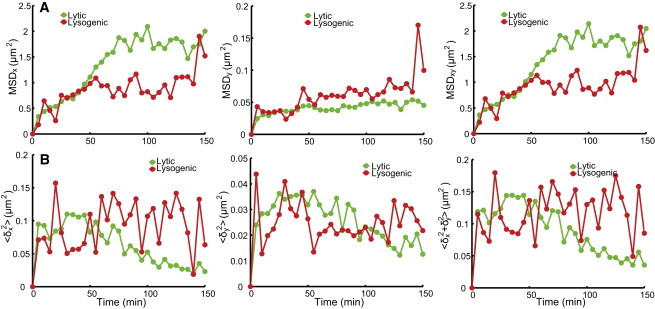
Motion of phage DNA particles in lytic and lysogenic cells. (A) Mean square displacements (MSDs) of phage DNA particles in lytic and lysogenic cells as a function of time. MSD in x (left), y (middle), and combined xy (right) directions. Within the first 50 min after infection, MSDx follows a similar trend in both lytic and lysogenic cells. MSDx in lytic cells reaches a higher plateau than that in lysogenic cells after 50 min of infection. MSDy in lysogenic cells reaches a slightly higher plateau compared to that in lytic cells, except for the outlier data point at 145 min. (B) 〈δ2〉, the MSD of phage DNA particles between two adjacent time points. The movement of phage DNA particles in lysogenic cells does not seem to change over time, whereas movement in lytic cells slows down over time. Overall, movement in the x direction dominates, and that in the y direction is limited, which might be due to the confined space in the y direction. To see this figure in color, go online.
Figure 7.
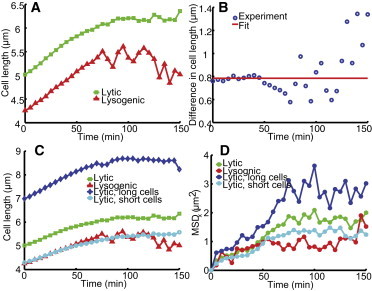
Cell size partially accounts for the MSD plateau. (A) Cell size as a function of time. Lytic cells (green, N = 303) are longer than lysogenic cells (red, N = 35) throughout the infection cycle. (B) Cell size difference as a function of time. For the first 50 min, the cell size difference between lytic and lysogenic cells is almost constant (red line). (C) Cell size as a function of time, including lytic long cells (blue, N = 86) and lytic short cells (cyan, N = 217). Here, the average cell length of lytic short cells is similar to that of lysogenic cells (red). (D) MSD in the x direction as a function of time. The MSD of particles in longer cells reaches a higher plateau than that in short cells. However, the plateau of lytic short cells (cyan) is higher than that of lysogenic cells (red with the same cell size), indicating that cell size only partially accounts for the difference in MSD plateau. To see this figure in color, go online.
Surprisingly, after 50 min of infection, the MSD between two time points gradually decreases for lytic cells (Fig. 6 B), suggesting a slower motion of the phage DNA. This slowed-down motion may be due to a longer concatemeric λ DNA, since at the later stages of the phage infection cycle, phage DNA replication switches from θ mode to σ mode, producing concatemeric λ DNA approximately two to eight times the length of a λ monomer (1). It has been suggested that increasing particle size leads to increasing spatial confinement in E. coli (37). In contrast, phage DNA in the lysogenic cells maintains a consistent rate of movement throughout the infection cycle. Also plotted in Fig. 6 are the MSD along the cell minor axis (the y direction) and the MSD of the combined x and y directions. Movement in the y direction is at least one order of magnitude lower than that in the x direction for lytic cells, presumably due to the limited space available along the y axis.
Phage DNA locates at similar positions for both lytic and lysogenic cells
We then set out to examine whether phage DNA has a preferred location inside the cell, and whether there is any correlation between phage infection site, phage DNA location, and cell fate. Under our experimental conditions, phage particles prefer to attach at midcell or at polar positions of the cell for infection (Fig. 8 A), consistent with other reports (8,14,15). Regarding the time-lapse movies at the single-cell/single-phage level under the fluorescence microscope similar to our previous report (8), a majority of the infected cells exhibited either lysis or lysogeny after infection; however, there are two other observations. 1) There are dark infections, where cells have no visible fluorescent phages attached but still lyse or lysogenize. Here, for dam− cells under our experimental conditions, the dark infection is 32 ± 15%, where there are 129 cells with MOI = 0 leading to lytic or lysogenic fate and 276 cells with MOI = 1, and the standard deviation is calculated from different experiments. This rate is higher than that of the wild-type condition (∼5%) reported in our previous work (8), which may indicate that the attached phages are more prone to be sheared off from the cell surface under the conditions in this study. 2) There are failed infections, where cells do not undergo a lytic or lysogenic response even with adsorbed phages (8). The conditions used in this study give 24 ± 10% per phage, where 67 of the total 276 cells with MOI = 1 have no lytic/lysogenic fate. This rate is comparable to the 23% under the wild-type conditions reported previously (8). From the reporter system described here, we observed another population (2 ± 3%, 5 of 276 cells with MOI = 1) in which there are SeqA-ECFP foci inside the cell but no detected cell lysis or lysogeny (increased mCherry expression followed by cell division), which was grouped as failed infections previously. This may indicate successful phage DNA ejection that led to a dead-end developmental pathway, with neither the lytic nor the lysogenic pathway established. Nevertheless, to simplify our particle tracking algorithm and data analysis, we analyze only those cells with MOI = 1 (1 infecting phage per cell, resulting in one SeqA-ECFP fluorescent focus upon phage DNA ejection) and detectable lysis/lysogeny fates and track their phage DNA movements during the entire infection cycle.
Figure 8.
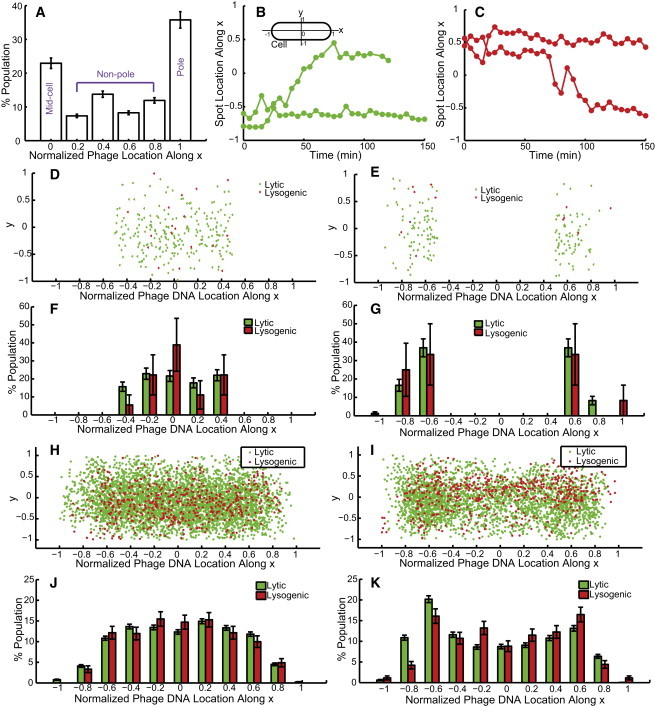
Phage and phage DNA locations. (A) The infecting phages preferentially attach to cell poles or midcell for DNA ejection, in agreement with previous findings. (B and C) Localized motion and motion spanning the entire cell (localized motion + vigorously active motion + localized motion in time) are shown in lytic (B) and lysogenic cells (C). A schematic of the cell coordinates is also shown. (D–K) Statistics (scatter plots (D, E, H, and I) and histograms (F, G, J, and K) for the phage DNA entry point (D–G) and for all phage DNA locations over time (H–K). Phage locations for cells with the phage entry point within the quarter- to midcell region (abs(x) < 0.5) (D and F) show that the entry point is uniformly distributed for lytic cells. A peak appears at midcell, but this might be due to the low sample size. A fairly uniform distribution within the cell over time (H and J) suggests that there are more motions spanning the cell, irrespective of cell type (lysogenic or lytic). Note that the statistics at near-polar regions (−0.8, −1, 0.8, and 1) are very low, which we believe is a result of the spatial restrictions at polar positions. (E, G, I, and K) Location statistics for cells with the phage DNA entry point within the polar to quarter-cell region (abs(x) ≥ 0.5). Phage DNAs show higher occupancy around the quarter-cell region (−0.6 and 0.6) at the entry point (E and G) and also over time (I and K), suggesting that there are more localized motions irrespective of cell type (lysogenic or lytic). Data are shown as mean ± SE (based on counting error). To see this figure in color, go online.
As described in the previous section, phage DNA particles exhibit both localized motion and motion spanning the entire cell. These two distinct motions could be observed for one phage DNA particle at different times or for different phage particles within one cell for both lytic and lysogenic cells. In Fig. 8 B, the localized motion is represented by the lower trajectory. In the upper trajectory the phage DNA first exhibits localized motion, then moves from its polar position to a midcell position, finally settling down at a midcell position until the cell lyses. In a similar way, in a lysogenic cell (Fig. 8 C), the upper trajectory exhibits localized motion throughout the cycle, and the lower trajectory shows more active motion during the same period of time. It appears that these two distinct motions are not specific to cell fate but are purely due to the large phage-DNA-protein complex resulting in nonhomogenous motion. These distinct motions were also observed for RNA-protein complexes in E. coli (43).
As phages prefer to infect the host at polar positions (Fig. 8 A), one might wonder whether the nonhomogenous motions are associated with the DNA ejection sites. To address this question, we grouped the phage DNA locations according to the initial appearance of SeqA-ECFP foci, representing the phage DNA entry point. When the entry point is within the quarter to midcell region (a total of 177 lytic and 20 lysogenic cells), phage DNA location is uniformly distributed in this region (Fig. 8, D and F). When we quantified phage DNA locations over time, we found that phage DNA tends to locate uniformly inside the cell, suggesting that phage DNA exhibits more motions spanning the whole cell (Fig. 8, H and J). Notice that statistics at near-polar regions (−0.8, −1, 0.8, and 1) are very low, which we think is a result of the confined space at polar positions. On the other hand, when the entry point is within the quarter-cell to polar region (a total of 126 lytic and 15 lysogenic cells), the phage DNA location is close to the quarter-cell regions (Fig. 8, E and G) and clusters around the quarter-cell regions over time (Fig. 8, I and K). This indicates either that those phage DNAs exhibit more localized motions in those areas or that they tend to stay there.
In addition, as there are mixtures of phage DNA motions and different roles for phage DNAs in lytic and lysogenic cells over time, we ask whether there is any difference in the preferred position for the whole population and whether phage DNA location affects the cellular decision between lysis and lysogeny. In the lytic cycle, phage DNA replicates to >100 copies and is packaged into phage heads. In the lysogenic cycle, phage DNA is integrated into the host genome, although it is unknown how many rounds of phage DNA replication occur before DNA integration. Interestingly, the average phage DNA location over time and a histogram of phage DNA positions (Fig. 9, A and B, respectively) reveal that phage DNAs, or, to be more exact, the first two parental phage DNAs, spend more time around the quarter-cell regions in the case of both lytic (0.423 ± 0.002 (mean ± SE); Fig. 9 A, green line) and lysogenic cells (0.393 ± 0.007, Fig. 9 A, red line), unlike the behavior of protein aggregates, which accumulate at polar positions (42). In the lytic cells, phage DNA presumably needs room to replicate its DNA and package into its phage head; therefore, it might tend to localize at the less crowded nucleoid-free region to complete this process. In the lysogenic cells, phage DNA might replicate itself for a few rounds at the beginning of the infection cycle with the same reasoning just given for lytic cells. In fact, if we examine the location over the first 50 min for lysogenic cells, the average location is 0.424 ± 0.011 (mean ± SE), the same as that of the lytic cells (Fig. 9 A, magenta over green line). At the later stage, phage DNA is integrated into the host genome at the attB site, which is at 17 min on the E. coli, and moves along with the host genome. This may indicate that the E. coli attB site prefers the quarter-cell positions. The mean location for 50–150 min is 0.377 ± 0.008 (mean ± SE; magenta line). This is indeed consistent with the mean location of the E. coli attB site for infected cells (0.376 ± 0.020, mean ± SE) reported by Tal and co-workers (32). As a reference, Fig. 9 C shows the histogram of phage DNA positions along the cell minor axis over the entire infection cycle, where it can be seen that phage DNA prefers the midcell positions, possibly due to the spatial restrictions along the minor axis.
Figure 9.
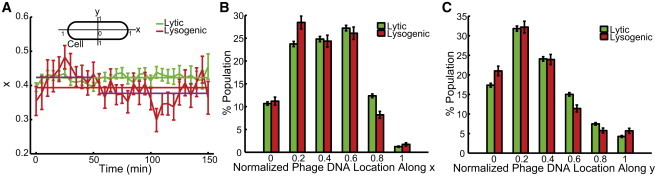
Phage DNA locations for the whole population. (A) Time trace for average phage DNA locations along the cell major axis (x) during the entire infection cycle. Solid lines show the mean location over time. Phage DNAs are preferentially located around the quarter positions of the cell for both lytic (0.42 along x axis) and lysogenic (0.39 along x axis) cells. The average values for lysogenic cells at earlier (0.42) and later stages (0.37) are shown as magenta lines. The definition of the cell coordinates is also shown. (B and C) Histograms of phage DNA locations over the entire infection cycle in x and y, respectively. Phage DNA prefers the region around the quarter positions of the cell along the cell major axis (x) and the midcell positions along the cell minor axis (y) for both lytic and lysogenic cells. To see this figure in color, go online.
Discussion
In this work, we sought to characterize phage DNA dynamics inside the cell and to correlate phage DNA movement with cell fate. We first presented a plasmid-based approach for the construction of stable, well-behaved fluorescent phage λ. This method allows us to label infecting phages conveniently without manipulating the phage genome, thus avoiding any perturbation of phage behavior. Under our experimental conditions, we showed that the fluorescent phage made by gpD-EYFP plasmid pACYC177-PLate∗D-eyfp is structurally stable and bright enough to be detected under the microscope. It is worth noting that different bacterial growth rates due to different growth conditions, e.g., different growth media or temperatures, may result in different numbers of plasmids per cell (47). If growth conditions different from those described here are used to create phage stock, the ratio of gpD-EYFP proteins to wild-type gpD would be different owing to a different plasmid copy number. To fine-tune this ratio to a reasonable value, one may need a gpD-EYFP plasmid with a different expression level. We also created a few other gpD-EYFP plasmids with different expression levels.
To our knowledge, we developed a new technique to label phage DNA in living E. coli cells. This allows us to follow phage DNA dynamics and characterize its motion through high-resolution fluorescence microscopy. Furthermore, we examined the correlation between phage DNA location and the resulting cell fate. The detection of phage DNA in living E. coli cells takes advantage of SeqA protein binding to fully methylated or hemimethylated DNA, but not to unmethylated DNA (26,33,34). The infecting phage is prepared to contain fully methylated phage DNA in its head. The host E. coli is dam−, resulting in no methylation of E. coli DNA and the first two copies of replicated phage DNAs being hemimethylated upon infection by a fully methylated phage. Through the bulk assay, fully methylated fluorescent phages can still exhibit an appropriate lysogenic response in dam− cells similar to wild-type phages in wild-type cells when the lysogenization frequency is normalized to its maximum. The normalization is a standard way to find out the characteristic feature of the system’s lysogenic response (4). Note that here, the absolute lysogenization frequency is around two orders of magnitude lower in the dam− environment than that in wild-type cells through bulk assay (Fig. S4). This drop in lysogenization frequency is probably related to the function of SeqA, which may result in a difficulty in establishing lysogens for normal growth (i.e., normal cell division to form colonies on the plates). In a wild-type E. coli cell, SeqA acts as a regulator for the initiation of E. coli replication through binding to methylated E. coli DNA (39,48,49). Note that as described in the Results section, the lysogenization frequency detected under the microscope by our single-cell assay is ∼10% (35 lysogenic cells versus 303 lytic cells), which allowed us to perform our analysis with reasonable effort.
λ DNA plays different roles over time depending on the lytic or lysogenic cycle (1). Due to the cell-to-cell variability in choice of pathway, here we only characterized the diffusive motion by frequent imaging at the immediately early stage of the phage infection cycle, before the cell/phage commits to either pathway. The phage DNA could be very compact inside the cell due to its circularization and supercoiling. We estimate the phage-DNA-SeqA-ECFP protein complex to be of the order of 100 nm. In the literature, the diffusion coefficient of particles of that size ranges widely, from 10−4 to 10−2 μm2/s, and particles are reported to exhibit subdiffusive or normal diffusive motions (36,37,42). We found that our phage-DNA-protein complex exhibits subdiffusive motion with the subdiffusion scaling exponent α = 0.47 ± 0.03, which is similar to those of different E. coli chromosome loci and RK2 plasmid (19,38). In addition, the apparent diffusion coefficient, Dapp = (2.5 ± 0.9) × 10−3 μm2/s0.47, is also at the same order of magnitude as that of the E. coli chromosome 84 min locus reported by Weber et al. (38). It is not a surprise, then, that is almost constant for lysogenic cells throughout the infection cycle, both before and after the phage DNA is integrated into the E. coli genome.
To address whether the location of phage DNA correlates with cell fate, we followed phage DNA during the entire infection cycle. A recent study with phage DNA labeled by the parS/ParB system revealed that phage DNA only shows confined local motion at the site of phage entry and does not carry out an active search (32). The authors suggested that this confined motion was most likely due to λ DNA becoming anchored to a site on the cellular membrane through which the λ DNA entered the cell. However, we observed both localized motion and active motion spanning the whole cell in both lytic and lysogenic cells. One may ask whether the localized motion corresponds to the ejected DNA and the active motion to replicated DNAs. We observed that active motion can happen right after DNA ejection, corresponding to the initial ejected DNA, which suggests that λ DNA may not always attach to the cell membrane. To see whether a different initial λ DNA location correlates with different motions, we grouped the cells by λ DNA entry point. When the entry point is within the quarter-cell to polar region, phage DNA prefers to stay around the site exhibiting localized motion, which may be attributed to the nucleoid-free feature/characteristics of those areas. At the early stage of the infection cycle, for both lytic and lysogenic cells, phage DNA may prefer to replicate its DNA in those areas. Later on, in lytic cells, phage DNA may prefer those areas in which to package into phage heads, whereas in lysogenic cells, phage DNA moves along with the integrated bacterial attB site located at 17 min on the E. coli genome and may be located at those areas. However, when the entry point is within the midcell to quarter-cell region, phage DNA locations are uniformly distributed over the cell averaged over time, displaying more motions spanning the cell. It is possible that phage DNA needs to travel to areas other than the entry region, such as the quarter-cell region, to replicate its DNA, package, or integrate into the host genome, etc. When we look at the whole population of phage DNA locations, phage DNA shows a preferred location around the quarter-cell region, regardless of whether the cell chooses the lytic or lysogenic pathway.
As described in this article, to our knowledge, our new technique allows us to track the initial copy of the ejected phage DNA and its first replicated copy, which permits us to study phage DNA dynamics. However, this technique constrains us from accessing phage DNA copies other than the first two. Therefore, as a complement to our study, it would be very interesting to use other labeling schemes, such as fluorescent repressor operator systems, to label all phage DNAs and thus gain a full picture of the spatiotemporal dynamics of a phage DNA during the entire infection cycle (50). Interestingly, we also observed some rare cases in which the number of SeqA-ECFP foci changes from 1 to 2, and then, surprisingly, from 2 to 3 for singly infected cells. The unexpected finding of three foci may indicate that the phage DNA undergoes a recombination process during the infection cycle, and this is currently our subject of exploration.
Conclusions
To our knowledge, we provide two new fluorescent techniques, one to label infecting phages and the other to monitor phage λ DNA in live E. coli cells, allowing for quantitative analysis of the phage λ system at the single-molecule/single-phage/single-cell level. These techniques may have many different applications, such as revealing other phage or virus systems and visualizing CRISPR systems. Using these techniques, we characterize the λ DNA movement inside the cell and correlate the movement with cell fate. Like other large particles reported in the literature, the phage-DNA-protein complex exhibits subdiffusive behavior. By following phage DNA during the entire infection cycle, we find that there are two distinct motions: localized motion and motion spanning the whole cell. We also find that there is no correlation between λ DNA movement and cell-fate decision-making. However, after the cell-fate decision is made, the λ DNA movement varies.
Author Contributions
L.Z. designed the study. Q.S., A.H., and L.Z. performed the experiments, analyzed the data, and wrote the article.
Acknowledgments
We thank Ana Babic, Ido Golding, Jennifer Herman, and Ryland Young for generous advice. We are grateful to Martin Marinus, Miroslav Radman, Christopher Rao, and Paul Modrich for providing the strains. We thank members of the Zeng, Herman, and Young laboratories for providing help with experiments. We thank James Hu, Jimmy Trinh, and Ryland Young for commenting on the earlier versions of this article.
Work in the Zeng lab was supported by start-up funds from Texas A&M University.
Supporting Material
At t = 0 min, a cell was infected by a phage (green dot) at a polar position. At t = 5 min, a SeqAECFP focus corresponding to the ejected phage DNA appeared. Later on, this focus converted to two foci corresponding to two hemimethylated phage DNAs. Occasionally, the number of foci became 1 or 0, since the fluorescent spots move out of the focal plane. Finally, the cell lysed.
At t = 0 min, a cell was infected by a phage (green dot) around a quarter-cell position. At t = 5 min, a SeqA-ECFP focus corresponding to the ejected phage DNA appeared. Later on, this focus converted to two foci corresponding to two hemimethylated phage DNAs. Occasionally, the number of foci became one or zero, since the fluorescent spots move out of the focal plane. At a later time, the two foci are divided into two daughter cells.
References
- 1.Hendrix R.W. Cold Spring Harbor Laboratory; Cold Spring Harbor, NY: 1983. Lambda II. [Google Scholar]
- 2.Ptashne M. 3rd ed. Cold Spring Harbor Laboratory; Cold Spring Harbor, NY: 2004. A Genetic Switch: Phage Lambda Revisited. [Google Scholar]
- 3.Court D.L., Oppenheim A.B., Adhya S.L. A new look at bacteriophage λ genetic networks. J. Bacteriol. 2007;189:298–304. doi: 10.1128/JB.01215-06. [DOI] [PMC free article] [PubMed] [Google Scholar]
- 4.Kourilsky P. Lysogenization by bacteriophage λ. I. Multiple infection and the lysogenic response. Mol. Gen. Genet. 1973;122:183–195. doi: 10.1007/BF00435190. [DOI] [PubMed] [Google Scholar]
- 5.Kourilsky P., Gros D. Lysogenization by bacteriophage λ IV inhibition of phage DNA synthesis by the products of genes cII and cIII. Biochimie. 1976;58:1321–1327. doi: 10.1016/s0300-9084(77)80015-1. [DOI] [PubMed] [Google Scholar]
- 6.Kourilsky P., Knapp A. Lysogenization by bacteriophage λ. III. Multiplicity dependent phenomena occuring upon infection by λ. Biochimie. 1974;56:1517–1523. [PubMed] [Google Scholar]
- 7.Oppenheim A.B., Kobiler O., Adhya S. Switches in bacteriophage λ development. Annu. Rev. Genet. 2005;39:409–429. doi: 10.1146/annurev.genet.39.073003.113656. [DOI] [PubMed] [Google Scholar]
- 8.Zeng L., Skinner S.O., Golding I. Decision making at a subcellular level determines the outcome of bacteriophage infection. Cell. 2010;141:682–691. doi: 10.1016/j.cell.2010.03.034. [DOI] [PMC free article] [PubMed] [Google Scholar]
- 9.St-Pierre F., Endy D. Determination of cell fate selection during phage λ infection. Proc. Natl. Acad. Sci. USA. 2008;105:20705–20710. doi: 10.1073/pnas.0808831105. [DOI] [PMC free article] [PubMed] [Google Scholar]
- 10.Arkin A., Ross J., McAdams H.H. Stochastic kinetic analysis of developmental pathway bifurcation in phage λ-infected Escherichia coli cells. Genetics. 1998;149:1633–1648. doi: 10.1093/genetics/149.4.1633. [DOI] [PMC free article] [PubMed] [Google Scholar]
- 11.Joh R.I., Weitz J.S. To lyse or not to lyse: transient-mediated stochastic fate determination in cells infected by bacteriophages. PLOS Comput. Biol. 2011;7:e1002006. doi: 10.1371/journal.pcbi.1002006. [DOI] [PMC free article] [PubMed] [Google Scholar]
- 12.Weitz J.S., Mileyko Y., Voit E.O. Collective decision making in bacterial viruses. Biophys. J. 2008;95:2673–2680. doi: 10.1529/biophysj.108.133694. [DOI] [PMC free article] [PubMed] [Google Scholar]
- 13.Banuett F., Hoyt M.A., Herskowitz I. hflB, a new Escherichia coli locus regulating lysogeny and the level of bacteriophage λ cII protein. J. Mol. Biol. 1986;187:213–224. doi: 10.1016/0022-2836(86)90229-9. [DOI] [PubMed] [Google Scholar]
- 14.Edgar R., Rokney A., Oppenheim A.B. Bacteriophage infection is targeted to cellular poles. Mol. Microbiol. 2008;68:1107–1116. doi: 10.1111/j.1365-2958.2008.06205.x. [DOI] [PMC free article] [PubMed] [Google Scholar]
- 15.Rothenberg E., Sepúlveda L.A., Golding I. Single-virus tracking reveals a spatial receptor-dependent search mechanism. Biophys. J. 2011;100:2875–2882. doi: 10.1016/j.bpj.2011.05.014. [DOI] [PMC free article] [PubMed] [Google Scholar]
- 16.Thanbichler M., Shapiro L. Getting organized—how bacterial cells move proteins and DNA. Nat. Rev. Microbiol. 2008;6:28–40. doi: 10.1038/nrmicro1795. [DOI] [PubMed] [Google Scholar]
- 17.Bi E.F., Lutkenhaus J. FtsZ ring structure associated with division in Escherichia coli. Nature. 1991;354:161–164. doi: 10.1038/354161a0. [DOI] [PubMed] [Google Scholar]
- 18.Rothfield L., Taghbalout A., Shih Y.L. Spatial control of bacterial division-site placement. Nat. Rev. Microbiol. 2005;3:959–968. doi: 10.1038/nrmicro1290. [DOI] [PubMed] [Google Scholar]
- 19.Weber S.C., Spakowitz A.J., Theriot J.A. Bacterial chromosomal loci move subdiffusively through a viscoelastic cytoplasm. Phys. Rev. Lett. 2010;104:238102. doi: 10.1103/PhysRevLett.104.238102. [DOI] [PMC free article] [PubMed] [Google Scholar]
- 20.Alvarez L.J., Thomen P., Chatenay D. Propagation of fluorescent viruses in growing plaques. Biotechnol. Bioeng. 2007;96:615–621. doi: 10.1002/bit.21110. [DOI] [PubMed] [Google Scholar]
- 21.Zhang N., Young R. Complementation and characterization of the nested Rz and Rz1 reading frames in the genome of bacteriophage λ. Mol. Gen. Genet. 1999;262:659–667. doi: 10.1007/s004380051128. [DOI] [PubMed] [Google Scholar]
- 22.Barondess J.J., Beckwith J. bor gene of phage λ, involved in serum resistance, encodes a widely conserved outer membrane lipoprotein. J. Bacteriol. 1995;177:1247–1253. doi: 10.1128/jb.177.5.1247-1253.1995. [DOI] [PMC free article] [PubMed] [Google Scholar]
- 23.Herman G.E., Modrich P. Escherichia coli K-12 clones that overproduce dam methylase are hypermutable. J. Bacteriol. 1981;145:644–646. doi: 10.1128/jb.145.1.644-646.1981. [DOI] [PMC free article] [PubMed] [Google Scholar]
- 24.Szyf M., Avraham-Haetzni K., Razin A. DNA methylation pattern is determined by the intracellular level of the methylase. Proc. Natl. Acad. Sci. USA. 1984;81:3278–3282. doi: 10.1073/pnas.81.11.3278. [DOI] [PMC free article] [PubMed] [Google Scholar]
- 25.Zeng L., Golding I. Following cell-fate in E. coli after infection by phage λ. J. Vis. Exp. 2011;(56):e3363. doi: 10.3791/3363. [DOI] [PMC free article] [PubMed] [Google Scholar]
- 26.Babic A., Lindner A.B., Radman M. Direct visualization of horizontal gene transfer. Science. 2008;319:1533–1536. doi: 10.1126/science.1153498. [DOI] [PubMed] [Google Scholar]
- 27.Datsenko K.A., Wanner B.L. One-step inactivation of chromosomal genes in Escherichia coli K-12 using PCR products. Proc. Natl. Acad. Sci. USA. 2000;97:6640–6645. doi: 10.1073/pnas.120163297. [DOI] [PMC free article] [PubMed] [Google Scholar]
- 28.Mackay D.J., Bode V.C. Events in λ injection between phage adsorption and DNA entry. Virology. 1976;72:154–166. doi: 10.1016/0042-6822(76)90320-2. [DOI] [PubMed] [Google Scholar]
- 29.Skinner S.O., Sepúlveda L.A., Golding I. Measuring mRNA copy number in individual Escherichia coli cells using single-molecule fluorescent in situ hybridization. Nat. Protoc. 2013;8:1100–1113. doi: 10.1038/nprot.2013.066. [DOI] [PMC free article] [PubMed] [Google Scholar]
- 30.Van Valen D., Wu D., Phillips R. A single-molecule Hershey-Chase experiment. Curr. Biol. 2012;22:1339–1343. doi: 10.1016/j.cub.2012.05.023. [DOI] [PMC free article] [PubMed] [Google Scholar]
- 31.St-Pierre F. Massachusetts Institute of Technology; Cambridge, MA: 2009. Determination of Cell Fate Selection During Phage λ Infection. PhD thesis. [Google Scholar]
- 32.Tal A., Arbel-Goren R., Stavans J. Location of the unique integration site on an Escherichia coli chromosome by bacteriophage λ DNA in vivo. Proc. Natl. Acad. Sci. USA. 2014;111:7308–7312. doi: 10.1073/pnas.1324066111. [DOI] [PMC free article] [PubMed] [Google Scholar]
- 33.Słomińska M., Konopa G., Wegrzyn A. Interplay between DnaA and SeqA proteins during regulation of bacteriophage λ pR promoter activity. J. Mol. Biol. 2003;329:59–68. doi: 10.1016/s0022-2836(03)00378-4. [DOI] [PubMed] [Google Scholar]
- 34.Slomińska M., Wegrzyn A., Wegrzyn G. SeqA, the Escherichia coli origin sequestration protein, is also a specific transcription factor. Mol. Microbiol. 2001;40:1371–1379. doi: 10.1046/j.1365-2958.2001.02480.x. [DOI] [PubMed] [Google Scholar]
- 35.Kobiler O., Rokney A., Oppenheim A.B. Quantitative kinetic analysis of the bacteriophage λ genetic network. Proc. Natl. Acad. Sci. USA. 2005;102:4470–4475. doi: 10.1073/pnas.0500670102. [DOI] [PMC free article] [PubMed] [Google Scholar]
- 36.Golding I., Cox E.C. Physical nature of bacterial cytoplasm. Phys. Rev. Lett. 2006;96:098102. doi: 10.1103/PhysRevLett.96.098102. [DOI] [PubMed] [Google Scholar]
- 37.Parry B.R., Surovtsev I.V., Jacobs-Wagner C. The bacterial cytoplasm has glass-like properties and is fluidized by metabolic activity. Cell. 2014;156:183–194. doi: 10.1016/j.cell.2013.11.028. [DOI] [PMC free article] [PubMed] [Google Scholar]
- 38.Weber S.C., Spakowitz A.J., Theriot J.A. Nonthermal ATP-dependent fluctuations contribute to the in vivo motion of chromosomal loci. Proc. Natl. Acad. Sci. USA. 2012;109:7338–7343. doi: 10.1073/pnas.1119505109. [DOI] [PMC free article] [PubMed] [Google Scholar]
- 39.Brendler T., Austin S. Binding of SeqA protein to DNA requires interaction between two or more complexes bound to separate hemimethylated GATC sequences. EMBO J. 1999;18:2304–2310. doi: 10.1093/emboj/18.8.2304. [DOI] [PMC free article] [PubMed] [Google Scholar]
- 40.Han J.S., Kang S., Hwang D.S. Binding of SeqA protein to hemi-methylated GATC sequences enhances their interaction and aggregation properties. J. Biol. Chem. 2004;279:30236–30243. doi: 10.1074/jbc.M402612200. [DOI] [PubMed] [Google Scholar]
- 41.Phillips R. 2nd ed. Garland Science; New York: 2013. Physical Biology of the Cell. [Google Scholar]
- 42.Coquel A.S., Jacob J.P., Berry H. Localization of protein aggregation in Escherichia coli is governed by diffusion and nucleoid macromolecular crowding effect. PLOS Comput. Biol. 2013;9:e1003038. doi: 10.1371/journal.pcbi.1003038. [DOI] [PMC free article] [PubMed] [Google Scholar]
- 43.Golding I., Cox E.C. RNA dynamics in live Escherichia coli cells. Proc. Natl. Acad. Sci. USA. 2004;101:11310–11315. doi: 10.1073/pnas.0404443101. [DOI] [PMC free article] [PubMed] [Google Scholar]
- 44.Hendrix R.W., Duda R.L. Bacteriophage λ PaPa: not the mother of all λ phages. Science. 1992;258:1145–1148. doi: 10.1126/science.1439823. [DOI] [PubMed] [Google Scholar]
- 45.Greer H. The kil gene of bacteriophage λ. Virology. 1975;66:589–604. doi: 10.1016/0042-6822(75)90231-7. [DOI] [PubMed] [Google Scholar]
- 46.Conter A., Bouché J.P., Dassain M. Identification of a new inhibitor of essential division gene ftsZ as the kil gene of defective prophage Rac. J. Bacteriol. 1996;178:5100–5104. doi: 10.1128/jb.178.17.5100-5104.1996. [DOI] [PMC free article] [PubMed] [Google Scholar]
- 47.Lin-Chao S., Bremer H. Effect of the bacterial growth rate on replication control of plasmid pBR322 in Escherichia coli. Mol. Gen. Genet. 1986;203:143–149. doi: 10.1007/BF00330395. [DOI] [PubMed] [Google Scholar]
- 48.Slater S., Wold S., Kleckner N. E. coli SeqA protein binds oriC in two different methyl-modulated reactions appropriate to its roles in DNA replication initiation and origin sequestration. Cell. 1995;82:927–936. doi: 10.1016/0092-8674(95)90272-4. [DOI] [PubMed] [Google Scholar]
- 49.Lu M., Campbell J.L., Kleckner N. SeqA: a negative modulator of replication initiation in E. coli. Cell. 1994;77:413–426. doi: 10.1016/0092-8674(94)90156-2. [DOI] [PubMed] [Google Scholar]
- 50.Lau I.F., Filipe S.R., Sherratt D.J. Spatial and temporal organization of replicating Escherichia coli chromosomes. Mol. Microbiol. 2003;49:731–743. doi: 10.1046/j.1365-2958.2003.03640.x. [DOI] [PubMed] [Google Scholar]
Associated Data
This section collects any data citations, data availability statements, or supplementary materials included in this article.
Supplementary Materials
At t = 0 min, a cell was infected by a phage (green dot) at a polar position. At t = 5 min, a SeqAECFP focus corresponding to the ejected phage DNA appeared. Later on, this focus converted to two foci corresponding to two hemimethylated phage DNAs. Occasionally, the number of foci became 1 or 0, since the fluorescent spots move out of the focal plane. Finally, the cell lysed.
At t = 0 min, a cell was infected by a phage (green dot) around a quarter-cell position. At t = 5 min, a SeqA-ECFP focus corresponding to the ejected phage DNA appeared. Later on, this focus converted to two foci corresponding to two hemimethylated phage DNAs. Occasionally, the number of foci became one or zero, since the fluorescent spots move out of the focal plane. At a later time, the two foci are divided into two daughter cells.