

Abstract
Solid-state NMR has been used to determine the structures of membrane proteins in native-like lipid bilayer environments. Most structure calculations based on solid-state NMR observables are performed using simulated annealing with restrained molecular dynamics and an energy function, where all nonbonded interactions are represented by a single, purely repulsive term with no contributions from van der Waals attractive, electrostatic, or solvation energy. To our knowledge, this is the first application of an ensemble dynamics technique performed in explicit membranes that uses experimental solid-state NMR observables to obtain the refined structure of a membrane protein together with information about its dynamics and its interactions with lipids. Using the membrane-bound form of the fd coat protein as a model membrane protein and its experimental solid-state NMR data, we performed restrained ensemble dynamics simulations with different ensemble sizes in explicit membranes. For comparison, a molecular dynamics simulation of fd coat protein was also performed without any restraints. The average orientation of each protein helix is similar to a structure determined by traditional single-conformer approaches. However, their variations are limited in the resulting ensemble of structures with one or two replicas, as they are under the strong influence of solid-state NMR restraints. Although highly consistent with all solid-state NMR observables, the ensembles of more than two replicas show larger orientational variations similar to those observed in the molecular dynamics simulation without restraints. In particular, in these explicit membrane simulations, Lys40, residing at the C-terminal side of the transmembrane helix, is observed to cause local membrane curvature. Therefore, compared to traditional single-conformer approaches in implicit environments, solid-state NMR restrained ensemble simulations in explicit membranes readily characterize not only protein dynamics but also protein-lipid interactions in detail.
Introduction
Solid-state nuclear magnetic resonance (NMR) spectroscopy is a powerful method for determining the structures of membrane proteins in native-like phospholipid bilayer membranes. Measurements of dipolar coupling (DC) and chemical shift anisotropy (CSA) solid-state NMR signals provide precise orientation-dependent restraints that can be used to determine the three-dimensional structure and global orientation of a membrane embedded in phospholipid bilayers (1,2). Solid-state and solution NMR observables represent time- and ensemble-averaged measurements and therefore contain information about both structure and dynamics (3–5). Recently, we developed an ensemble dynamics (ED) technique that uses solid-state NMR observables and enables detailed characterization of the orientational fluctuations of transmembrane helices (6,7). In those calculations, the membrane was represented implicitly with the lipid bilayer modeled as a static slab of fixed width and a low dielectric constant in the hydrophobic core to mimic the properties of biological membranes. However, even though such implicit model calculations are computationally efficient (8,9), they cannot provide detailed atomic-level information about protein-lipid interactions.
By contrast, calculations performed with explicit representation of the lipid bilayer membrane reflect the atomic-level interactions of proteins with the surrounding lipid molecules, as the phospholipid bilayer is fluid and deformable. For example, in our recent structural refinement of the membrane-embedded Pf1 coat protein using NMR-restrained molecular dynamics (MD) simulations, a relatively large thermal motion (∼8 Å) of the transmembrane helix along the membrane normal was observed (10). Even at the limits of such a large-amplitude fluctuation, only a few transmembrane hydrophobic residues near the membrane interface were exposed to water molecules, because both the membrane-embedded protein and the surrounding lipid molecules can dynamically adjust to complement each other during the simulations. In another recent MD simulation study of gramicidin A in membranes of various phospholipid compositions, Kim et al. observed that local changes in lipid packing are induced by protein-lipid interactions, and that these changes lead to variations in lipid bilayer thickness as a function of radial distance from the gramicidin A channel (11). Such bilayer adaptations resulting from the interactions of membrane proteins with lipids are difficult to model in simulations performed in implicit membranes, because most implicit-membrane models cannot capture the adaptation of lipids to protein.
In this study, we describe a solid-state NMR-restrained ED protocol for membrane protein structure refinement in explicit bilayer membranes. By incorporating the effect of the fluid lipid bilayer, it is expected that this ED approach in explicit membranes can readily characterize not only protein dynamics but also protein-lipid interactions, while maintaining agreement with the experimental NMR data. As a first application of this approach, the membrane-bound form of the major, pVIII coat protein from filamentous fd bacteriophage (hereinafter called fd coat protein) is used as a model membrane protein. The fd coat protein resides within the membrane of infected bacteria before assembling into new virus particles (12,13). In its membrane-embedded state, it forms an N-terminal periplasmic helix (residues 8–18) that lies on the membrane surface and a transmembrane helix (residues 21–45), and these helices are linked by a short turn (residues 19–20) (12). During bacteriophage assembly, the transmembrane helix extrudes from the bacterial membrane, while positively charged side chains in its C-terminus interact with the bacteriophage’s DNA, which is packaged in the new phage particle (13).
The previously reported structure of membrane-inserted fd coat protein (PDB:1MZT) was determined using 15N CSA and 1H-15N DC frequencies measured in PISEMA NMR resonances (12). These frequencies depend on the orientations of the corresponding molecular sites and provide orientational restraints for structure determination. As one of the first examples of membrane protein structure determination by solid-state NMR, the fd coat protein structure was calculated by converting the experimental NMR frequencies into backbone dihedral angles without including the side chains, without refinement by simulated annealing, and without considering environmental effects. Using this previously reported structure and all its experimental solid-state NMR observables (12), we performed restrained ED simulations of fd coat protein in explicit phospholipid bilayers. To determine an optimal ensemble size for extracting dynamics of the protein and characterizing its interactions with the lipid molecules, different numbers of replicas were used to investigate the influence of solid-state NMR restraints on the resulting ensemble structures and dynamics. In addition, a standard MD simulation without solid-state NMR restraints was performed, and its results were compared with those from solid-state NMR-restrained ED simulations.
Materials and Methods
Solid-state NMR ensemble restraint potentials
We implemented the solid-state NMR ensemble restraint potentials (6) as simple harmonic restraint potentials in CHARMM (14). is applied over a certain number of replicas to constrain the ensemble-averaged property, , to the experimental value, , at each simulation time step:
| (1) |
where is either 15N CSA or 1H-15N DC, is the number of target experimental observables, and is the force constant (see Lee et al. (15) for detailed calculation methods for each solid-state NMR observable). To avoid overfitting the protein structure to the experimental data, we performed cross-validation of the restraint potentials with different force constants (6,16,17). Using this approach, we determined an optimal set of force constants for kCSA = 0.01 kcal/(mol·ppm2) and kDC = 0.5 kcal/(mol·kHz2). The total potential energy of the ensemble system is
| (2) |
where is the standard CHARMM potential energy.
Simulations in explicit lipid bilayers
Membrane Builder (18,19) in CHARMM-GUI (www.charmm-gui.org/input/membrane) (20) was used to insert the fd coat protein structure (PDB:1MZT) (12) into a phospholipid bilayer composed of a 4:1 molar mixture of POPC (palmitoyl-oleoyl-phosphatidylcholine) and POPG (palmitoyl-oleoyl-phosphatidylglycerol), consistent with the experimental conditions. In addition, 150 mM KCl was used for all simulations.
The ED simulation system (Fig. 1) has an initial size of 56.3 Å × 56.3 Å × 71.9 Å and contains 68 POPC, 17 POPG, and 3488 water molecules, yielding a total number of 22,499 atoms. To examine the impact of solid-state NMR restraints on structure and dynamics as a function of ensemble size, six solid-state NMR-restrained ED simulation systems were built: ED1, ED2, ED4, ED8, ED16, and ED32 with numbers 1, 2, 4, 8, 16, and 32 indicating the number of protein replicas (Table 1). All available experimental solid-state NMR restraints of PDB:1MZT (Table S1 in the Supporting Material) were applied in each restrained system. To avoid a bias resulting from an unequal number of replicas, all calculations were performed with an equal total number of 32 replicas in each system (Table 1). Each replica was assigned with different initial velocities. All calculations were performed in NPT (constant particle number, pressure, and temperature) ensemble (21) at 295.15 K using CHARMM (14). We used the CHARMM all-atom protein force field (22), including the dihedral cross-term correction (23), the CHARMM36 lipid force field (24), and a modified TIP3P water model (25). To account for potential differences in the number of lipid molecules present in each bilayer leaflet due to the location of the N-terminal periplasmic helix on the membrane surface, we used the P21 periodic boundary condition (26) that allows lipid molecules to move between the upper and lower leaflets of the bilayer during the simulations. A time step of 1 fs was used for all ED simulations with the SHAKE algorithm (27), as the ED simulations with 2 fs were not stable due to the solid-state NMR restraint potentials. Each initial system was equilibrated for 15 ns; van der Waals interactions were smoothly switched off at 10–12 Å by a force-switching function (28) and the electrostatic interactions were calculated using the particle mesh Ewald method (29) with a mesh size of ∼1 Å for fast Fourier transformation, κ = 0.34 Å−1, and a sixth-order B-spline interpolation. After equilibration, a 30-ns production was performed for each solid-state NMR ED simulation. All the analyses were done using the last 20 ns of ED simulation trajectories and are presented as an average of replicas in the ensembles. The variations are the standard deviations from the average.
Figure 1.
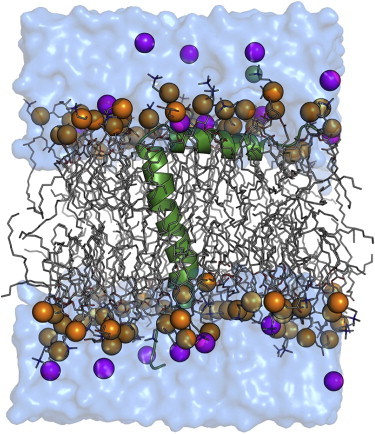
ED simulation system of fd coat protein in a POPC/POPG bilayer. The protein is shown as a cartoon (green); lipids are shown as sticks with phosphorus atoms as spheres (orange); ions are shown as spheres (potassium in magenta and chloride in green); and water is shown as surface (blue). To see this figure in color, go online.
Table 1.
System information
| System ID | No. of Replicas per Ensemble | No. of Ensembles per System |
|---|---|---|
| ED1 | 1 | 32 |
| ED2 | 2 | 16 |
| ED4 | 4 | 8 |
| ED8 | 8 | 4 |
| ED16 | 16 | 2 |
| ED32 | 32 | 1 |
| MD1 | 1 | 1 |
For a standard, unrestrained MD simulation, the MD1 system had a greater initial size (81.2 Å × 81.2 Å × 82.3 Å) and thus larger total number of atoms (54,391) to meet the technical requirements for simulations on the Anton computer (30). The MD1 system has 148 POPC, 37 POPG, and 9688 water molecules. We performed a 15-ns equilibration and a 500-ns production on Anton (30) using the CHARMM36 force field (22–25). The simulations were performed at constant temperature (295.15 K) and pressure (1 atm) using the Nosé-Hoover thermostat and the semi-isotropic Martyna-Tuckerman-Tobias-Klein barostat (31,32). The time step was 2 fs, and trajectories were saved every 240 ps. Short-range nonbonded and long-range electrostatic interactions were evaluated with a cutoff of 9.52 Å every 2 fs and 6 fs, respectively. Long-range electrostatic interactions were calculated using the k-Gaussian split Ewald method (33) with a 64 × 64 × 64 grid. SHAKE was used to constrain all bonds involving hydrogen atoms. The last 200-ns trajectory of the MD1 simulation was used for analysis.
Results and Discussion
Validation of solid-state NMR restrained ED
When the average root mean-squared deviation (RMSD) of back-calculated CSA of a simulation structure (or an ensemble of structures) from the experimental CSA is <10 ppm, we consider that the structure satisfies the experimental CSA. In terms of DC, the criterion is 1 kHz. The average CSA and DC RMSDs of PDB:1MZT are 5.7 ppm and 0.7 kHz (Fig. S1, A and B). Since the solid-state NMR restraints were applied over an ensemble, by definition, the CSA and DC RMSDs for each replica in a certain ensemble do not necessarily satisfy the experimental solid-state NMR observables (Fig. S1, E and F). However, the ensemble-averaged CSA and DC RMSD are very similar to the experimental measures (Fig. S1, C and D). The data in Fig. 2 and Table S1 show that the ensemble structures resulting from all solid-state NMR restrained ED simulations satisfy the experimental solid-state NMR data. As the number of replicas per ensemble increases, the RMSDs of the CSA and DC decrease (Fig. 2), indicating that the resulting structure ensembles obtained with more replicas better represent the experimental data. The same trend was observed in our previous solid-state NMR restrained ED simulations performed in implicit membranes (6,7). The CSA and DC RMSDs observed for MD1, performed without solid-state NMR restraints, are around fivefold larger than those for ED1.
Figure 2.
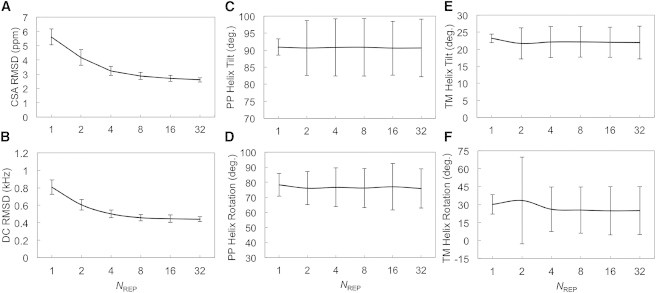
Validation of fd coat protein structure ensemble. (A and B) CSA and DC RMSD with respect to the experimental observables as a function of the number of replicas per ensemble simulation. (C and D) Tilt and rotation angles of the periplasmic helix of fd coat protein. (E and F) Tilt and rotation angles of the transmembrane helix of fd coat protein. The tilt angle is defined as the angle between the helix principal axis and the lipid bilayer normal. The rotation angle is defined as the angle between the perpendicular vector (rs) from the helical axis to a Cα atom (S13 for the periplasmic helix and G34 for the transmembrane helix) and the projection vector (zp) of the Z axis onto the plane made by the second and third principal axes. The sign of the rotational angle becomes positive if zp × rs is in the opposite direction to the helical axis or negative otherwise. The error bars are the standard deviations from the average.
A number of factors contribute to the observed RMSDs and complicate the precise reproduction of the experimental NMR data with the restrained ED simulations. The use of a single order tensor for the entire protein does not accurately represent the actual system, where the order parameter of a membrane-embedded site is likely greater than that of a water-exposed site. Furthermore, the use of a single 15N CSA tensor for all amino acids in the protein facilitates the calculations but also contributes to the 15N CSA RMSD. In a similar way, uncertainty about the precise length of the amide NH bond, as well as the use of a single value for all amino acids, contribute to the 1H-15N DC RMSD. Furthermore, the relative values of the restraining force constants for 15N CSA and 1H-15N DC have been shown to affect structure calculations (17). In the context of MD calculations, it is difficult to reproduce the experimental solid-state NMR data directly from standard MD simulations (as in MD1), because the individual residues are not restrained by experimental data and thus have more orientational degrees of freedom. Since a change in the orientation of a molecular site leads to a distinctive solid-state NMR measurement, subtle differences in the orientation and conformation of fd coat protein during MD can lead to large RMSDs. Given the complicating factors described above, it is notable that the unrestrained standard MD simulation can produce a reasonable level of agreement with the experimental data. We anticipate that future calculations performed with more realistic order parameters for different protein segments, different values of the 15N CSA and 1H-15N DC NMR spin tensors, and possibly different values of the restraining force constants, will yield structures with lower CSA and DC RMSDs that are closer to the experimental uncertainties (i.e., ±1 ppm in CSA and ±0.25 kHz in DC).
In all ED and MD simulations, the backbone-atom RMSD relative to the PDB structure is between 4.5 and 4.8 Å, when all residues (1–50) are included in the calculation. This is a relatively large structural deviation for a small membrane protein like fd coat protein. However, the backbone RMSD becomes smaller (between 2.4 and 3.0 Å) when only helical residues (residues 8–18 and 21–45) are included, indicating structural flexibility of the turn and terminal residues. Furthermore, as shown in Table S1, the N-terminal periplasmic helix (residues 8–18) has backbone-atom RMSDs (0.4–0.5 Å) smaller than those (2.2–2.5 Å) of the transmembrane helix (residues 21–45). Although both segments Y21–A35 and G38–F45 in the transmembrane helix have backbone RMSD in the range of 1.2 Å, it is their different relative orientation that contributes to the higher overall RMSD with respect to the PDB structure. As shown in Fig. S2, the average per-residue RMSDs for the solid-state NMR restraints are <10 ppm for CSA and <1.5 kHz for DC for all transmembrane helix residues (Y21–F45) in all six ED systems. This suggests that the structures from all ED simulations generally have different transmembrane conformations from PDB:1MZT, but they also satisfy the experimental observables very well, as described in more detail below.
Influence of solid-state NMR restraints on helix orientations
As shown in Fig. 2, C–F, the ensemble-averaged helix tilt angles (with respect to the membrane normal) and helix rotation angles (along the helix axis) are similar in all ED systems, and they also agree with those of the PDB structure (tilt angles of 91.7° for periplasmic and 20.5° for transmembrane helices, and rotation angles of 76.2° for periplasmic and 25.7° for transmembrane helices). However, the variations for tilt and rotation angles in ED1 are obviously smaller than those in ED2, ED4, ED8, ED16, and ED32, each of which has multiple replicas. In a similar way, as shown in Fig. 3, ED1 always yields highly homogenous orientational populations in terms of tilt angles, indicating that such single-conformer simulations are under a large influence of the solid-state NMR restraints. In Fig. 3 A, system ED2 presents two major orientational populations of the periplasmic helix. However, no visible, distinct interatomic interactions are observed that might cause such a difference of ED2 from the other ED simulation systems. Theoretically, it has been shown that restrained ED simulations provide maximum-likelihood distributions that satisfy the imposed restraints (34,35). These distinct populations in ED2 disappear in the ensembles calculated with more replicas, and are likely an artifact of applying ensemble-averaged restraints with a too small number of replicas. In addition, the distributions obtained from ED4, ED8, ED16, and ED32 are very similar, and their broadness is comparable to that of MD1, indicating that the minimal optimal number of replicas is 4 for these ED simulations.
Figure 3.
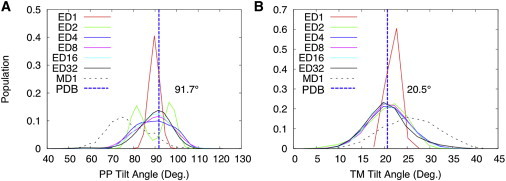
Distributions of the tilt angles of the periplasmic helix (A) and the transmembrane helix (B) with respect to the membrane normal. To see this figure in color, go online.
Flexibility of transmembrane helix conformations in simulations
In the PDB structure, a visible kink in the transmembrane helix occurs at I37 with an angle of 17.7°. Such pronounced kinks (>15°) at I37 are rarely observed in the ED and MD simulations, and most structural populations appear to have a straight transmembrane helix (Fig. 4). We note that the PDB structure was calculated directly from the NMR data, only for backbone atoms, without applying any refinement protocol. Improvements in structural quality upon refinement of NMR structures in the presence of either implicit or explicit solution are well known (15,36–39). Therefore, structure calculation using restrained ED in an explicit lipid bilayer membrane, as described here, is expected to yield a significant improvement in quality. To further examine the transmembrane helix structure that best fits the solid-state NMR data, we selected 32 structures with the lowest NMR restraint violations; in this population, the transmembrane helix structures have RMSDs of <3.5 ppm in CSA and <0.8 kHz in DC. Within this population, a few structures have a transmembrane helix kink angle near 17° (Fig. 4 B), as observed in PDB:1MZT, indicating that the latter still represents a thermally accessible conformation of the transmembrane helix (Fig. 4, C–H) with relatively low population. The kink angle distribution range is ∼25° in multiple-replica systems, indicating that the transmembrane helix has flexibility near its C-terminal end. Notably, two adjacent glycines (G34/G38) lining the same side of the transmembrane helix seem to help confer flexibility in this region of the protein.
Figure 4.
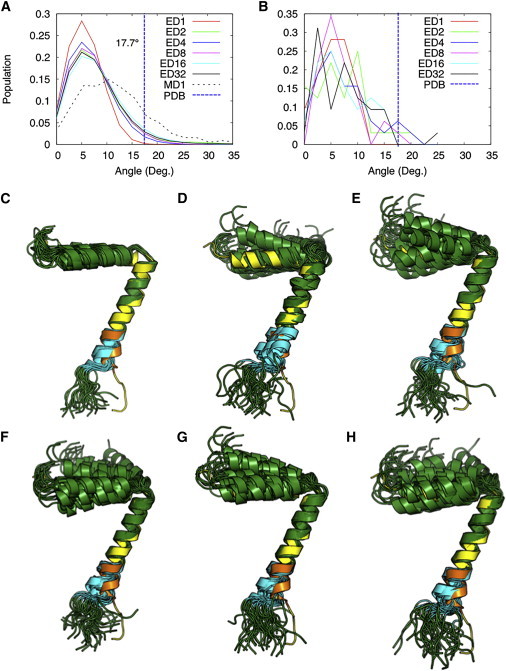
(A and B) Distributions of the angles between the principal axes of two transmembrane helical segments Y21–A35 and G38–F45 in all structures from simulations (A) and the top 32 structures with the least NMR violations (B). (C–H) The top 32 structures (green) are aligned to PDB:1MZT (yellow) with respect to Y21–T36 in systems ED1 (C), ED2 (D), ED4 (E), ED8 (F), ED16 (G), and ED32 (H). The G38–F45 region is highlighted in orange in PDB:1MZT and in cyan in the top 32 structures. To see this figure in color, go online.
Protein-lipid interactions in explicit membranes
The flexibility of the transmembrane helix at the C-terminus could be functionally important. During bacteriophage extrusion across the bacterial membrane, flexibility in this region could facilitate binding of bacteriophage DNA by the charged amino groups of lysine side chains (K40, K43, and K44), and thus assist bacteriophage packaging. In all ED and MD simulations, these three lysine residues near the C-terminus make frequent interactions with the lipid polar headgroups, lipid hydrocarbon tails, and surrounding water, and thus help anchor the transmembrane helix within the membrane (Fig. 5 and Fig. S3). Interestingly, even though K40 is positioned close to the hydrophobic core, lipids in the lower leaflet (i.e., the C-terminal side) can move up and adjust themselves to have the charged side chain of K40 exposed to the solvent. As shown in Fig. 6 A, using ED32 as a representative system, the Z coordinates of lipid phosphorus atoms near K40 (black area) are closer to the bilayer center. In other words, mainly K40 can induce membrane curvature (i.e., the membrane thinning near K40), which is observed in all ED and MD simulations. It is interesting to see lipid deformation induced by fd coat protein that is involved in the assembly and extrusion of virus particle (40), but linking this observation to the protein function characterization is beyond our scope.
Figure 5.
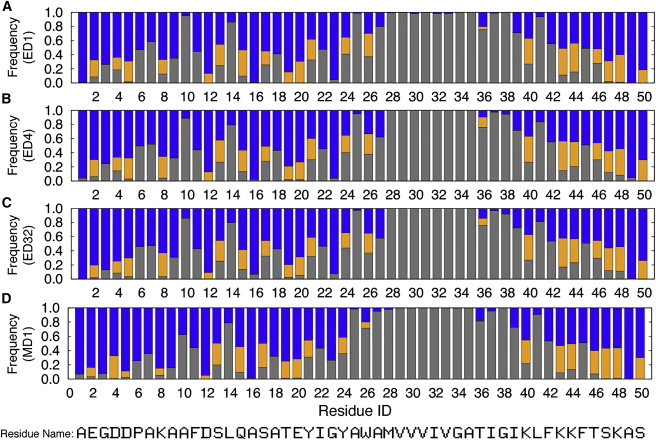
Interactions between each residue and solvent components. The graph shows the frequency with which each atom or more atoms of a specific residue is found within 4 Å of a lipid hydrocarbon site (gray), lipid headgroup site (orange), or water molecule (blue), in system ED1 (A), ED4 (B), ED32 (C), and MD1 (D). See Fig. S3 for all ED systems. To see this figure in color, go online.
Figure 6.
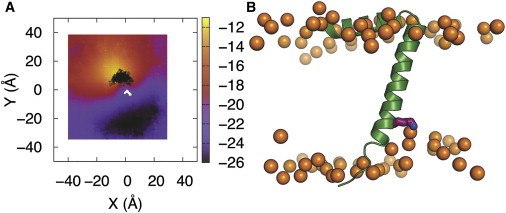
(A) Average z coordinates of lipid phosphorus atoms in the lower bilayer leaflet of system ED32. The bilayer center was aligned to z = 0 and then protein from each snapshot was aligned via translation on the xy plane. The z coordinate values of phosphorus atoms in the lower leaflet are presented in gradient color (purple, red, and yellow). The black area shows where the K40 charged side chain is positioned during the simulations. (B) One snapshot from ED32 showing the interactions between lipids and K40 (phosphorus atoms in orange, K40 in purple stick, and protein in green cartoon). To see this figure in color, go online.
While the protein-lipid interactions change the geometry of the membrane, such interactions also contribute to stabilization of the protein structure. For example, the periplasmic helix has hydrophobic residues (A7, A9, A10, F11, L14, and A16) on one side, and polar or charged residues (K8, D12, S13, Q15, and S17) on the other side. The frequent hydrophobic interactions of the former with the lipid carbon tails, as well as the hydrophilic interactions of the latter with the lipid headgroups and/or water, help determine the orientation of the periplasmic helix on the membrane surface, as consistently observed in the MD1 system without any restraints (Figs. 5 and S3). Residues Y21 and Y24 also frequently interact with the membrane, helping to stabilize the transmembrane helix orientation (Figs. 5 and S3). Because our ED simulations explicitly include solvent molecules, such atomic-level interactions are also essential determinants of the protein structure (and orientation) in addition to the solid-state NMR restraints.
The relative orientations of the periplasmic and transmembrane helices determine the overall structure of the protein and therefore are functionally important. As shown in Fig. 7 A, the fd coat protein maintains a well-defined L-shape with a helix-helix hinge angle of ∼70° in all systems. Under strong solid-state NMR restraints, ED1 shows a narrow distribution with variations of ∼10°, whereas the other ED systems, which have multiple replicas, show broad distributions with variations of ∼18°, similar to that of MD1. Fig. 7 B shows the distributions of the crossing angle between the projections of principal helical axes of the periplasmic and transmembrane helices on the membrane surface. In a similar way, all ED systems (except ED1) show broad distributions of crossing angles with variations of ∼23°, as in MD1, highlighting the conformational dynamics of fd coat protein.
Figure 7.
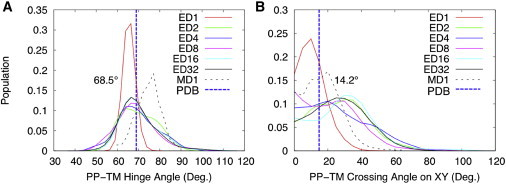
Distributions of the (hinge) angles between the principal axes of the periplasmic and transmembrane helices (A) and the (crossing) angles between their principal axes projected on the xy plane (B). To see this figure in color, go online.
Conclusions
The experimental solid-state NMR data are well satisfied in all NMR-restrained ED simulations and are better represented by structure ensembles obtained with more replicas. By increasing the number of replicas, the strong bias imposed by a set of experimental restraint potentials diminishes, and inherent protein dynamics governed by the physical protein-lipid interactions becomes apparent. Therefore, ED simulations can simultaneously capture protein dynamics and an ensemble of conformations that satisfies the experimental observables.
For membrane-integrated fd coat protein, the average helical orientations are consistent in all simulation systems in explicit membranes and agree with the PDB structure calculated directly from the solid-state NMR data. Compared to systems with a single-conformer (ED1) or two replicas (ED2), which are under stronger influence of the NMR restraints, the multiple-replica ED systems (ED4, ED8, ED16, and ED32) show similar distribution patterns in helix orientations and compare well with those obtained from the standard, unrestrained MD simulation (MD1). This demonstrates that with a proper ensemble size (more than two replicas in each ensemble), the NMR-restrained ED method can be very effective for generating stable dynamics trajectories of membrane proteins in explicit membranes. Specifically, for fd coat protein, significant flexibility is observed at the C-terminal end of the transmembrane helix, which is likely to have functional importance.
The efficacy of solid-state NMR-restrained ED has been previously demonstrated with the refinement of transmembrane helix structure in implicit membrane environments (6,7,41). Most implicit membrane models define a low-dielectric slab that effectively mimics the hydrophobic core of the membrane bilayer (8,9). This static, low-dielectric slab can capture the general effect of biological membrane, such as hydrophobic mismatch (between the length of a protein’s hydrophobic transmembrane domain and the thickness of the bilayer hydrophobic core) (42–45), yet the computational cost of such a system is substantially lower than that of an explicit membrane system. Thus, it has been widely used in many computational studies of membrane systems, including our earlier work on structure determination of single-pass transmembrane helices with solid-state NMR-restrained ED simulations (6,7,41). Nonetheless, despite many advantages in implicit membrane models, the undeformable nature of the hydrophobic slab is one of its most significant drawbacks. The biological membrane bilayer is fluid and membrane protein function is in part regulated by changes in lipid bilayer thickness and intrinsic lipid curvature (46). In particular, in the case of a hydrophobic mismatch, the bilayer adaptation involves local changes in lipid bilayer thickness (also known as local membrane thickening or thinning), and possibly changes in the protein’s transmembrane domain orientation (11,47–52). Most implicit membrane models are not able to provide such bilayer adaptation determined by detailed protein-lipid interactions. To address these drawbacks, several deformable implicit membrane models have been recently proposed (53–55), but their accuracy and general applicability have yet to be validated.
This work shows that using an explicit membrane environment in solid-state NMR-restrained ED simulations has the important advantages of providing detailed atomic-level information about protein-lipid interactions, as observed for residues K40, K43, and K44, which are involved in DNA binding in the bacteriophage and are anchored to the membrane surface in the membrane-bound form of the protein. Notably, K40 is observed to induce membrane curvature in the lower bilayer leaflet.
We conclude that solid-state NMR-restrained ED simulations of membrane-bound fd coat protein performed in explicit lipid bilayer membranes are very effective for determining protein structure within the membrane and extracting protein dynamics. This approach could be very useful for improving the accuracy and quality of membrane protein structures determined by solid-state NMR as it is increasingly applied to membrane proteins in nanodiscs.
Author Contributions
W.I. and X.C. designed the research; X.C. and Y.Q. performed the research; X.C., Y.Q., and S.J. contributed analytic tools; X.C., Y.Q., S.J., F.M.M., and W.I. analyzed the data; and X.C., Y.Q., S.J., F.M.M., and W.I. wrote the article.
Acknowledgments
Anton computer time was provided by the National Center for Multiscale Modeling of Biological Systems (MMBioS) through Grant P41GM103712-S1 from the National Institutes of Health and the Pittsburgh Supercomputing Center (PSC). The Anton machine at PSC was generously made available by D.E. Shaw Research.
This research was supported by grants from the National Science Foundation (MCB-1157677 to W.I.), XSEDE Resources (MCB070009 to W.I.), and the National Institutes of Health (R01 GM110658, R01 GM100265, and P41 EB002031 to F.M.M.).
Supporting Material
References
- 1.Cross T.A., Ekanayake V., Wright A. Solid state NMR: the essential technology for helical membrane protein structural characterization. J. Magn. Reson. 2014;239:100–109. doi: 10.1016/j.jmr.2013.12.006. [DOI] [PMC free article] [PubMed] [Google Scholar]
- 2.Wang S., Ladizhansky V. Recent advances in magic angle spinning solid state NMR of membrane proteins. Prog. Nucl. Magn. Reson. Spectrosc. 2014;82:1–26. doi: 10.1016/j.pnmrs.2014.07.001. [DOI] [PubMed] [Google Scholar]
- 3.Bonvin A.M., Brünger A.T. Conformational variability of solution nuclear magnetic resonance structures. J. Mol. Biol. 1995;250:80–93. doi: 10.1006/jmbi.1995.0360. [DOI] [PubMed] [Google Scholar]
- 4.Lange O.F., Lakomek N.A., de Groot B.L. Recognition dynamics up to microseconds revealed from an RDC-derived ubiquitin ensemble in solution. Science. 2008;320:1471–1475. doi: 10.1126/science.1157092. [DOI] [PubMed] [Google Scholar]
- 5.Richter B., Gsponer J., Vendruscolo M. The MUMO (minimal under-restraining minimal over-restraining) method for the determination of native state ensembles of proteins. J. Biomol. NMR. 2007;37:117–135. doi: 10.1007/s10858-006-9117-7. [DOI] [PubMed] [Google Scholar]
- 6.Jo S., Im W. Transmembrane helix orientation and dynamics: insights from ensemble dynamics with solid-state NMR observables. Biophys. J. 2011;100:2913–2921. doi: 10.1016/j.bpj.2011.05.009. [DOI] [PMC free article] [PubMed] [Google Scholar]
- 7.Im W., Jo S., Kim T. An ensemble dynamics approach to decipher solid-state NMR observables of membrane proteins. Biochim. Biophys. Acta. 2012;1818:252–262. doi: 10.1016/j.bbamem.2011.07.048. [DOI] [PubMed] [Google Scholar]
- 8.Im W., Feig M., Brooks C.L., 3rd An implicit membrane generalized born theory for the study of structure, stability, and interactions of membrane proteins. Biophys. J. 2003;85:2900–2918. doi: 10.1016/S0006-3495(03)74712-2. [DOI] [PMC free article] [PubMed] [Google Scholar]
- 9.Lazaridis T. Effective energy function for proteins in lipid membranes. Proteins. 2003;52:176–192. doi: 10.1002/prot.10410. [DOI] [PubMed] [Google Scholar]
- 10.Cheng X., Jo S., Im W. NMR-based simulation studies of Pf1 coat protein in explicit membranes. Biophys. J. 2013;105:691–698. doi: 10.1016/j.bpj.2013.06.040. [DOI] [PMC free article] [PubMed] [Google Scholar]
- 11.Kim T., Lee K.I., Im W. Influence of hydrophobic mismatch on structures and dynamics of gramicidin a and lipid bilayers. Biophys. J. 2012;102:1551–1560. doi: 10.1016/j.bpj.2012.03.014. [DOI] [PMC free article] [PubMed] [Google Scholar]
- 12.Marassi F.M., Opella S.J. Simultaneous assignment and structure determination of a membrane protein from NMR orientational restraints. Protein Sci. 2003;12:403–411. doi: 10.1110/ps.0211503. [DOI] [PMC free article] [PubMed] [Google Scholar]
- 13.Zeri A.C., Mesleh M.F., Opella S.J. Structure of the coat protein in fd filamentous bacteriophage particles determined by solid-state NMR spectroscopy. Proc. Natl. Acad. Sci. USA. 2003;100:6458–6463. doi: 10.1073/pnas.1132059100. [DOI] [PMC free article] [PubMed] [Google Scholar]
- 14.Brooks B.R., Brooks C.L., 3rd, Karplus M. CHARMM: the biomolecular simulation program. J. Comput. Chem. 2009;30:1545–1614. doi: 10.1002/jcc.21287. [DOI] [PMC free article] [PubMed] [Google Scholar]
- 15.Lee J., Chen J., Im W. Application of solid-state NMR restraint potentials in membrane protein modeling. J. Magn. Reson. 2008;193:68–76. doi: 10.1016/j.jmr.2008.04.023. [DOI] [PMC free article] [PubMed] [Google Scholar]
- 16.Shi L., Traaseth N.J., Veglia G. A refinement protocol to determine structure, topology, and depth of insertion of membrane proteins using hybrid solution and solid-state NMR restraints. J. Biomol. NMR. 2009;44:195–205. doi: 10.1007/s10858-009-9328-9. [DOI] [PMC free article] [PubMed] [Google Scholar]
- 17.Tian Y., Schwieters C.D., Marassi F.M. AssignFit: a program for simultaneous assignment and structure refinement from solid-state NMR spectra. J. Magn. Reson. 2012;214:42–50. doi: 10.1016/j.jmr.2011.10.002. [DOI] [PMC free article] [PubMed] [Google Scholar]
- 18.Jo S., Kim T., Im W. Automated builder and database of protein/membrane complexes for molecular dynamics simulations. PLoS ONE. 2007;2:e880. doi: 10.1371/journal.pone.0000880. [DOI] [PMC free article] [PubMed] [Google Scholar]
- 19.Jo S., Lim J.B., Im W. CHARMM-GUI Membrane Builder for mixed bilayers and its application to yeast membranes. Biophys. J. 2009;97:50–58. doi: 10.1016/j.bpj.2009.04.013. [DOI] [PMC free article] [PubMed] [Google Scholar]
- 20.Jo S., Kim T., Im W. CHARMM-GUI: a web-based graphical user interface for CHARMM. J. Comput. Chem. 2008;29:1859–1865. doi: 10.1002/jcc.20945. [DOI] [PubMed] [Google Scholar]
- 21.Feller S.E., Zhang Y.H., Pastor R.W. Computer simulation of liquid/liquid interfaces. 2. Surface tension-area dependence of a bilayer and monolayer. J. Chem. Phys. 1995;103:10267–10276. [Google Scholar]
- 22.MacKerell A.D., Bashford D., Karplus M. All-atom empirical potential for molecular modeling and dynamics studies of proteins. J. Phys. Chem. B. 1998;102:3586–3616. doi: 10.1021/jp973084f. [DOI] [PubMed] [Google Scholar]
- 23.Mackerell A.D., Jr., Feig M., Brooks C.L., 3rd Extending the treatment of backbone energetics in protein force fields: limitations of gas-phase quantum mechanics in reproducing protein conformational distributions in molecular dynamics simulations. J. Comput. Chem. 2004;25:1400–1415. doi: 10.1002/jcc.20065. [DOI] [PubMed] [Google Scholar]
- 24.Klauda J.B., Venable R.M., Pastor R.W. Update of the CHARMM all-atom additive force field for lipids: validation on six lipid types. J. Phys. Chem. B. 2010;114:7830–7843. doi: 10.1021/jp101759q. [DOI] [PMC free article] [PubMed] [Google Scholar]
- 25.Jorgensen W.L., Chandrasekhar J., Klein M.L. Comparison of simple potential functions for simulating liquid water. J. Chem. Phys. 1983;79:926–935. [Google Scholar]
- 26.Dolan E.A., Venable R.M., Brooks B.R. Simulations of membranes and other interfacial systems using P2(1) and Pc periodic boundary conditions. Biophys. J. 2002;82:2317–2325. doi: 10.1016/S0006-3495(02)75577-X. [DOI] [PMC free article] [PubMed] [Google Scholar]
- 27.Ryckaert J.P., Ciccotti G., Berendsen H.J.C. Numerical integration of Cartesian equations of motion of a system with constraints - molecular-dynamics of N-alkanes. J. Comput. Phys. 1977;23:327–341. [Google Scholar]
- 28.Steinbach P.J., Brooks B.R. New spherical-cutoff methods for long-range forces in macromolecular simulation. J. Comput. Chem. 1994;15:667–683. [Google Scholar]
- 29.Essmann U., Perera L., Pedersen L.G. A smooth particle mesh Ewald method. J. Chem. Phys. 1995;103:8577–8593. [Google Scholar]
- 30.Shaw D.E., Deneroff M.M., Wang S.C. Anton, a special-purpose machine for molecular dynamics simulation. Commun. ACM. 2008;51:91–97. [Google Scholar]
- 31.Martyna G.J., Tobias D.J., Klein M.L. Constant-pressure molecular-dynamics algorithms. J. Chem. Phys. 1994;101:4177–4189. [Google Scholar]
- 32.Martyna G.J., Tuckerman M.E., Klein M.L. Explicit reversible integrators for extended systems dynamics. Mol. Phys. 1996;87:1117–1157. [Google Scholar]
- 33.Shan Y., Klepeis J.L., Shaw D.E. Gaussian split Ewald: A fast Ewald mesh method for molecular simulation. J. Chem. Phys. 2005;122:54101. doi: 10.1063/1.1839571. [DOI] [PubMed] [Google Scholar]
- 34.Pitera J.W., Chodera J.D. On the use of experimental observations to bias simulated ensembles. J. Chem. Theory Comput. 2012;8:3445–3451. doi: 10.1021/ct300112v. [DOI] [PubMed] [Google Scholar]
- 35.Islam S.M., Stein R.A., Roux B. Structural refinement from restrained-ensemble simulations based on EPR/DEER data: application to T4 lysozyme. J. Phys. Chem. B. 2013;117:4740–4754. doi: 10.1021/jp311723a. [DOI] [PMC free article] [PubMed] [Google Scholar]
- 36.Chen J., Won H.S., Brooks C.L., 3rd Generation of native-like protein structures from limited NMR data, modern force fields and advanced conformational sampling. J. Biomol. NMR. 2005;31:59–64. doi: 10.1007/s10858-004-6056-z. [DOI] [PubMed] [Google Scholar]
- 37.Xia B., Tsui V., Wright P.E. Comparison of protein solution structures refined by molecular dynamics simulation in vacuum, with a generalized Born model, and with explicit water. J. Biomol. NMR. 2002;22:317–331. doi: 10.1023/a:1014929925008. [DOI] [PubMed] [Google Scholar]
- 38.Cheng X., Im W. NMR observable-based structure refinement of DAP12-NKG2C activating immunoreceptor complex in explicit membranes. Biophys. J. 2012;102:L27–L29. doi: 10.1016/j.bpj.2012.03.002. [DOI] [PMC free article] [PubMed] [Google Scholar]
- 39.Chen J., Im W., Brooks C.L., 3rd Refinement of NMR structures using implicit solvent and advanced sampling techniques. J. Am. Chem. Soc. 2004;126:16038–16047. doi: 10.1021/ja047624f. [DOI] [PubMed] [Google Scholar]
- 40.Almeida F.C., Opella S.J. fd coat protein structure in membrane environments: structural dynamics of the loop between the hydrophobic trans-membrane helix and the amphipathic in-plane helix. J. Mol. Biol. 1997;270:481–495. doi: 10.1006/jmbi.1997.1114. [DOI] [PubMed] [Google Scholar]
- 41.Kim T., Jo S., Im W. Solid-state NMR ensemble dynamics as a mediator between experiment and simulation. Biophys. J. 2011;100:2922–2928. doi: 10.1016/j.bpj.2011.02.063. [DOI] [PMC free article] [PubMed] [Google Scholar]
- 42.Im W., Brooks C.L., 3rd Interfacial folding and membrane insertion of designed peptides studied by molecular dynamics simulations. Proc. Natl. Acad. Sci. USA. 2005;102:6771–6776. doi: 10.1073/pnas.0408135102. [DOI] [PMC free article] [PubMed] [Google Scholar]
- 43.Killian J.A., Nyholm T.K. Peptides in lipid bilayers: the power of simple models. Curr. Opin. Struct. Biol. 2006;16:473–479. doi: 10.1016/j.sbi.2006.06.007. [DOI] [PubMed] [Google Scholar]
- 44.Strandberg E., Esteban-Martín S., Salgado J. Hydrophobic mismatch of mobile transmembrane helices: merging theory and experiments. Biochim. Biophys. Acta. 2012;1818:1242–1249. doi: 10.1016/j.bbamem.2012.01.023. [DOI] [PubMed] [Google Scholar]
- 45.Ulmschneider M.B., Sansom M.S., Di Nola A. Properties of integral membrane protein structures: derivation of an implicit membrane potential. Proteins. 2005;59:252–265. doi: 10.1002/prot.20334. [DOI] [PubMed] [Google Scholar]
- 46.Andersen O.S., Koeppe R.E., 2nd Bilayer thickness and membrane protein function: an energetic perspective. Annu. Rev. Biophys. Biomol. Struct. 2007;36:107–130. doi: 10.1146/annurev.biophys.36.040306.132643. [DOI] [PubMed] [Google Scholar]
- 47.Dorairaj S., Allen T.W. On the thermodynamic stability of a charged arginine side chain in a transmembrane helix. Proc. Natl. Acad. Sci. USA. 2007;104:4943–4948. doi: 10.1073/pnas.0610470104. [DOI] [PMC free article] [PubMed] [Google Scholar]
- 48.Kim T., Im W. Revisiting hydrophobic mismatch with free energy simulation studies of transmembrane helix tilt and rotation. Biophys. J. 2010;99:175–183. doi: 10.1016/j.bpj.2010.04.015. [DOI] [PMC free article] [PubMed] [Google Scholar]
- 49.Mori T., Ogushi F., Sugita Y. Analysis of lipid surface area in protein-membrane systems combining Voronoi tessellation and Monte Carlo integration methods. J. Comput. Chem. 2012;33:286–293. doi: 10.1002/jcc.21973. [DOI] [PubMed] [Google Scholar]
- 50.Rui H., Kumar R., Im W. Membrane tension, lipid adaptation, conformational changes, and energetics in MscL gating. Biophys. J. 2011;101:671–679. doi: 10.1016/j.bpj.2011.06.029. [DOI] [PMC free article] [PubMed] [Google Scholar]
- 51.Rui H., Lee J., Im W. Comparative molecular dynamics simulation studies of protegrin-1 monomer and dimer in two different lipid bilayers. Biophys. J. 2009;97:787–795. doi: 10.1016/j.bpj.2009.05.029. [DOI] [PMC free article] [PubMed] [Google Scholar]
- 52.Rui H., Root K.T., Im W. Probing the U-shaped conformation of caveolin-1 in a bilayer. Biophys. J. 2014;106:1371–1380. doi: 10.1016/j.bpj.2014.02.005. [DOI] [PMC free article] [PubMed] [Google Scholar]
- 53.Choe S., Hecht K.A., Grabe M. A continuum method for determining membrane protein insertion energies and the problem of charged residues. J. Gen. Physiol. 2008;131:563–573. doi: 10.1085/jgp.200809959. [DOI] [PMC free article] [PubMed] [Google Scholar]
- 54.Panahi A., Feig M. Dynamic heterogeneous dielectric generalized Born (DHDGB): an implicit membrane model with a dynamically varying bilayer thickness. J. Chem. Theory Comput. 2013;9:1709–1719. doi: 10.1021/ct300975k. [DOI] [PMC free article] [PubMed] [Google Scholar]
- 55.Zhou Y.C., Lu B., Gorfe A.A. Continuum electromechanical modeling of protein-membrane interactions. Phys. Rev. E Stat. Nonlin. Soft Matter Phys. 2010;82:041923. doi: 10.1103/PhysRevE.82.041923. [DOI] [PubMed] [Google Scholar]
Associated Data
This section collects any data citations, data availability statements, or supplementary materials included in this article.