

Abstract
Rationale: Chronic obstructive pulmonary disease (COPD) is a heterogeneous disease and likely includes a subgroup that is biologically comparable to asthma. Studying asthma-associated gene expression changes in COPD could add insight into COPD pathogenesis and reveal biomarkers that predict a favorable response to corticosteroids.
Objectives: To determine whether asthma-associated gene signatures are increased in COPD and associated with asthma-related features.
Methods: We compared disease-associated airway epithelial gene expression alterations in an asthma cohort (n = 105) and two COPD cohorts (n = 237, 171). The T helper type 2 (Th2) signature (T2S) score, a gene expression metric induced in Th2-high asthma, was evaluated in these COPD cohorts. The T2S score was correlated with asthma-related features and response to corticosteroids in COPD in a randomized, placebo-controlled trial, the Groningen and Leiden Universities study of Corticosteroids in Obstructive Lung Disease (GLUCOLD; n = 89).
Measurements and Main Results: The 200 genes most differentially expressed in asthma versus healthy control subjects were enriched among genes associated with more severe airflow obstruction in these COPD cohorts (P < 0.001), suggesting significant gene expression overlap. A higher T2S score was associated with decreased lung function (P < 0.001), but not asthma history, in both COPD cohorts. Higher T2S scores correlated with increased airway wall eosinophil counts (P = 0.003), blood eosinophil percentage (P = 0.03), bronchodilator reversibility (P = 0.01), and improvement in hyperinflation after corticosteroid treatment (P = 0.019) in GLUCOLD.
Conclusions: These data identify airway gene expression alterations that can co-occur in asthma and COPD. The association of the T2S score with increased severity and “asthma-like” features (including a favorable corticosteroid response) in COPD suggests that Th2 inflammation is important in a COPD subset that cannot be identified by clinical history of asthma.
Keywords: chronic obstructive pulmonary disease, gene expression profiling, biological markers
At a Glance Commentary
Scientific Knowledge on the Subject
Some patients with chronic obstructive pulmonary disease (COPD) appear more similar to those with asthma clinically, suggesting that asthma-associated inflammatory pathways may play a more significant role in a specific COPD subgroup. Although few pharmacological therapies have been found to be effective in COPD, inhaled corticosteroids (ICSs) and other asthma therapeutics may be more effective in this “asthma-like” COPD subgroup.
What This Study Adds to the Field
In this study, we find that there is significant overlap of disease-associated airway epithelial gene expression alterations in asthma and a COPD subset. Furthermore, asthma-derived gene expression signatures of Th2 inflammation are associated with increased disease severity, eosinophil counts, and ICS response in COPD. Our data suggest that there is a clinically relevant COPD subgroup characterized by asthma-like gene expression alterations. They also suggest that Th2-related gene expression signatures may serve as biomarkers to predict which patients with COPD will benefit from ICS or other Th2-targeted therapies.
Chronic obstructive pulmonary disease (COPD) affects an estimated 10% of the world’s population, and is the fourth leading cause of death worldwide (1, 2). Both COPD and asthma are characterized by chronic airway inflammation and airflow obstruction (3). However, there has been greater progress in understanding asthma pathophysiology. This has led to effective treatment strategies for asthma, such as the cornerstone of asthma treatment: inhaled corticosteroids (ICS). By contrast, there is currently no pharmacological treatment that effectively slows the progression of COPD. Despite their broad antiinflammatory effects, ICS do not achieve marked long-term effects in the majority of patients with COPD (4). However, COPD is highly heterogeneous, and a subset may display asthma-like biology and a favorable ICS response (5–8). To date, no biomarkers reliably predict ICS responsiveness in COPD.
Although COPD is traditionally differentiated from asthma by poorly reversible airflow obstruction, a subset of patients with COPD displays bronchial hyperresponsiveness and at least partial reversibility of airflow obstruction with bronchodilators (6). Similarly, although inflammation in COPD is typically thought to be driven by T helper type 1 (Th1) immune responses (7), asthma-associated inflammatory pathways (e.g., eosinophilia and Th2 inflammation) appear to underlie disease in some patients. For example, IL-13 (a Th2 cytokine) is expressed in higher percentages in T cells in bronchoalveolar lavage fluid in subjects with COPD than in subjects without the disease (8). We hypothesize that the COPD subgroup in which these asthma-associated inflammatory pathways play a more significant role may also benefit most from ICS. Similarities between gene expression profiles in asthma and COPD have not been studied, but could add to our understanding of the biology underlying the clinical and pathologic overlap between asthma and COPD.
We previously applied a genomic approach to distinguish two molecular subphenotypes (endotypes) of asthma defined by their degree of Th2 inflammation. Airway epithelial expression levels of three IL-13–inducible genes, periostin (POSTN), chloride channel Ca2+-activated 1 (CLCA1), and serine peptidase inhibitor B2 (SERPINB2), were identified as airway Th2 inflammatory markers (9–11). Expression of these genes was higher in asthma versus healthy control subjects overall. The asthma subgroup with the highest expression levels, the “Th2-high” endotype, had higher IL-5 and IL-13 expression levels in bronchial biopsies, increased serum total IgE levels, greater blood and lung eosinophilia, increased airway hyperresponsiveness, and a better lung function (FEV1) response to ICS (10, 11). Furthermore, the blood biomarker periostin derived from this signature predicted the response of subjects with asthma to omalizumab and to an anti–IL-13 monoclonal antibody, lebrikizumab (12, 13). Whether Th2-high gene expression signatures are also present in COPD and are associated with a specific Th2-high endotype is unknown. Investigation of these signatures in COPD could lead to a better understanding of which patients will benefit from ICS therapy.
We hypothesized that there are partially overlapping airway gene expression changes in asthma and COPD, which reflect shared processes that contribute to airflow obstruction. Furthermore, we hypothesized that signatures of airway epithelial gene expression alterations in asthma are up-regulated in COPD, and can identify a COPD subgroup with a clinical phenotype more similar to asthma (e.g., increased airway eosinophil counts and ICS responsiveness). We compared airway cell gene expression in asthma to that of two established COPD cohorts using gene set enrichment analysis (GSEA) (14). We then studied the association of Th2 gene signatures with lung function in these cohorts. Finally, we determined whether a Th2 signature (T2S) score is associated with asthma-associated pathological features (e.g., lung tissue eosinophilia) and ICS responsiveness in a previously published randomized controlled trial of patients with COPD with no history of asthma (15).
Some of the results of these studies have been previously reported in the form of an abstract (16).
Methods
Subjects and Sample Preparation
Asthma dataset—asthma and control subjects
Gene expression microarray and quantitative PCR data from large airway epithelial brushings were previously obtained from steroid-naive subjects with mild to moderate asthma (n = 62) and control subjects without asthma (n = 43) in a cross-sectional study design (Table 1, Figure 1; see also Table E1 in the online supplement) (9, 10). Bronchial biopsies were obtained in a subset (n = 61). Subjects with asthma were divided into Th2-high and -low subgroups (n = 40 and 22, respectively) using a validated standardized mean expression level of POSTN, SERPINB2, and CLCA1 (“three gene mean” [TGM]) (11).
Table 1.
Asthma and Chronic Obstructive Pulmonary Disease Datasets
| Dataset | Sample Description | Subjects/Samples |
|---|---|---|
| Asthma–epithelial | Airway epithelial samples, third- to fourth-generation bronchi | Healthy = 43 |
| Asthma = 62 | ||
| Th2 low = 22 | ||
| Th2 high = 40 | ||
| Asthma–endobronchial | Asthma dataset subset endobronchial samples, third- to fourth-generation bronchi | Healthy = 24 |
| Asthma = 37 | ||
| Th2 low = 13 | ||
| Th2 high = 24 | ||
| BAEC | Airway epithelial samples, sixth- to eighth-generation bronchi | Healthy current/former smokers = 151 |
| Current/former smokers with COPD = 87 | ||
| SAEC | Airway epithelial samples, 10th- to 12th-generation bronchi | Healthy nonsmokers = 63 |
| Healthy current smokers = 72 | ||
| Current smokers with COPD = 36 | ||
| GLUCOLD | Endobronchial biopsy samples, third- to fourth-generation bronchi | Baseline = 79 total subjects, randomized to: |
| Placebo = 21 | ||
| Fluticasone × 30 mo = 19 | ||
| Fluticasone + salmeterol × 30 mo = 26 | ||
| Fluticasone × 6 mo then placebo × 24 mo = 21 |
Definition of abbreviations: BAEC = bronchial airway epithelium COPD; COPD = chronic obstructive pulmonary disease; GLUCOLD = Groningen and Leiden Universities study of Corticosteroids in Obstructive Lung Disease; SAEC = small airway epithelium COPD; Th2 = T helper type 2.
Figure 1.
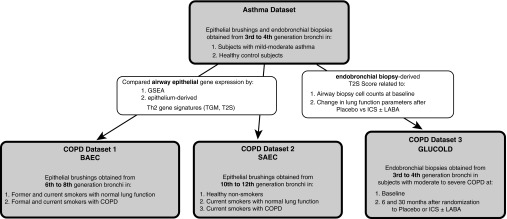
Study design. Gene expression overlap in asthma and chronic obstructive pulmonary disease (COPD) was identified by comparing microarray profiles from an asthma cohort with profiles from three COPD cohorts: (1) the bronchial airway epithelium COPD (BAEC) cohort; (2) the small airway epithelium COPD (SAEC) cohort; and (3) the Groningen and Leiden Universities study of Corticosteroids in Obstructive Lung Disease (GLUCOLD) cohort. GSEA = gene set enrichment analysis; ICS = inhaled corticosteroid; LABA = long-acting β agonist; T2S = Th2 signature; TGM = three gene mean.
COPD datasets
Three previously described COPD datasets were used for comparison (Figure 1):
-
1.
The bronchial airway epithelium COPD (BAEC) dataset (17): RNA was isolated from bronchial epithelial brushings obtained from sixth- to eighth-generation bronchi in former and current smokers with a range of lung function (n = 87 with COPD and 151 without; Table 1, Table E2). Clinical history of asthma was not an exclusion criterion.
-
2.
The small airway epithelium COPD (SAEC) dataset (18): RNA was isolated from brushings obtained from 10th–12th generation bronchi in nonsmokers (n = 63), current smokers without airway obstruction (n = 36), and smokers with mild to moderate COPD during research bronchoscopy (n = 72; Table 1, Table E3).
-
3.
The endobronchial biopsy Groningen and Leiden Universities study of Corticosteroids in Obstructive Lung Disease dataset (GLUCOLD) (5, 15): 89 steroid-naive subjects with moderate to severe COPD without an asthma history were enrolled (Table E4). A subset was included in a double-blinded, randomized, controlled trial in which they received: (a) placebo for 30 months (n = 23); (b) ICS (fluticasone) with or without long-acting β agonist (LABA; salmeterol) for 30 months (n = 45); or (c) ICS for 6 months then placebo for 24 months (n = 21). Lung function was measured every 3 months. RNA was isolated from endobronchial biopsies obtained at baseline and at 6 and 30 months.
Gene expression in each COPD dataset was previously and independently profiled by microarray (GSE37147, GSE11784, and GSE36221, respectively). Consent was obtained by participants in all studies separately. Additional detail on each dataset is provided in supplemental Methods in the online supplement.
Statistical Analysis
Each dataset underwent preprocessing and normalization separately (affy package, Bioconductor, R statistical software version 3.0.2) (19–21). Statistical analyses were done using the limma package in the R statistical environment (22).
Differential gene expression
Ranked differential gene expression lists for use in subsequent analyses were determined for the datasets using the following contrasts (details are in the supplemental Methods in the online supplement):
-
1.
Asthma dataset: (a) subjects with asthma versus control subjects; and (b) Th2-high subjects with asthma versus Th2-low subjects with asthma/control subjects.
-
2.
BAEC dataset: gene expression alterations associated with FEV1 % predicted (FEV1%pred), a measure that decreases with increasing airflow obstruction after adjustment for smoking status, cumulative smoke exposure, age, and sex.
-
3.
SAEC dataset: (a) smokers with COPD versus healthy smokers; and (b) healthy smokers versus healthy nonsmokers (FEV1%pred measurements were not available).
-
4.
GLUCOLD dataset: gene expression alterations associated with 6 and 30 months of ICS treatment compared with placebo after adjustment for smoking status.
Adjustment for multiple comparisons was done by applying the Benjamini-Hochberg false discovery rate (23).
GSEA
GSEA was used to compare the asthma dataset with the COPD datasets on the gene set level. Briefly, this method determines whether a group of genes (“gene set”) is significantly overrepresented (“enriched”) at extremes of a ranked list, in which case the gene set is considered correlated with the phenotype (see additional details in the supplemental methods) (14). We compared genes significantly altered in asthma (“asthma gene sets”) to genes ranked in association with COPD in the BAEC and SAEC datasets. Genes significantly associated with COPD in the BAEC and SAEC datasets (“COPD gene sets”) were compared with genes ranked by association with asthma. The “leading edge,” those genes that accounted for most of the similarity between asthma and COPD, were considered the genes of interest in both asthma and COPD (i.e., “asthma–COPD overlap genes”). These asthma–COPD overlap genes were used to create a gene set that was compared with genes ranked in association with ICS treatment versus placebo at 6 and 30 months in the GLUCOLD dataset. Qiagen’s Ingenuity Pathway Analysis (Qiagen, Redwood City, CA [www.qiagen.com/ingenuity]) was used to identify biologic processes in which these asthma–COPD overlap genes may be involved.
Th2 gene signature scores
The TGM metric, the scaled mean value of POSTN, SERPINB2, and CLCA1 calculated for each subject, was used as our initial Th2 inflammation signature (11). However, as it is unclear whether this metric optimally summarizes Th2 inflammation in COPD given differences between the asthma and COPD datasets (e.g., subjects with COPD are older with a smoking history), we next developed the T2S score to include a broader range of genes. The 100 genes most up-regulated in the airway epithelium in Th2-high asthma as compared with Th2-low asthma/healthy control subjects were summarized into a single metagene metric using a principle component analysis projection algorithm (see the supplemental Methods and Table E5 for genes included in the epithelial T2S) (24).
Spearman correlation, t tests, Wilcoxon rank-sum tests, multiple regression models, and one-way analysis of variance were used, as appropriate, to determine differential expression of these metrics, and associations between the Th2 metrics and (1) lung function, (2) clinical characteristics, and (3) gene expression of Th2-associated genes in each cross-sectional dataset (see the supplemental Methods).
GLUCOLD T2S score analyses
Two separate analyses were done to relate the T2S score to pathologic and physiologic parameters. A new 100-gene T2S metric was derived from the asthma dataset endobronchial tissue gene expression data, to better correspond with the endobronchial tissue data available in GLUCOLD (genes listed in Table S6; see supplemental Methods for details).
Two linear models adjusted for smoking status were used:
-
1.
The “baseline analysis” evaluated the association of the T2S metric with pretreatment eosinophil levels (primary outcome for baseline analysis) and neutrophil levels in bronchial tissue, percent serum eosinophils, serum IgE levels (IU/L), and bronchodilator responsiveness (% FEV1 change) (all subjects).
-
2.
The “longitudinal treatment analysis” evaluated association of the baseline T2S metric with change in FEV1%pred (primary outcome), as well as residual volume (RV)/total lung capacity (TLC) % predicted and inspiratory capacity (IC; in liters) as markers of hyperinflation, after 6 and 30 months of treatment for the ICS with and without LABA versus placebo arms (see the supplemental Methods).
The ICS and ICS plus LABA groups were combined to improve power, as the long-term clinical and antiinflammatory effects in these groups were comparable. However, a sensitivity analysis was done excluding the subjects who received LABA to ensure that any associations were seen with ICS alone.
Clustering analysis
Clustering of the three and 100 genes from which the TGM metric and T2S score were derived, respectively, was done to identify Th2-high subgroups in each COPD dataset using Euclidean distance, with average linkage as a distance metric.
Results
GSEA Identifies Gene Expression Similarities between Asthma and COPD
We first examined whether there are similarities in disease-associated airway epithelial gene expression alterations in asthma and COPD. We could not combine gene expression data across datasets, due to differences in microarray platforms and subject characteristics. Thus, we used GSEA, which compares gene rankings and does not require combined datasets.
GSEA revealed significant concordance of gene expression in asthma and COPD. The 100 genes most up-regulated in the airway epithelium in subjects with asthma as compared with control subjects without asthma were enriched among genes associated with decreased FEV1%pred in the BAEC dataset, and genes increased in smokers with COPD compared with smokers without airflow obstruction in the SAEC dataset (both P < 0.001; Figures 2A and 2B). Similarly, the 100 genes most down-regulated in asthma were enriched among genes associated with increased FEV1%pred in the BAEC dataset and genes decreased in COPD in the SAEC dataset (both P < 0.001; Figures 2A and 2B); 77% of the 95 genes in the BAEC cohort leading edge set were also present in the SAEC cohort leading edge set. This suggests that the epithelial gene expression changes that best account for asthma–COPD overlap occur in both the large and small airway epithelium (see supplemental Results for details on strength of concordance between asthma and COPD, and Tables E7 and E8 for lists of overlapping leading edge sets).
Figure 2.

Genes most altered in the airway epithelium in asthma evaluated in chronic obstructive pulmonary disease (COPD) using gene set enrichment analysis (GSEA). Line plots of the 100 genes most up-regulated in asthma compared with control (fold change > 1.25; false discovery rate q-value < 0.01) show enrichment among (A) genes associated with low FEV1 % predicted (FEV1%pred) in the bronchial airway epithelium COPD (BAEC) cohort (P < 0.001), and (B) genes up-regulated in subjects with COPD compared with smokers without COPD in the small airway epithelium COPD (SAEC) cohort (P < 0.001). The 100 genes most down-regulated in asthma were similarly associated with (A) high FEV1%pred in the BAEC cohort (P < 0.001) and (B) COPD in the SAEC cohort (P < 0.001). Red and blue bars represent all genes ranked by (A) t statistic for correlation of gene expression with FEV1%pred in the BAEC cohort or (B) fold change for association with COPD in the SAEC cohort. Vertical black lines represent the position of genes in the gene set along the ranked gene list. The length of the lines represents the magnitude of the GSEA running enrichment score.
The genes most altered in the airway epithelium in COPD were also altered in asthma. Genes most correlated with low FEV1%pred in the BAEC cohort or with COPD in the SAEC cohort were enriched among genes correlated with asthma (all at P < 0.001; Figure E1). Thus, not only are asthma gene sets correlated with poor lung function in COPD, but COPD gene sets are correlated with an asthma diagnosis.
Leading Edge Set Analysis
The genes in the leading edge sets in both the BAEC and SAEC datasets were combined into asthma–COPD overlap gene sets. The up-regulated overlap genes were enriched among genes down-regulated by ICS with and without LABA treatment compared with placebo at 6 and 30 months in the GLUCOLD dataset (P < 0.001 and P = 0.002, respectively).The down-regulated overlap genes were enriched among genes up-regulated with ICS with and without LABA treatment in the GLUCOLD dataset at 6 months (P < 0.001), but not at 30 months. This suggests that many, but not all, of these overlapping gene expression changes are steroid responsive (see supplemental Results and Tables E7 and E8).
An ingenuity pathway analysis done on the overlapping leading edge gene sets suggests that this asthma–COPD overlap reflects specific cellular and molecular pathways. It particularly identifies multiple pathways involved in epithelial inflammation. The top disease and biological functions were psoriasis, migration of leukemia cell lines, allergy, and hypersensitivity reaction. The top upstream regulators included an IL-6–associated cytokine, oncostatin M (OSM), and multiple members of the activator protein-1 (AP-1) transcription factor family: FOS-like antigens 1 and 2 (FOSL1 and FOSL2) and jun D proto-oncogene (JUND) (see supplemental Results for details).
Signatures of Th2 Inflammation Are Increased in COPD and Associated with Disease Severity
We next studied gene expression signatures related to Th2 inflammation to determine if they accounted for some of the similarities between asthma and COPD. There was a small, but significant, increase in the TGM metric with lower FEV1%pred values in an unadjusted analysis in the BAEC dataset (Spearman’s ρ = −0.16, P = 0.02) and in smokers with versus smokers without COPD (TGM median = 0.05; 95% confidence interval [CI] = −0.78 to 2.80 vs. −0.26; 95% CI = −1.09 to 2.16, respectively) in the SAEC dataset (P = 0.001; Figure E2). In adjusted analyses in the BAEC dataset, this association between TGM and FEV1%pred declined (β = −0.005, P = 0.06, corresponding to a TGM decrease of 0.05 for every 10% decrease in FEV1%pred), with TGM more significantly associated with smoking status (β = −0.27, P = 0.02, corresponding to a decrease in the TGM metric of 0.27 in current vs. former smokers). In stratified analyses, we found a significant association between TGM and FEV1%pred in former smokers (β = −0.009, P = 0.027, corresponding to a TGM decrease of 0.09 for every 10% decrease in FEV1%pred), but not current smokers (P = 0.7). Furthermore, in the SAEC dataset, there was a trend toward lower expression of the TGM metric in current smokers without COPD than in nonsmokers (TGM median = −0.16; 95% CI = −1.19 to 3.75; P = 0.10). At the individual gene level, we found that both POSTN and SERPINB2 may be repressed by smoking (see supplemental Results). Thus, although the TGM metric is significantly up-regulated in COPD, our data suggest that one or more of the three genes comprising this metric may be repressed by current smoking, and therefore may not be the optimal markers of Th2 inflammation in COPD.
Given the significant influence of smoking status on the TGM metric, we developed a 100-gene signature of Th2-related gene expression, the T2S score. By including this broader range of genes, we hypothesized that we would be better able to summarize Th2 inflammation in COPD, while limiting the effect of confounders (e.g., smoking status) on the signature. All 100 genes were highly associated with Th2-high asthma (fold change > 1.25; false discovery rate < 0.05). The T2S score correlated well with Th2-associated clinical characteristics in the asthma dataset (see supplemental Results).
The 100-gene T2S metric was associated with lower FEV1%pred in the BAEC dataset (β = −0.07, P < 0.001, corresponding to a 0.7 score increase for every 10% decrease in FEV1%pred). It was higher in current smokers with COPD (T2S score = 3.51 ± 2.89) than without COPD (T2S score = 0.16 ± 2.39; P < 0.001) in the SAEC dataset (Figure 3). GSEA using the 100 genes summarized by the T2S score corroborated these findings, also showing enrichment of these genes with worsening lung function in both cohorts (P < 0.001; see supplemental Results and Figure E3). Current smokers did have significantly higher T2S scores than former smokers in the BAEC dataset (1.84 units greater, 95% CI = 0.68–3.0; P = 0.002). In the SAEC dataset, smokers without COPD had higher T2S scores than nonsmokers (T2S score in nonsmokers = −2.19 ± 4.70; P < 0.001), but T2S scores were considerably higher in COPD than in both nonsmokers and smokers without COPD. Thus, although smoking status was associated with changes in the T2S score, the association between T2S score and disease status was less affected by differences in smoking status. Further clinical associations could not be made, due to poor clinical characterization of these cohorts. However, in subjects with COPD in each dataset, the T2S metric correlated well with gene expression of v-Kit Hardy-Zuckerman 4 feline sarcoma viral oncogene homolog (KIT), carboxypeptidase A3 (CPA3), and eotaxin-3 (CCL26), genes previously identified to be highly associated with Th2 inflammation in asthma (Figure E3) (25).
Figure 3.

Relationship between T helper (Th) type 2 signature (T2S) score and measurements of lung function decline. The 100-gene T2S score (A) increases with decreasing FEV1 % predicted (FEV1%pred) in the bronchial airway epithelium chronic obstructive pulmonary disease (COPD) cohort (fold change = −0.7 for every 10% increase in FEV1%pred; P < 0.001), and (B) is higher in subjects with COPD (3.51 ± 2.89 [mean ± SD]) than in smokers without airway obstruction (0.16 ± 2.39) and in nonsmokers without airway obstruction (−2.19 ± 4.70) in the small airway epithelium COPD cohort (P < 0.001 for all comparisons).
Hierarchical clustering of the TGM metric suggested that a subset of approximately 5% of smokers in both COPD datasets had gene expression patterns consistent with a Th2-high state (Figure E5). Clustering by the T2S metric suggests that a larger subgroup of smokers (∼20%) had increased expression of the Th2-high signature (Figure 4). Thus, the exact size of the COPD subgroup identified by these signatures is uncertain. Importantly, in the BAEC dataset, a higher T2S score was not associated with a history of asthma (P = 0.78, green and red bars above heatmap in Figure 4A).
Figure 4.

Heatmap of the 100-gene Th2-high gene signature supervised by T helper (Th) type 2 signature (T2S) score. Shown for the (A) bronchial airway epithelium chronic obstructive pulmonary disease (COPD) dataset and (B) small airway epithelium COPD dataset. Genes are in rows and samples are in columns arranged from low to high T2S score. Red indicates high relative expression; blue indicates low relative expression; yellow and purple bar above each heatmap indicates COPD status. The green and red bar in A indicates asthma status. Unsupervised clustering gives a similar result, with approximately 20% as Th2 high; however, the genes first cluster by smoking status, then by the T2S metric.
Association of the T2S Score with Clinical Parameters in the GLUCOLD Cohort
We next studied the association of the endobronchial T2S metric with asthma-related features and ICS therapy response in the GLUCOLD study (6).
At baseline, the T2S score was associated with increased tissue eosinophil numbers in these steroid-naive subjects (P = 0.003; Figure 5A). It was also associated with increased serum eosinophil percentage (P = 0.03; Figure E6A), and increased bronchodilator responsiveness (P = 0.01; Figure E6B) There was a trend toward decreased tissue neutrophil counts (P = 0.084). No association was found between the T2S score and serum IgE levels.
Figure 5.
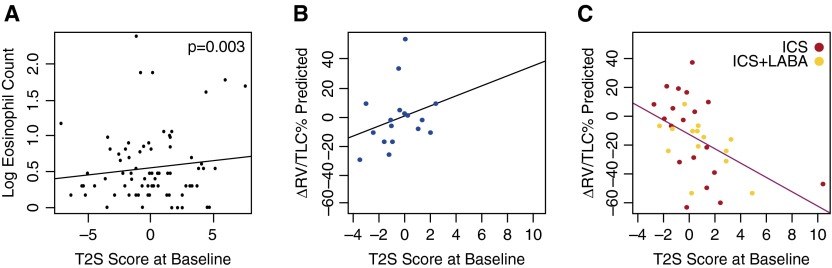
T helper (Th) type 2 signature (T2S) score in the Groningen and Leiden Universities study of Corticosteroids in Obstructive Lung Disease (GLUCOLD) dataset. (A) The T2S score derived from endobronchial biopsy data was associated with increasing eosinophil counts in subjects with chronic obstructive pulmonary disease in the GLUCOLD cohort at baseline (steroid naive; P = 0.003). In the longitudinal analyses, increased baseline T2S score was associated with a greater decrease in residual volume (RV)/total lung capacity (TLC) % predicted in (C) the treatment group (inhaled corticosteroid [ICS] ± long-acting β-agonist [LABA]) compared with (B) placebo at 30 months (P = 0.019 for the interaction between treatment and T2S score).
In the longitudinal treatment analysis, baseline T2S score was not associated with slower decline in post-bronchodilator FEV1%pred or decreased hyperresponsiveness after ICS with and without LABA compared with placebo. However, a higher T2S score was associated with greater hyperinflation improvement (change in RV/TLC % predicted, a measure of small airway obstruction) after ICS with and without LABA treatment versus placebo at 30 months (Figures 5B and 5C; P = 0.019 for the interaction between T2S score and treatment), and a trend toward improvement at 6 months (P = 0.056). When LABA-receiving participants were excluded, those treated with ICS alone still showed greater hyperinflation improvements compared with placebo (P < 0.001 at 6 mo; P = 0.042 at 30 mo). The T2S score was also associated with an improvement in IC (another marker of hyperinflation), after ICS with and without LABA versus placebo at 6 months (Figures E7A and E7B; P = 0.018) (26), although not at 30 months.
Discussion
In this study, we identify a set of airway epithelial genes that is altered in asthma and in some current and former smokers with COPD, suggesting similar processes leading to airflow obstruction in asthma and at least a COPD subgroup. We also find evidence that, in COPD, as in asthma, a Th2 inflammation–related gene expression signature is up-regulated when compared with subjects without disease. This overall up-regulation is again due to increased expression in a subgroup. Signature expression in COPD is further associated with asthma-related inflammatory characteristics (e.g., increased bronchial tissue and blood eosinophils, increased bronchodilator responsiveness) and a favorable ICS treatment response, as reflected by greater improvement in hyperinflation. Thus, our data identify molecular and cellular pathways underlying a clinically relevant COPD subgroup with asthma-like features. They further suggest that the Th2-related signature may serve as a biomarker to predict which patients with COPD will benefit from ICS treatment or other Th2-targeted therapies, particularly identifying the subgroup that will show improvement in small airway disease.
Importantly, subjects with COPD that have a Th2-high signature are not identifiable by clinical history of asthma alone. Th2-high signatures did not correlate with asthma history in the BAEC dataset, and subjects with a history of asthma were excluded from the GLUCOLD trial. This suggests that a biomarker is necessary to identify the subjects with COPD in which Th2 inflammation plays a more important role in pathogenesis.
Shared airway gene expression alterations in asthma and COPD could reflect stereotypical epithelial responses to airway injury. However, our data argue specifically for a Th2-related gene expression response in at least a COPD subgroup. First, we found an increase in tissue and blood eosinophils, as well as response to ICS with increasing Th2-related gene expression in the GLUCOLD trial. Second, the T2S score is increased in subjects with COPD compared with both smokers without COPD and nonsmokers in the SAEC dataset, suggesting that long-term smoking–induced injury alone is not enough to cause the increase observed in COPD. In addition, the extent of Th2-related gene expression correlates with gene expression of specific mast cell markers (CPA3, KIT) and CCL26 (eotaxin-3), which also increases in Th2-high asthma (26–28). CPA3 marks an increase in intraepithelial mast cell numbers in asthma, and CCL26 is an eosinophil chemotactic molecule, the epithelial expression of which increases with increasing asthma severity (26, 28).
The improvement in hyperinflation related to the T2S metric is likely clinically relevant, as it is an important COPD characteristic. We indeed found that two measures of hyperinflation, RV/TLC % predicted and IC, showed improvement. Measures of hyperinflation are more closely associated with dyspnea and reduced exercise capacity than FEV1%pred in COPD (29). Hyperinflation reflects airflow limitation of the small peripheral airways, the main site of the COPD inflammatory response (28). Our T2S score may therefore identify those patients with COPD more likely to have dynamic and ICS-responsive distal airflow limitation. In asthma, bronchial hyperresponsiveness is extremely steroid sensitive, and ICS therapy leads to improvements in central airway obstruction, as reflected by changes in FEV1. The fact that we find improvements in hyperinflation, but not FEV1 or hyperresponsiveness, suggests that we are not just identifying a group of subjects with asthma who have been misclassified as COPD, but are indeed identifying a specific COPD subgroup.
We recognize that we are measuring the T2S score in GLUCOLD in the large, not distal, airways, where we are observing the physiologic change. However, we have previously shown that gene expression changes in the large airways in COPD are consistent with those found in the small airways; thus, these gene expression changes could reflect distal pathology (17). The association between our T2S and hyperinflation adds further evidence to this hypothesis.
Pathway analysis suggests that the observed gene expression overlap may reflect additional non–Th2 inflammatory pathways. Psoriasis, a disease characterized by epithelial inflammation (particularly IFN-, TNF-α–, Th1-, and Th17-mediated inflammation), was the top disease category identified. OSM and AP-1 transcription factor proteins were found to be possible upstream regulators of the gene expression alterations. OSM encodes oncostatin M, an IL-6–associated cytokine hypothesized to play a key role in airway remodeling in asthma and COPD (30, 31) The redox-sensitive proinflammatory transcription factor AP-1 likely contributes to airway disease pathology in multiple ways, including a role in glucocorticoid resistance (32, 33). Thus, there are likely other areas of overlap to be explored in future studies. In addition, although the majority of the overlap genes are steroid responsive in the GLUCOLD dataset, at least one-third are not. This further suggests that the gene expression changes reflect biology beyond Th2 inflammation.
Our analysis was limited by the different microarray platforms and patient populations studied in each dataset, prohibiting direct comparisons between datasets. To overcome this, we used: (1) GSEA, a tool previously shown to be effective in dataset comparison (34); and (2) gene signature analysis within datasets. These tools allowed us to identify similarities between asthma and COPD on a gene set level. Our study also had multiple strengths. The gene expression datasets contained large subject numbers, and we were able to validate our findings in one dataset with another. We were also able to show that our Th2-associated signature was associated with asthma-related features and a treatment response in a third independent cohort.
The increase of our gene signature in some, but not all, subjects with COPD and its association with clinical parameters suggest a Th2-high COPD endotype. However, our cluster analysis does not definitively establish the size of this group. The modest phenotypic characterization of each cohort also makes it difficult to determine the full range of phenotype features associated with this group. Analysis of our T2S metric in larger, extensively characterized cohorts will allow us to better establish the size of the Th2-high subgroup and confirm the clinical utility of these genomic markers. Ultimately, the derivation of noninvasive biomarkers from these signatures may be valuable for clinical application, similar to the use of periostin to predict treatment response in asthma (12, 13).
In conclusion, our study suggests that a subset of current and former smokers develops an asthma–COPD overlap condition that is associated with gene expression markers of Th2 inflammation in the airway, increased airway wall and blood eosinophils, greater bronchodilator responsiveness, and improvement in hyperinflation with ICS treatment. The presence of these asthma-associated Th2-associated signatures is not predicted by a simple clinical history of asthma. Future studies will be directed at determining whether these signatures can be leveraged to develop less-invasive biomarkers for characterizing lung inflammation, and for more specific targeting of therapies in COPD.
Footnotes
Supported by National Institutes of Health (NIH) grant R01 HL095372 (P.G.W. and S.A.C.), NIH/National Heart, Lung, and Blood Institute grants R01 HL101715, R01 HL118542 (M.E.L., A.S., and K.S.), and 2T32HL7185-36 (S.A.C.), and grants from Genentech (P.G.W.) provided funding for the studies, but had no role in the writing or submitting of the manuscript.
Author Contributions: S.A.C., K.S., M.v.d.B., M.E.L., A.S., and P.G.W. conceived and designed the study; S.A.C., K.S., and M.v.d.B analyzed the data with supervision and assistance from M.E.L., A.S., and P.G.W; K.H. contributed new analytic tools; S.A.C., K.S., M.v.d.B., P.S.H., D.S.P., M.E.L., A.S., and P.G.W. contributed data/materials; S.A.C. and P.G.W. prepared the manuscript; all other authors revised the manuscript and approved of the final draft.
This article has an online supplement, which is accessible from this issue’s table of contents at www.atsjournals.org
Originally Published in Press as DOI: 10.1164/rccm.201408-1458OC on January 22, 2015
Author disclosures are available with the text of this article at www.atsjournals.org.
References
- 1.World Health Organization. Geneva: World Health Organization; 2013. World health statistics 2013. [Google Scholar]
- 2.Buist AS, McBurnie MA, Vollmer WM, Gillespie S, Burney P, Mannino DM, Menezes AM, Sullivan SD, Lee TA, Weiss KB, et al. BOLD Collaborative Research Group. International variation in the prevalence of COPD (the BOLD study): a population-based prevalence study. Lancet. 2007;370:741–750. doi: 10.1016/S0140-6736(07)61377-4. [DOI] [PubMed] [Google Scholar]
- 3.Postma DS, Reddel HK, Ten Hacken NH, van den Berge M. Asthma and chronic obstructive pulmonary disease: similarities and differences. Clin Chest Med. 2014;35:143–156. doi: 10.1016/j.ccm.2013.09.010. [DOI] [PubMed] [Google Scholar]
- 4.Telenga ED, Kerstjens HA, Postma DS, Ten Hacken NH, van den Berge M. Inhaled corticosteroids in chronic obstructive pulmonary disease: a review. Expert Opin Pharmacother. 2010;11:405–421. doi: 10.1517/14656560903510628. [DOI] [PubMed] [Google Scholar]
- 5.Lapperre TS, Snoeck-Stroband JB, Gosman MM, Jansen DF, van Schadewijk A, Thiadens HA, Vonk JM, Boezen HM, Ten Hacken NH, Sont JK, et al. Effect of fluticasone with and without salmeterol on pulmonary outcomes in chronic obstructive pulmonary disease: a randomized trial. Ann Intern Med. 2009;151:517–527. doi: 10.7326/0003-4819-151-8-200910200-00004. [DOI] [PubMed] [Google Scholar]
- 6.van den Berge M, Vonk JM, Gosman M, Lapperre TS, Snoeck-Stroband JB, Sterk PJ, Kunz LI, Hiemstra PS, Timens W, Ten Hacken NH, et al. Clinical and inflammatory determinants of bronchial hyperresponsiveness in COPD. Eur Respir J. 2012;40:1098–1105. doi: 10.1183/09031936.00169711. [DOI] [PubMed] [Google Scholar]
- 7.Barnes PJ. The cytokine network in asthma and chronic obstructive pulmonary disease. J Clin Invest. 2008;118:3546–3556. doi: 10.1172/JCI36130. [DOI] [PMC free article] [PubMed] [Google Scholar]
- 8.Barcelo B, Pons J, Fuster A, Sauleda J, Noguera A, Ferrer JM, Agustí AG. Intracellular cytokine profile of T lymphocytes in patients with chronic obstructive pulmonary disease. Clin Exp Immunol. 2006;145:474–479. doi: 10.1111/j.1365-2249.2006.03167.x. [DOI] [PMC free article] [PubMed] [Google Scholar]
- 9.Woodruff PG, Boushey HA, Dolganov GM, Barker CS, Yang YH, Donnelly S, Ellwanger A, Sidhu SS, Dao-Pick TP, Pantoja C, et al. Genome-wide profiling identifies epithelial cell genes associated with asthma and with treatment response to corticosteroids. Proc Natl Acad Sci USA. 2007;104:15858–15863. doi: 10.1073/pnas.0707413104. [DOI] [PMC free article] [PubMed] [Google Scholar]
- 10.Woodruff PG, Modrek B, Choy DF, Jia G, Abbas AR, Ellwanger A, Koth LL, Arron JR, Fahy JV. T-helper type 2–driven inflammation defines major subphenotypes of asthma. Am J Respir Crit Care Med. 2009;180:388–395. doi: 10.1164/rccm.200903-0392OC. [DOI] [PMC free article] [PubMed] [Google Scholar]
- 11.Bhakta NR, Solberg OD, Nguyen CP, Nguyen CN, Arron JR, Fahy JV, Woodruff PG. A qPCR-based metric of Th2 airway inflammation in asthma. Clin Transl Allergy. 2013;3:24. doi: 10.1186/2045-7022-3-24. [DOI] [PMC free article] [PubMed] [Google Scholar]
- 12.Corren J, Lemanske RF, Hanania NA, Korenblat PE, Parsey MV, Arron JR, Harris JM, Scheerens H, Wu LC, Su Z, et al. Lebrikizumab treatment in adults with asthma. N Engl J Med. 2011;365:1088–1098. doi: 10.1056/NEJMoa1106469. [DOI] [PubMed] [Google Scholar]
- 13.Hanania NA, Wenzel S, Rosen K, Hsieh HJ, Mosesova S, Choy DF, Lal P, Arron JR, Harris JM, Busse W. Exploring the effects of omalizumab in allergic asthma: an analysis of biomarkers in the EXTRA study. Am J Respir Crit Care Med. 2013;187:804–811. doi: 10.1164/rccm.201208-1414OC. [DOI] [PubMed] [Google Scholar]
- 14.Subramanian A, Tamayo P, Mootha VK, Mukherjee S, Ebert BL, Gillette MA, Paulovich A, Pomeroy SL, Golub TR, Lander ES, et al. Gene set enrichment analysis: a knowledge-based approach for interpreting genome-wide expression profiles. Proc Natl Acad Sci USA. 2005;102:15545–15550. doi: 10.1073/pnas.0506580102. [DOI] [PMC free article] [PubMed] [Google Scholar]
- 15.van den Berge M, Steiling K, Timens W, Hiemstra PS, Sterk PJ, Heijink IH, Liu G, Alekseyev YO, Lenburg ME, Spira A, et al. Airway gene expression in COPD is dynamic with inhaled corticosteroid treatment and reflects biological pathways associated with disease activity. Thorax. 2014;69:14–23. doi: 10.1136/thoraxjnl-2012-202878. [DOI] [PMC free article] [PubMed] [Google Scholar]
- 16.Christenson SA, van den Berge M, Steiling K, Hijazi K, Hiemstra PS, Postma DS, Lenburg ME, Spira A, Woodruff PG. Asthma–COPD overlap: genomic signatures of asthma correlate with eosinophilia and predict response to inhaled corticosteroids [abstract] Am J Respir Crit Care Med. 2014;189:A2174. doi: 10.1164/rccm.201408-1458OC. [DOI] [PMC free article] [PubMed] [Google Scholar]
- 17.Steiling K, van den Berge M, Hijazi K, Florido R, Campbell J, Liu G, Xiao J, Zhang X, Duclos G, Drizik E, et al. A dynamic bronchial airway gene expression signature of COPD and lung function impairment. Am J Respir Crit Care Med. 2013;187:933–942. doi: 10.1164/rccm.201208-1449OC. [DOI] [PMC free article] [PubMed] [Google Scholar]
- 18.Tilley AE, O'Connor TP, Hackett NR, Strulovici-Barel Y, Salit J, Amoroso N, Zhou XK, Raman T, Omberg L, Clark A, et al. Biologic phenotyping of the human small airway epithelial response to cigarette smoking. PLoS One. 2011;6:e22798. doi: 10.1371/journal.pone.0022798. [DOI] [PMC free article] [PubMed] [Google Scholar]
- 19.Irizarry RA, Hobbs B, Collin F, Beazer-Barclay YD, Antonellis KJ, Scherf U, Speed TP. Exploration, normalization, and summaries of high density oligonucleotide array probe level data. Biostatistics. 2003;4:249–264. doi: 10.1093/biostatistics/4.2.249. [DOI] [PubMed] [Google Scholar]
- 20.Gentleman RC, Carey VJ, Bates DM, Bolstad B, Dettling M, Dudoit S, Ellis B, Gautier L, Ge Y, Gentry J, et al. Bioconductor: open software development for computational biology and bioinformatics. Genome Biol. 2004;5:R80. doi: 10.1186/gb-2004-5-10-r80. [DOI] [PMC free article] [PubMed] [Google Scholar]
- 21.Gautier L, Cope L, Bolstad BM, Irizarry RA. affy–analysis of Affymetrix GeneChip data at the probe level. Bioinformatics. 2004;20:307–315. doi: 10.1093/bioinformatics/btg405. [DOI] [PubMed] [Google Scholar]
- 22.Smyth GK. Linear models and empirical bayes methods for assessing differential expression in microarray experiments. Stat Appl Genet Mol Biol. 2004;3:1–25. doi: 10.2202/1544-6115.1027. [DOI] [PubMed] [Google Scholar]
- 23.Benjamini Y, Hochberg Y. Controlling the false discovery rate: a practical and powerful approach to multiple testing. J R Stat Soc, B. 1995;57:289–300. [Google Scholar]
- 24.Misra J, Schmitt W, Hwang D, Hsiao LL, Gullans S, Stephanopoulos G, Stephanopoulos G. Interactive exploration of microarray gene expression patterns in a reduced dimensional space. Genome Res. 2002;12:1112–1120. doi: 10.1101/gr.225302. [DOI] [PMC free article] [PubMed] [Google Scholar]
- 25.Choy DF, Modrek B, Abbas AR, Kummerfeld S, Clark HF, Wu LC, Fedorowicz G, Modrusan Z, Fahy JV, Woodruff PG, et al. Gene expression patterns of Th2 inflammation and intercellular communication in asthmatic airways. J Immunol. 2011;186:1861–1869. doi: 10.4049/jimmunol.1002568. [DOI] [PMC free article] [PubMed] [Google Scholar]
- 26.Garcia-Rio F, Lores V, Mediano O, Rojo B, Hernanz A, López-Collazo E, Alvarez-Sala R. Daily physical activity in patients with chronic obstructive pulmonary disease is mainly associated with dynamic hyperinflation. Am J Respir Crit Care Med. 2009;180:506–512. doi: 10.1164/rccm.200812-1873OC. [DOI] [PubMed] [Google Scholar]
- 27.Dougherty RH, Sidhu SS, Raman K, Solon M, Solberg OD, Caughey GH, Woodruff PG, Fahy JV. Accumulation of intraepithelial mast cells with a unique protease phenotype in T(H)2-high asthma. J Allergy Clin Immunol. 2010;125:1046–1053.e8. doi: 10.1016/j.jaci.2010.03.003. [DOI] [PMC free article] [PubMed] [Google Scholar]
- 28.Burgel PR, Bourdin A, Chanez P, Chabot F, Chaouat A, Chinet T, de Blic J, Devillier P, Deschildre A, Didier A, et al. Update on the roles of distal airways in COPD. Eur Respir Rev. 2011;20:7–22. doi: 10.1183/09059180.10010610. [DOI] [PMC free article] [PubMed] [Google Scholar]
- 29.McDonough JE, Yuan R, Suzuki M, Seyednejad N, Elliott WM, Sanchez PG, Wright AC, Gefter WB, Litzky L, Coxson HO, et al. Small-airway obstruction and emphysema in chronic obstructive pulmonary disease. N Engl J Med. 2011;365:1567–1575. doi: 10.1056/NEJMoa1106955. [DOI] [PMC free article] [PubMed] [Google Scholar]
- 30.Baines KJ, Simpson JL, Gibson PG. Innate immune responses are increased in chronic obstructive pulmonary disease. PLoS One. 2011;6:e18426. doi: 10.1371/journal.pone.0018426. [DOI] [PMC free article] [PubMed] [Google Scholar]
- 31.Simpson JL, Baines KJ, Boyle MJ, Scott RJ, Gibson PG, Oncostatin M. Oncostatin M (OSM) is increased in asthma with incompletely reversible airflow obstruction. Exp Lung Res. 2009;35:781–794. doi: 10.3109/01902140902906412. [DOI] [PubMed] [Google Scholar]
- 32.Biswas SK, Rahman I. Environmental toxicity, redox signaling and lung inflammation: the role of glutathione. Mol Aspects Med. 2009;30:60–76. doi: 10.1016/j.mam.2008.07.001. [DOI] [PMC free article] [PubMed] [Google Scholar]
- 33.Barnes PJ. Corticosteroid resistance in patients with asthma and chronic obstructive pulmonary disease. J Allergy Clin Immunol. 2013;131:636–645. doi: 10.1016/j.jaci.2012.12.1564. [DOI] [PubMed] [Google Scholar]
- 34.Zeskind JE, Lenburg ME, Spira A. Translating the COPD transcriptome: insights into pathogenesis and tools for clinical management. Proc Am Thorac Soc. 2008;5:834–841. doi: 10.1513/pats.200807-074TH. [DOI] [PMC free article] [PubMed] [Google Scholar]