Abstract
Purpose.
The purpose of this study was to investigate the impact of obesity-induced prediabetes/early diabetes on the retina to provide new evidence on the pathogenesis of type 2 diabetes–associated diabetic retinopathy (DR).
Methods.
A high-fat diet (HFD)–induced obesity mouse model (male C57BL/6J) was used in this study. At the end of the 12-week HFD feeding regimen, mice were evaluated for glucose and insulin tolerance, and retinal light responses were recorded by electroretinogram (ERG). Western immunoblot and immunohistochemical staining were used to determine changes in elements regulating calcium homeostasis between HFD and control retinas, as well as unstained human retinal sections from DR patients and age-appropriate controls.
Results.
Compared to the control, the scotopic and photopic ERGs from HFD mice were decreased. There were significant decreases in molecules related to cell signaling, calcium homeostasis, and glucose metabolism from HFD retinas, including phosphorylated protein kinase B (pAKT), glucose transporter 4, L-type voltage-gated calcium channel (L-VGCC), and plasma membrane calcium ATPase (PMCA). Similar changes for pAKT, PMCA, and L-VGCC were also observed in human retinal sections from DR patients.
Conclusions.
Obesity-induced hyperglycemic and prediabetic/early diabetic conditions caused detrimental impacts on retinal light sensitivities and health. The decrease of the ERG components in early diabetes reflects the decreased neuronal activity of retinal light responses, which may be caused by a decrease in neuronal calcium signaling. Since PI3K-AKT is important in regulating calcium homeostasis and neural survival, maintaining proper PI3K-AKT signaling in early diabetes or at the prediabetic stage might be a new strategy for DR prevention.
Keywords: obesity, type 2 diabetes, retinopathy, calcium homeostasis, high-fat diet
Obesity-induced prediabetes/early diabetes caused decreases in retinal light sensitivities and changes in several molecules related to calcium homeostasis and cell signaling. These changes were also observed in the retina with diabetic retinopathy (DR). This study provided new evidence on the pathogenesis of DR.
Diabetes is a fast-growing global problem with 90% of diabetic patients suffering from type 2 diabetes (http://www.who.int/mediacentre/factsheets/fs312/en/; provided in the public domain by the World Health Organization). In the United States, obesity-associated type 2 diabetes has reached epidemic proportions with more than 68% of American adults considered overweight or obese (http://win.niddk.nih.gov/statistics/index.htm; provided in the public domain by the National Institute of Diabetes and Digestive and Kidney Diseases). One major complication of diabetes is diabetic retinopathy (DR), the leading cause of blindness among American adults.1–3 More than 60% of type 2 diabetic patients will develop DR.4,5 Even though DR is a dual disorder with microvascular complications and retinal degeneration, clinically, DR has been investigated and treated as a complication of retinal vasculature.6 However, recent developments of highly sensitive techniques, such as the multifocal electroretinogram (ERG),7 suggest that the neural retina starts to degenerate in early diabetes before clinical signs of DR and any vascular complications. The distorted color vision and altered cone pathway responses, including the delayed ERG a-wave implicit time, are among the first clinical signs in diabetic patients without DR.8–10 Changes in retinal microglia, loss of contrast sensitivity, and degeneration of neural retina are all early features of retinopathy before onset of detectable vascular changes.6,8 Hence, changes in the neural retina due to diabetic conditions precede any vascular complications.
Impaired calcium (Ca2+) homeostasis is observed in neurons in diabetic neuropathy,11 as well as in DR.12–14 Dysregulation of intracellular Ca2+ levels causes neuronal death and contributes to neurodegenerative diseases.15 In the retina, impaired Ca2+ homeostasis due to environmental stresses, such as bright light or heavy metal toxicity, leads to photoreceptor apoptosis and retinal degeneration,16,17 emphasizing the importance of Ca2+ homeostasis for neuronal survival. Calcium is highly compartmentalized in the retinal photoreceptor,18,19 and intracellular Ca2+ homeostasis is dynamically regulated by Ca2+ channels, transporters, and intracellular Ca2+ stores.19 Calcium influx through L-type voltage-gated calcium channels (L-VGCCs), the major Ca2+ channel present in the photoreceptor inner segments and synaptic terminals, is essential for neurotransmitter release, Ca2+ homeostasis, and other cellular processes.18,20,21 Mutations of the L-VGCCα1 subunit cause a defect in photoreceptor neurotransmission and congenital blindness.22–25 In several inherited retinal degeneration diseases, abnormal intracellular Ca2+ concentration is often observed in apoptotic photoreceptors.26,27 The Ca2+ influx via L-VGCCs activates phospholipase C (PLC) and triggers a release of Ca2+ from the endoplasmic reticulum (ER) Ca2+ stores, which increases intracellular Ca2+ concentration,18,28,29 subsequently activating multiple cellular responses, including Ca2+ uptake/refilling by ER, metabolism, and gene expression.18,28,29 The PLC-dependent increase of intracellular Ca2+ concentration then induces feedback regulation and modulates L-VGCC activities in cones30 and other cell types.31–35 Plasma membrane Ca2+ ATPase 1 (PMCA1) is another critical player in Ca2+ homeostasis36 by extruding excess Ca2+ at the synaptic terminals of photoreceptors and other retinal neurons.28,37,38 Importantly, the L-VGCCs regulate PMCA1 trafficking and translocation into the plasma membrane at the photoreceptor synaptic terminals.39 Hence, Ca2+ influx through L-VGCCs leads to changes in ER Ca2+ stores and PMCA1, with further feedback modulation on L-VGCCs. The dynamics among L-VGCCs, intracellular Ca2+ stores, and PMCA1 are responsible for maintaining Ca2+ homeostasis and overall health of photoreceptors.
In the retina, the intracellular glucose levels fluctuate following systemic glycemia.40,41 Hyperglycemia is sufficient to initiate the development of DR in animal models.4,42 For example, the L-VGCCs are decreased in the pericytes of retinal microvasculature isolated from DR animals.43 In in vitro studies, stimulus-induced increase of intracellular Ca2+ concentration is significantly enhanced in cultured retinal cells that are under acute hyperglycemic conditions.13,14 Hence, it is possible that chronic hyperglycemia in obesity-associated type 2 diabetes might impair intracellular Ca2+ homeostasis by causing changes in L-VGCCs and PMCA1. In this study, we examined the effects of high-fat diet (HFD)–induced obesity and prediabetic/early diabetic conditions on retinal function. We used ERG recordings to measure the retinal light responses, as well as Western immunoblot and immunohistochemistry to determine the physiological and molecular changes in the retina caused by obesity-induced hyperglycemia.
Materials and Methods
Animals
Male C57BL/6J mice were used in this study. All animal experiments were approved by the Institutional Animal Care and Use Committee of Texas A&M University and were performed in compliance with the ARVO Statement for the Use of Animals in Ophthalmic and Vision Research. Mice were housed under temperature- and humidity-controlled conditions with 12:12 hour light–dark cycles. All mice were fed with laboratory chow and water ad libitum. Starting at 5 weeks of age, mice were fed either an HFD (59.4% fat calories, 18.1% protein calories, and 22.5% carbohydrates calories; TestDiet, St. Louis, MO, USA) or normal standard laboratory chow (as controls; 10% fat calories, 20% protein calories, and 70% carbohydrates calories; Research Diets, Inc., New Brunswick, NJ, USA) for 12 weeks. Their body weight and food intake were monitored throughout. The epididymal, mesenteric, and perinephric fat tissues were excised from mice and weighted to evaluate visceral fat adiposity44 at the end of the feeding regimen.
Glucose and Insulin Tolerance Tests
At the end of the 12-week feeding regimen, mice were fasted for 8 hours and received a single intraperitoneal injection of d-glucose (2 g/kg body weight; Sigma-Aldrich Corp., St. Louis, MO, USA) or insulin (1 unit/kg body weight; Gibco/Life Technologies, Grand Island, NY, USA). For glucose tolerance tests, blood glucose levels were detected from the tail vein before and at 30, 60, 90, and 120 minutes after the glucose injection. For insulin tolerance tests, blood glucose levels were detected from the tail vein before and at 15, 30, 45, and 60 minutes after the bolus insulin injection.45–47 The blood glucose levels were measured by the Clarity Plus Blood Glucose Monitoring System (Diagnostic Test Group, Boca Raton, FL, USA).
Electroretinogram
At the end of the feeding regimen (at 17 weeks of age), mice were dark adapted for a minimum of 6 hours and anesthetized with an intraperitoneal injection of Avertin (0.5 mL/25 g-body weight of 2% 2,2,2-tribromoethanol, 1.25% tert-amyl alcohol; Fisher Scientific, Pittsburgh, PA, USA). Mice were placed on a heated pad to maintain the body temperature at 37°C. The ground electrode was placed on the tail, the reference electrode was placed under the skin in the cheek area below the eye, and the threaded recording electrode conjugated with a mini contact lens (OcuScience, Henderson, NV, USA) was placed on the surface of the cornea. A drop of Goniovisc (Hub Pharmaceuticals, Rancho Cucamonga, CA, USA) was applied on the surface of the cornea to keep it moist and to maintain a proper contact between the cornea and the recording electrode. A portable ERG device (OcuScience) was used for the ERG recordings. For the scotopic ERG recordings, mice were first dark adapted for at least 6 hours. The ERG measurements were carried out sequentially at light intensities of 0.1, 0.3, 1.0, 3.0, 10, and 25 cd·s/m2. A 1-minute recovery period was allowed between different intensities. Responses to four light flashes were averaged for the final ERG measurement at the lower light intensities (0.1, 0.3, 1.0, and 3.0 cd·s/m2), and only one light flash was applied for the higher light intensities (10 and 25 cd·s/m2). For the photopic ERG recordings, mice were first adapted to the background light at 30 cd·s/m2 for 10 minutes, followed by exposure to a series of light stimulations from 0.1 to 25 cd·s/m2 with 32 flashes (0.5-second interval) at each light intensity. Responses to 32 light flashes were averaged for the final ERG measurement. The amplitudes and implicit time of a- and b-waves were recorded and analyzed by using the ERGView 4.4 software (OcuScience).
Western Immunoblot Analysis
Retina tissue samples were collected and prepared as described previously.48,49 Two retinas collected from a single mouse were pooled together and prepared for the whole retinal lysate (as n = 1). Briefly, intact retinas were homogenized in a Tris lysis buffer including 50 mM Tris, 1 mM EGTA, 150 mM NaCl, 1% Triton X-100, 1% β-mercaptoethanol, 50 mM NaF, 1 mM Na3VO4; pH 7.5. Samples were separated on 10% sodium dodecyl sulfate–polyacrylamide gels by electrophoresis and transferred to nitrocellulose membranes. The primary antibodies used in this study were as follows: anti-glucose transporter 4 (anti-GLUT4; Cell Signaling Technology, Danvers, MA, USA), anti-phosphorylated protein kinase B (AKT) at Thr 308 (anti-pAKTthr308; Cell Signaling Technology), anti-AKT (total AKT, used for loading control; Cell Signaling Technology), anti-L-VGCCα1D (Alomone, Jerusalem, Israel), anti-PMCA1 (Santa Cruz Biochemicals, Santa Cruz, CA, USA), anti-extracellular signal-regulated kinase (ERK42,44 used for loading control; Santa Cruz Biochemicals), anti-NF-κB p65 (P65; Cell Signaling Technology), and anti-phosphorylated nuclear factor κ-light-chain enhancer of activated B cells complex (NF-κB) p65 at Ser536 (pP65; Cell Signaling Technology). Blots were visualized by using appropriate secondary antibodies conjugated to horseradish peroxidase (Cell Signaling Technology) and an enhanced chemiluminescence detection system (Pierce, Rockford, IL, USA). Relative protein expressions for all proteins involved in this study are reported as a ratio to total ERK. Band intensities were quantified by densitometry using Scion Image (National Institutes of Health, Bethesda, MD, USA). Each experimental group (control and HFD) contained retinas from four different animals (n = 4). All of the blots were the total proteins prepared from the whole retinal lysates but not specifically prepared from the plasma membrane fractions.
Immunohistochemistry
The unstained human retinal sections from DR patients (n = 3) and age-appropriate controls (n = 3) were obtained from the National Human Tissue Resource Center (NDRI, Philadelphia, PA, USA). Only a single section from each patient was processed for immunostaining. The whole mouse eyes were excised and fixed with Zamboni fixative for 24 hours. After wash with 0.1 M phosphate-buffered saline (PBS; pH = 7.4) and dehydration through a series of ethanol gradients, eyes were embedded in paraffin, sectioned at 4-μm thickness, and mounted on glass slides. The sections were first heated at 60°C for 20 to 25 minutes then went through a series of Limonene and ethanol solutions for deparaffinization. The deparaffinized sections were processed for antigen retrieval through incubation in 10 mM sodium citrate buffer (containing 0.05% Tween 20, pH 6.0) at 80°C for 1 hour, followed by washing with PBS. The sections were incubated with a blocking solution containing 10% goat serum in PBS for 2 hours at room temperature after deparaffinization and antigen retrieval procedures. The sections were then incubated with the primary antibody at 4°C overnight. The next day sections were washed with PBS, incubated with a secondary antibody at room temperature for 2 hours in the dark, washed with PBS, and mounted with the ProLong Gold antifade reagents and 4′,6-diamidino-2-phenylindole (DAPI; Invitrogen/Life Technologies, Grand Island, NY, USA). The images were taken under a Zeiss Stallion microscope (Carl Zeiss AG, Oberkochen, Germany). The primary antibodies used were as follows: anti–L-VGCCα1D (1:100; Alomone), anti-PMCA1 (1:50; Santa Cruz Biochemicals), anti-AKT (total AKT, 1:100; Cell Signaling Technology), anti-pAKTthr308 (1:100; Cell Signaling Technology), P65 (1:100; Cell Signaling Technology), and pP65 (1:100; Cell Signaling Technology). The secondary antibodies used were Alexa Fluor 488 goat anti-rabbit IgG (1:200; Molecular Probes/Life Technologies, Grand Island, NY, USA) and Cy5 goat anti-mouse IgG (1:200; Abcam, Cambridge, MA, USA). Three retinas from three different animals for each group were processed, thus n = 3 (three animals), and three sections from each retina were selected.
Statistical Analysis
All data are presented as mean ± SEM (standard error of mean). Student's t-test was used for statistical analysis between the control and HFD groups. Throughout, P < 0.05 was regarded as significant.
Results
Chronic HFD Caused Hyperglycemia in Mice
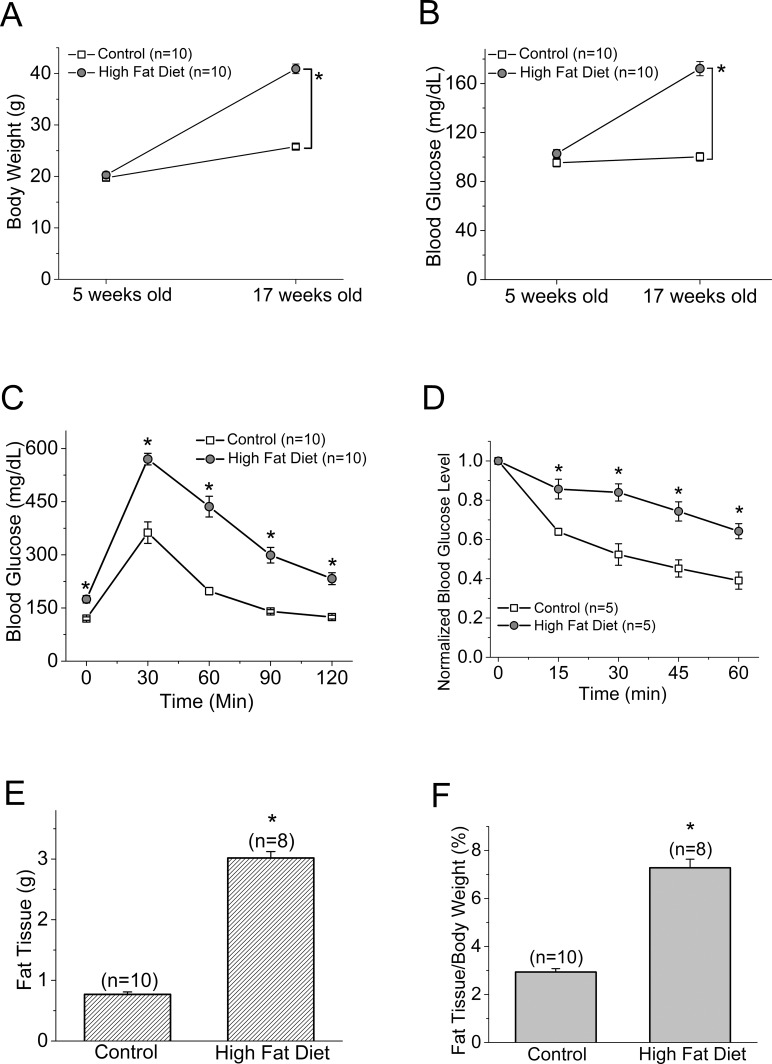
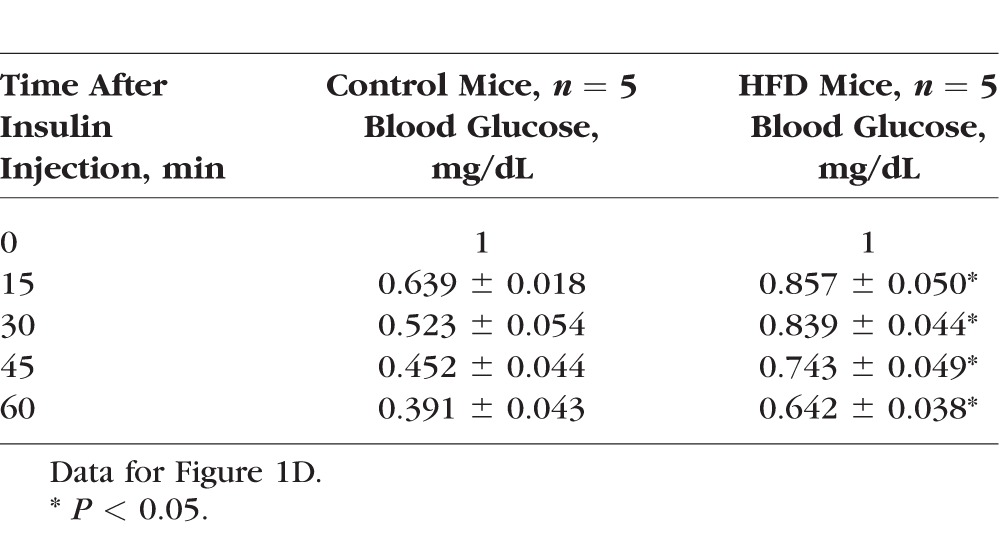
Mice starting at 5 weeks of age were fed with normal chow (controls) or HFD for 12 weeks. At the end of the 12th week, mice given HFD had almost twice the body weight of the controls (control: 25.79 ± 0.47 g, HFD: 40.89 ± 0.94 g; Fig. 1A). The average blood glucose level at the fasted state in HFD mice was 172.67 ± 5.79 mg/dL, while that of the control group was 102.77 ± 3.32 mg/dL (Fig. 1B). After being fasted for 8 hours, mice received a single injection of d-glucose (2 g/kg body weight) for the glucose tolerance test. The HFD mice displayed significantly higher blood glucose levels throughout the 120-minute course of testing than the controls (Fig. 1C; Table 1). When the fasted mice were injected with a single dose of insulin and monitored for blood glucose levels at various time points, the HFD mice displayed blunted insulin responses compared to the controls with respect to the decreasing blood glucose levels (Fig. 1D; Table 2). These observations were concomitant with significantly increased fat deposition in the visceral fat tissues of HFD mice compared to the controls (Figs. 1E, 1F). Taken together, these results confirmed that 12 weeks of HFD feeding induced obesity in association with prediabetic/early diabetic conditions including hyperglycemia and insulin resistance.
Figure 1.
The body weight and blood glucose level are higher in the HFD mice than the controls. Male mice starting at 5 weeks of age were fed normal chow (controls) or HFD for 12 weeks. Body weight (A) and blood glucose (B) were monitored periodically. Data from (A) and (B) were from the same batch of mice (including both control and HFD mice). The glucose tolerance test (C) and insulin tolerance test (D) were performed at the end of the 12-week feeding regimen. The glucose tolerance and insulin tolerance tests were performed on two different batches of mice, and these mice were also different from (A) and (B). (E) The average visceral fat tissue from both groups is shown (in grams). Control (n = 10): 0.77 ± 0.039 g; HFD (n = 8): 3.02 ± 0.106 g. (F) The adiposity calculated by the ratio of visceral fat tissue to body weight from both groups is shown (in percentage). Control (n = 10): 2.94% ± 0.14%; HFD (n = 8): 7.28% ± 0.36%. The asterisk (*) indicates that there is a statistically significant difference between the control and the HFD group. *P < 0.05.
Table 1.
The Glucose Tolerance Test
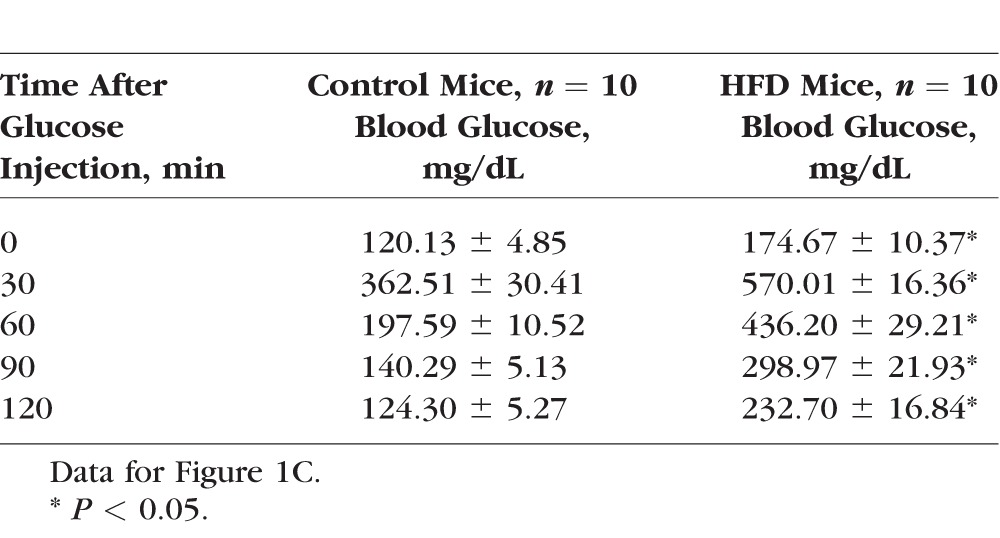
Table 2.
The Insulin Tolerance Test
The Retinal Light Responses Were Changed in HFD Mice
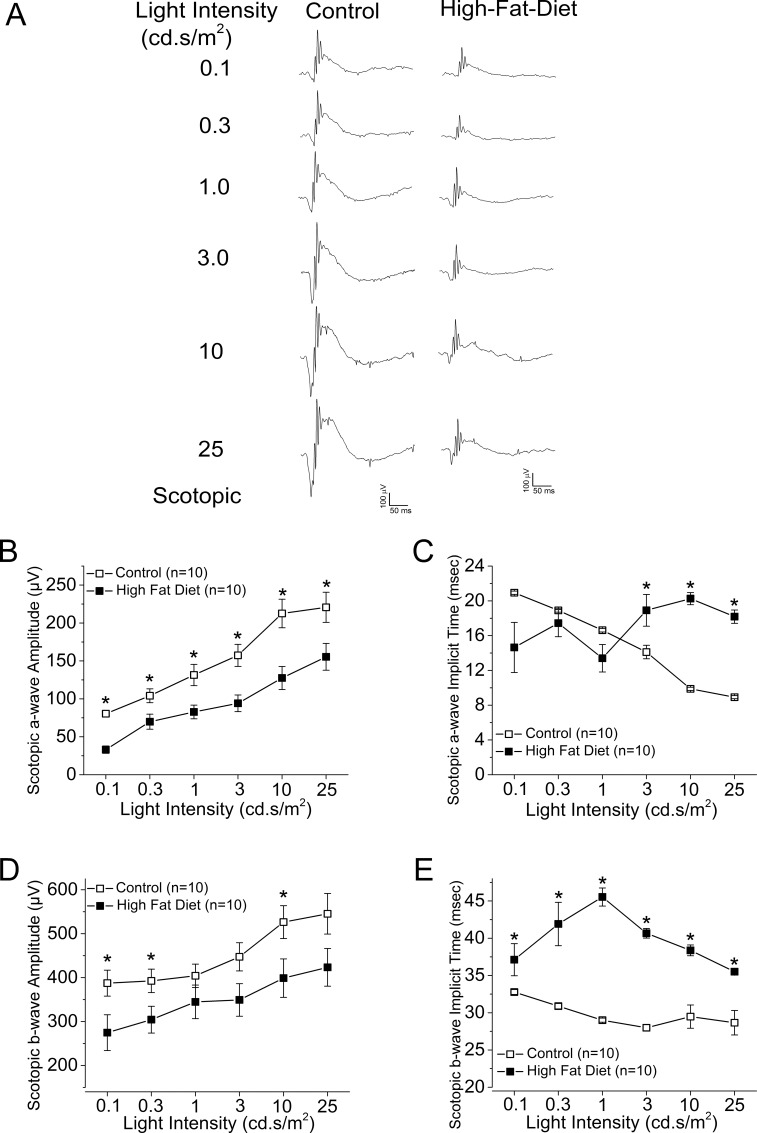
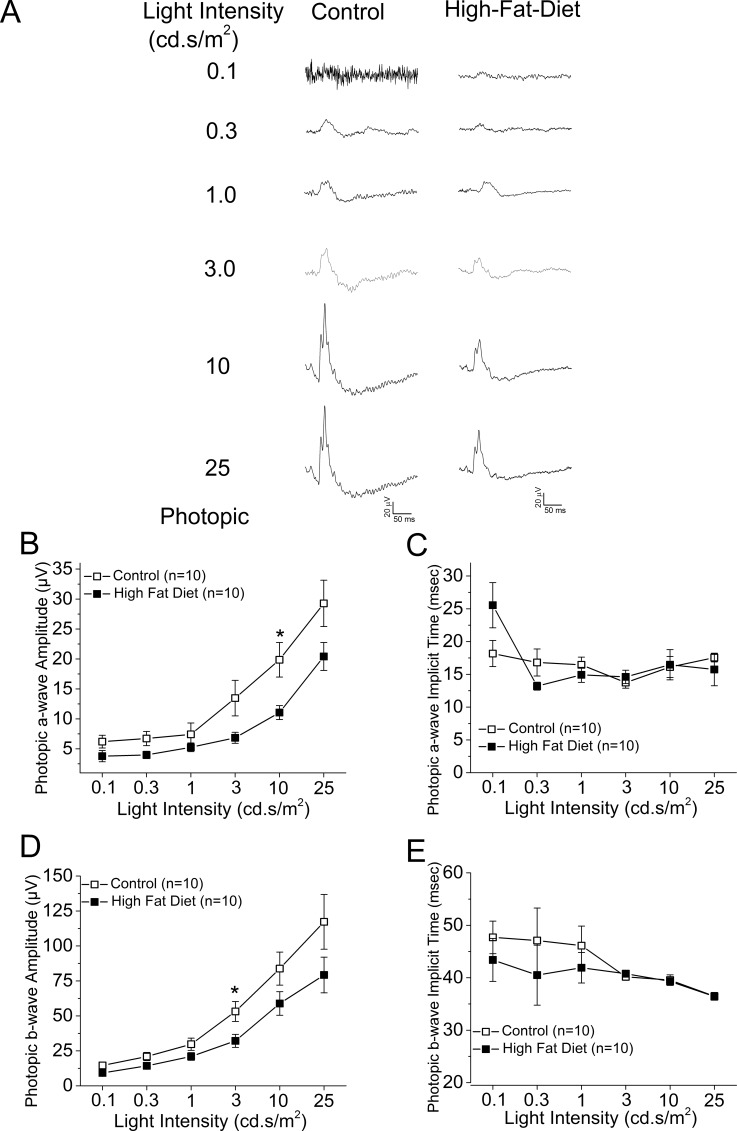
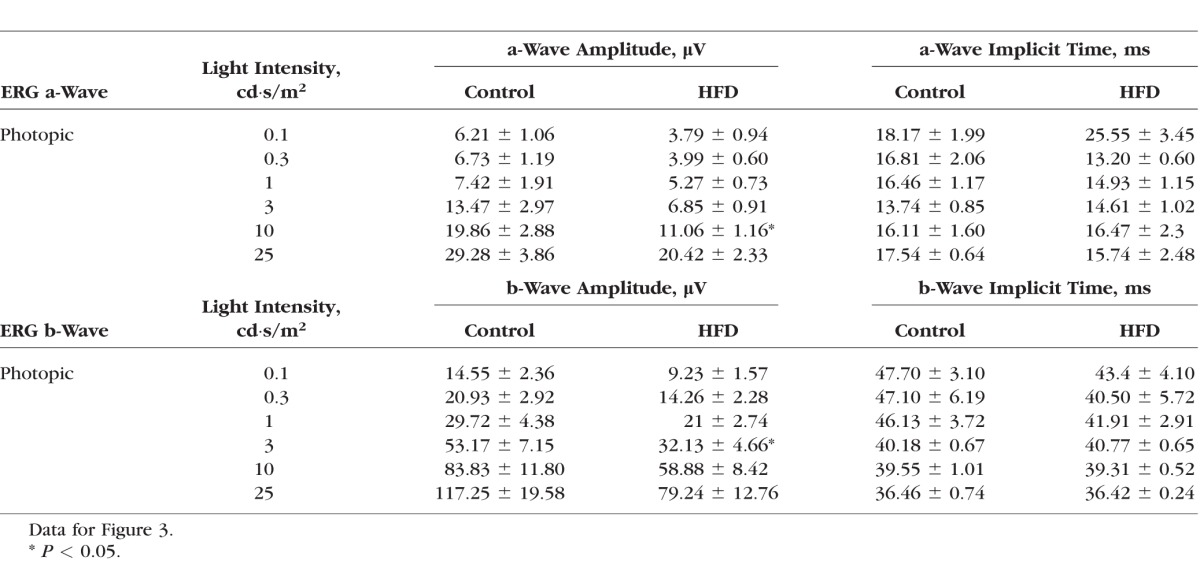
We examined the overall retinal light responses in these obese and hyperglycemic mice by using ERG recordings. Mice were dark adapted for at least 6 hours before scotopic testing. At lower light intensities, the retinal light responses were mainly rod-pathway driven, while at higher light intensities, the retinal light responses were a mixture from rods and cones. Throughout the series of varying light-intensity stimulations (Fig. 2A), the average ERG a-wave amplitudes of the controls were significantly higher than those of the HFD mice (Fig. 2B), and the a-wave implicit time from the control was shorter than that from the HFD mice at higher light-intensity stimulations (Fig. 2C). Similar results were seen for the ERG b-waves (Figs. 2D, 2E). These data (Table 3) reflected the fact that under dark-adapted conditions, the photoreceptor light responses are altered; the photoreceptor-to-bipolar cell synaptic responses, as well as the bipolar responses, were significantly compromised and delayed in these obese and hyperglycemic mice. We next examined the overall retinal light responses under light-adapted conditions. Mice were light adapted to 30 cd·s/m2 background light for 10 minutes, followed by exposure to various light-intensity stimulations. Under these conditions, the retinal responses were mainly cone driven. Throughout the series of different light-intensity stimulations (Fig. 3A), the retinas of HFD mice had weaker light responses than the controls (Figs. 3B, 3D), even though the implicit times were similar (Figs. 3C, 3E). These data (Table 4) showed that under light-adapted conditions, the retinal light responses were also compromised in HFD mice.
Figure 2.
The ERG scotopic light responses are decreased in the HFD mice. All mice were dark adapted for at least 6 hours. The ERGs were recorded to measure the retinal responses when mice were exposed to a series of light intensities from 0.1 to 25 cd·s/m2. (A) Representative ERG waveforms recorded from control (left) and HFD (right) mouse eyes in response to the stimulating light intensities. (B) The average ERG a-wave amplitudes recorded from the control are higher than the ones recorded from the HFD mice. (C) The average ERG a-wave implicit time is different between the control and the HFD mice. (D) The average ERG b-wave amplitudes recorded from the control are higher than the ones recorded from the HFD mice. (E) The average ERG b-wave implicit time recorded from the HFD mice is higher than the ones recorded from the control. The asterisk (*) indicates that there is a statistically significant difference between the control and the HFD group. *P < 0.05.
Table 3.
Dark-Adapted (Scotopic) Retinal Light Responses
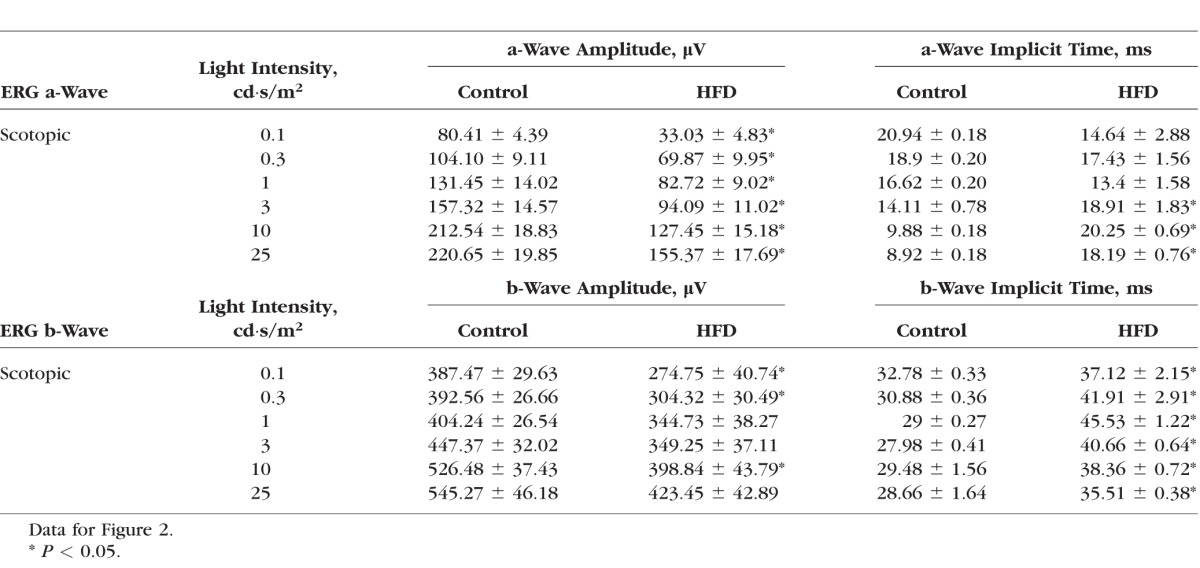
Figure 3.
The ERG photopic light responses are decreased in the HFD mice. All mice were first adapted to the background light at 30 cd·s/m2 for 10 minutes, followed by exposure to a series of light stimulations from 0.1 to 25 cd·s/m2 with 32 flashes (0.5-second interval) at each light intensity. (A) Representative ERG waveforms recorded from control (left) and HFD (right) mouse eyes in response to the stimulating light intensities. (B) The average ERG a-wave amplitudes recorded from the control are higher than the ones recorded from the HFD mice. (C) There is no statistical difference for the average ERG a-wave implicit time at each light intensity between the control and the HFD mice. (D) The average ERG b-wave amplitudes recorded from the control are higher than the ones recorded from the HFD mice. (E) There is no statistical difference for the average ERG b-wave implicit time at each light intensity between the control and the HFD mice. The asterisk (*) indicates that there is a statistically significant difference between the control and the HFD group. *P < 0.05.
Table 4.
Light-Adapted (Photopic) Retinal Light Responses
The Biochemical Profiles Were Changed in HFD Mice
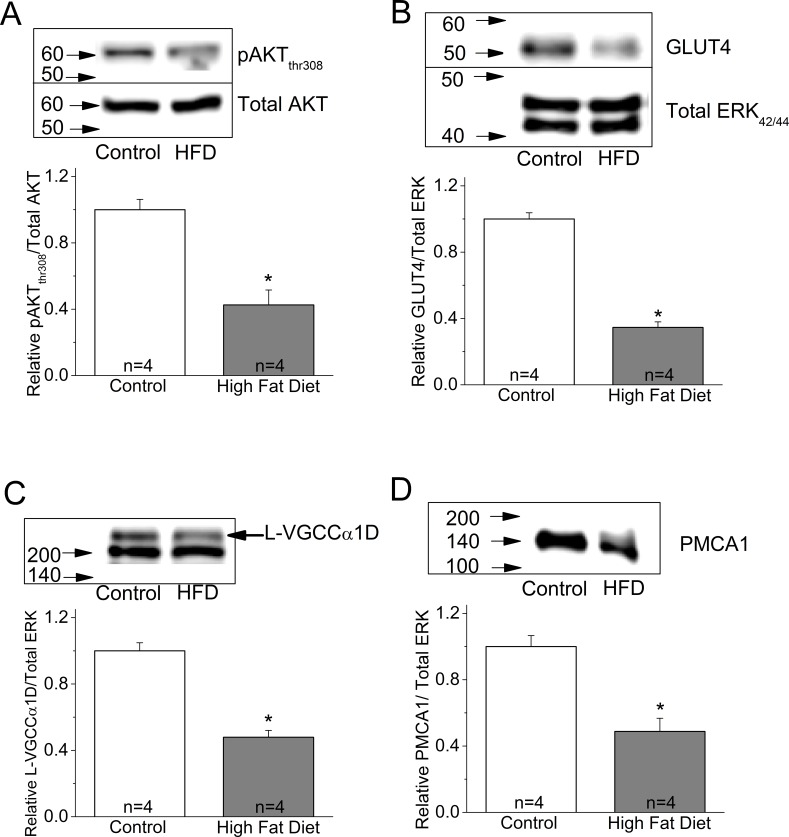
One major insulin-activated signaling pathway is the phosphoinositide 3 kinase–protein kinase B (PI3K-AKT) pathway, which is essential for cell metabolism and survival.50,51 Activation of AKT requires a multistep process that includes phosphorylation of Thr308 in the kinase domain and Ser473 within the regulatory domain.52 Activated PI3K-AKT signaling mediates intracellular glucose transporter (GLUT) trafficking to the plasma membrane, and GLUT further facilitates cellular glucose intake.53–55 Since glucose is the major energy source for neurons in the retina and brain,56–59 PI3K-AKT–mediated GLUT trafficking is essential for neuron survival. We found that the phosphorylated AKT at Thr308 (pAKTthr308), as well as GLUT4, the major retinal glucose transporter, were significantly decreased in the whole retinal lysates from HFD mice (Figs. 4A, 4B).
Figure 4.
The expression of several proteins is decreased in the retina of HFD mice. Mouse retinas were harvested and subjected to Western immunoblot analyses of (A) phosphorylated AKT at Thr308 (pAKTthr308), control: 1 ± 0.062, HFD: 0.426 ± 0.089; (B) GLUT4, control: 1 ± 0.037, HFD: 0.346 ± 0.033; (C) L-VGCCα1D, control: 1 ± 0.049, HFD: 0.479 ± 0.041; and (D) PMCA1, control: 1 ± 0.066, HFD: 0.488 ± 0.079. The protein levels of all four are significantly decreased in the retina of HFD mice. Each group contains retinas from four mice (n = 4). Results in (B) and (C) were from the same batch of mice (including control and HFD), but results in (A) and (D) were from different batches of mice. *P < 0.05.
Our ERG results (Figs. 2, 3) showed that both a- and b-wave retinal light responses were decreased in HFD mice, which indicated that the photoreceptor, bipolar cell, and the photoreceptor-to-bipolar cell synaptic responses were all compromised in the retina of these mice. Potentially, the machinery mediating the Ca2+-dependent synaptic transmission from photoreceptors to bipolar cells was down-regulated in the retina of obese and hyperglycemic mice. Both L-VGCCs and PMCA1 are key players of calcium homeostasis in retinal neurons and are mediators of Ca2+-dependent synaptic transmission at the synapses between photoreceptors and bipolar cells, as well as bipolar cells and ganglion cells.18,20,21,37,38 We found that both the pore-forming α1 subunit of L-VGCCs, L-VGCCα1D, and PMCA1 were decreased in the whole retinal lysates prepared from HFD mice (Figs. 4C, 4D). These biochemical data led us to further examine the potential changes in the morphologic distribution of these molecules.
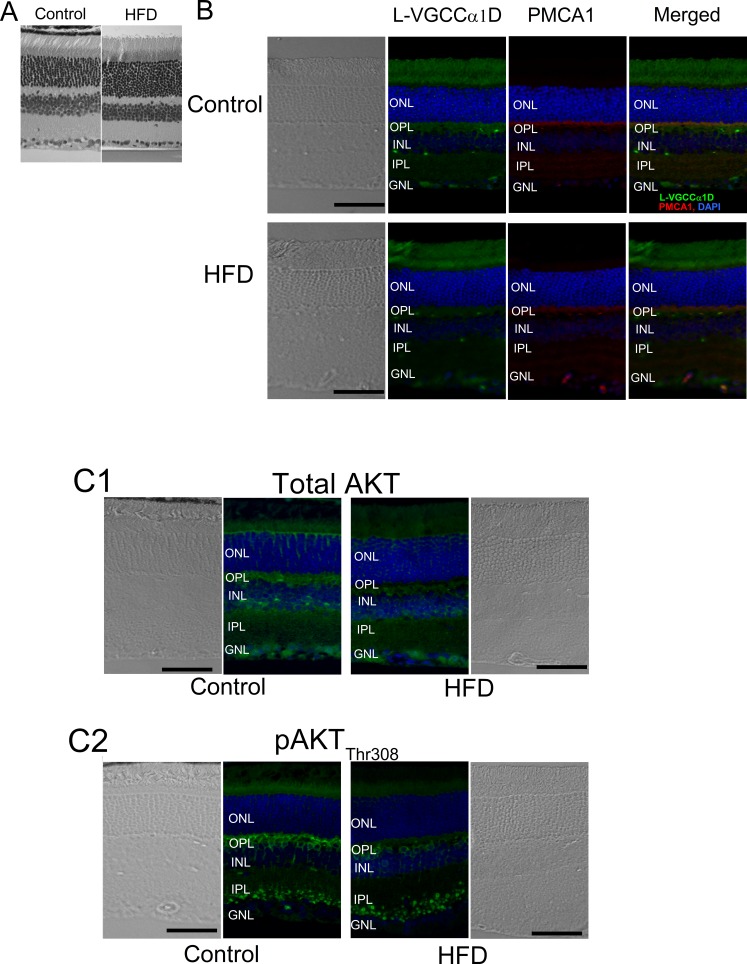
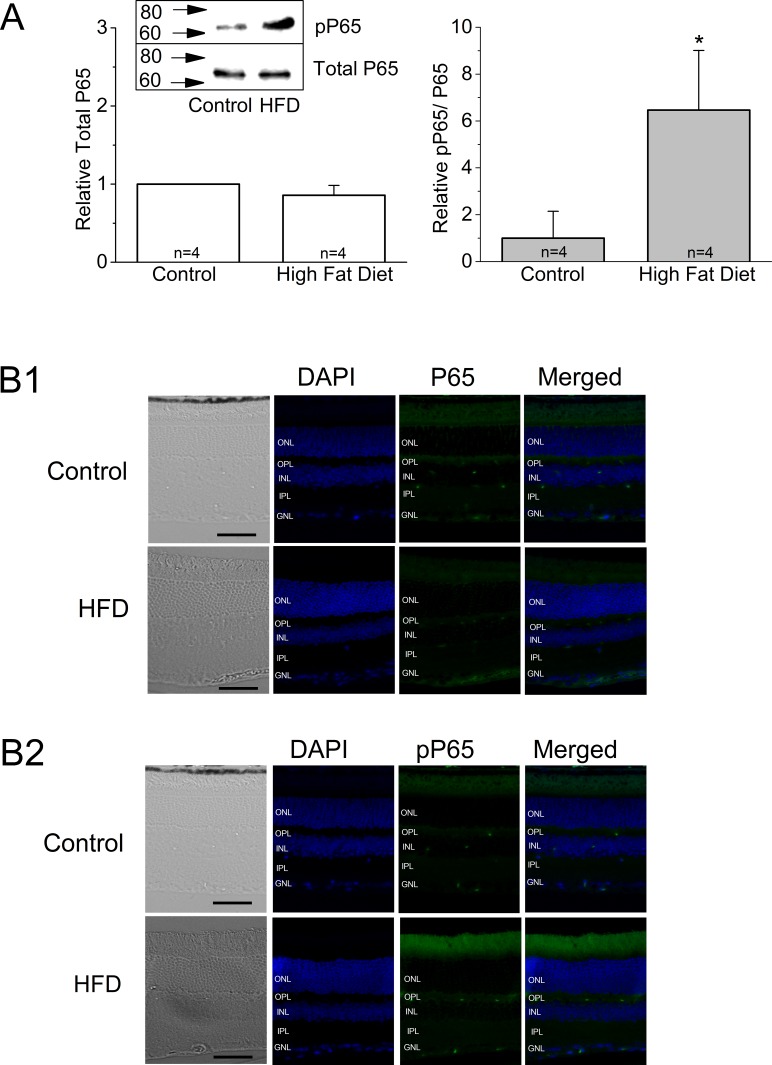
Even though there was no noticeable difference in the overall thickness and general morphology between the control and HFD mouse retinas (Fig. 5A), the fluorescent intensities of L-VGCCα1D and PMCA1 labeled at the synaptic layers, the outer plexiform layer (OPL), and the inner plexiform layer (IPL) were dampened in the retina of HFD mice (Fig. 5B). The expression of total AKT and pAKTthr308 were also deceased in the HFD mouse retina (Fig. 5C). Furthermore, HFD mouse retinas showed increased inflammation denoted by increased fluorescent staining with pP65 antibody (Fig. 6B), as well as increased pP65 protein levels in Western blots (Fig. 6A). P65 is a subunit of NF-κB, and pP65 is a biomarker for inflammation.60 Hence, in HFD mice, not only did the retina show signs of inflammation, but also the PI3K-AKT signaling, GLUT4, and the players of calcium homeostasis were all compromised.
Figure 5.
The immunofluorescent intensities of several proteins are altered in the retina of HFD mice. Mouse retinal sections (4 μm) were processed for immunofluorescence staining. (A) There is no significant difference in overall morphology between the control and HFD mouse retina with hematoxylin and eosin (H&E) staining. (B) The fluorescent intensities of L-VGCCα1D and PMCA1are dampened in the retina of HFD mice. Green: L-VGCCα1D. Red: PMCA1. Blue: DAPI. (C) Total AKT (C1), and pAKTthr308 (C2) are also dampened in the retina of HFD mice. Blue: DAPI. Green: Total AKT (C1) or pAKTthr308 (C2). Scale bars: 50 μm. GCL, ganglion cell layer; INL, inner nuclear layer; ONL, outer nuclear layer.
Figure 6.
The HFD mouse retinas show signs of inflammation. (A) Mouse retinas were harvested and subjected to Western immunoblot analyses of total P65 and phosphorylated P65 (pP65). There is no statistical difference between the control and HFD on total P65. Left: Total P65, control: 1 ± 0, HFD: 0.86 ± 0.13. Right: pP65, control: 1 ± 1.14, HFD: 6.46 ± 2.54. Each group contains retinas from four different mice (n = 4); *P < 0.05. (B1–B2) Mouse retinal sections (4 μm) were processed for immunofluorescence staining. (B1) The total P65 is weakly stained in both control and HFD mouse retinas. (B2) The pP65 is more intensely present in the retina of the HFD mouse. Scale bars: 50 μm. Green: P65 (B1) or pP65 (B2). Blue: DAPI.
The Expression of L-VGCCα1D, PMCA1, and pAKTthr308 Were All Decreased in the Human DR Retina
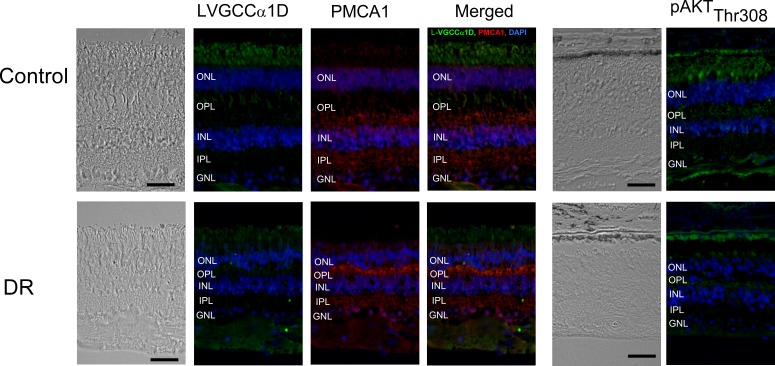
To verify whether our finding from the retina of HFD mice was potentially applicable to human diabetic patients, we obtained human retina tissue sections from patients with DR and the age-appropriate non-DR controls (all specimens were from people at least 79 years of age). All layers of the neural retinas from the DR patients were significantly thinner than the controls, indicating that the retinal degeneration due to DR was more prominent than that due to aging (Fig. 7). We found that the fluorescent intensities of L-VGCCα1D, PMCA1, and pAKTthr308 were dampened in the neural DR retina excluding the abnormal vascular sites. The results from human DR retinas echoed our findings in the HFD mouse retina.
Figure 7.
The immunofluorescent intensities of several proteins are altered in the retina of human DR patients. The human retinal sections (∼12 μm) of DR patients and the age-appropriate controls were obtained from NDRI. Top: Retinal sections from the control. Bottom: Retinal sections from the DR patients. The overall thickness of the neural retina from DR patients is decreased compared to the age-appropriate control. The fluorescent intensities of L-VGCCα1D, PMCA1, and pAKTthr308 are dampened in the DR retina. Scale bars: 50 μm.
Discussion
In this report, we used a diet-induced obesity mouse model to examine the impact of prediabetic/early diabetic conditions on retinal physiology and function. The HFD-induced obese mice were chronically insulin resistant with significantly increased adiposity, compared to control mice fed on a normal chow diet. Their systemic glucose levels were significantly higher than those of the controls. In these obese mice, retinal light sensitivities were diminished as measured by ERGs. Both ERG a- and b-waves under scotopic and photopic conditions were decreased in HFD retina, which reflected the fact that photoreceptor function, as well as synaptic transmission from photoreceptors to bipolar cells, were affected under HFD-induced hyperglycemia. We also found that L-VGCCα1D and PMCA1 were decreased in HFD retina. This is the first report on changes of L-VGCCs and PMCA1 in the neural retina from obesity-induced prediabetic/early diabetic animals. Since L-VGCCs and PMCAs are essential in synaptic transmission in the retina, the decrease in L-VGCCα1D and PMCA1 contributed to the decreased retinal light responses as reflected by the decreased a- and b-waves of ERGs.
In addition, the activation of AKT (phosphorylated AKT) was significantly reduced in HFD retina. Not only is PI3K-AKT important for insulin signaling, it is also critical for ion channel trafficking from cytosol to plasma membrane.61–66 We62,67,68 and others have demonstrated that the PI3K-AKT signaling network regulates the translocation of L-VGCCs from the cytosol to the plasma membrane in cone photoreceptors,62,67,68 cardiomyocytes,69 and COS cells.66 Inhibition of PI3K-AKT activation disrupts L-VGCCα1 subunit trafficking and insertion into the plasma membrane of photoreceptors, decreases L-VGCC currents, and impairs Ca2+ homeostasis.62,67,68 The major glucose transporter GLUT4 in the retina was decreased in HFD mice. This observation was similar to that of others noting a decrease of GLUT in other tissues.54 PI3K-AKT signaling is responsible for GLUT trafficking from the cytosol to the plasma membrane in an insulin-dependent manner.53–55,70,71 Hence, we postulate that under HFD-induced prediabetic/early diabetic conditions, a decrease in pAKT might lead to a decrease in L-VGCCs and GLUT4. This causal-response relationship between AKT and L-VGCC/GLUT4 under obesity-induced prediabetic/early diabetic conditions in the retina would require further investigation.
In the retina, neuronal glucose intake mostly follows the changes in systemic glycemia.40,41 In our HFD animals, even though average blood glucose levels did not exceed 200 mg/dL, which is the blood glucose level associated with diabetes in animal models,72,73 their systemic glycemia was significantly higher than that of controls. These HFD animals also developed chronic insulin resistance with high adiposity, which might well mimic the condition of obese and prediabetic/early diabetic humans. Under such prediabetic/early diabetic conditions, we have already observed decreases in L-VGCCs and PMCAs, the two essential elements in regulating Ca2+ homeostasis of retinal neurons. The L-VGCCs are responsible for neurotransmitter release at the synaptic terminals of several retinal neurons, including photoreceptors and bipolar cells.18,20,21 Both PMCA and L-VGCCs are known to colocalize at the photoreceptor synaptic terminals37,38 with PMCA extruding excess Ca2+. Hyperglycemia and the increase in advanced glycosylation end products in obesity are known to cause aberrant calcium homeostasis in neurons, which might be a cellular mechanism contributing to diabetic neuropathy. Membrane depolarization–induced Ca2+ influx and Ca2+ loading in intracellular ER Ca2+ stores are severely impaired in diabetic neurons.11,74 Density of calcium channels is increased in the diabetic dorsal root ganglion neurons.75 The activity of the Na+–Ca2+ exchanger76,77 and PMCA are decreased, leading to a net calcium overload, which has an adverse effect on cellular functions.78 Reduced PMCA function followed by increased intracellular Ca2+ is observed in erythrocytes, cardiomyocytes, platelets, hepatocytes, adipocytes, osteoblasts, and peripheral nerves from animal models of diabetes.79,80 In addition, chronic hyperglycemia inhibits synaptic PMCA activities in the brain.79
However, in HFD retinas, we observed the down-regulation of L-VGCCs and PMCAs from the whole retina preparations, which is different from the observations for diabetic neuropathy or diabetic cardiomyopathy mentioned above. We also observed a decrease of GLUT4 in the photoreceptors and retinal neurons in HFD retinas. Reduced GLUT4 suggests that the retina might take up less glucose under such hyperglycemic conditions, while down-regulation of L-VGCCs and PMCAs might be the cause of decreased retinal ERG light responses and neuronal activities. The decrease of GLUT4 could result in cellular energy failure, so the down-regulation of L-VGCCs and PMCA might represent an adaptation to the low energy condition of retinal photoreceptors and neurons. It is also possible that the down-regulation of L-VGCCs, PMCAs, and GLUT4 could be a survival strategy of neural retina to delay the onset of DR, which could explain why DR occurs mostly years after the diagnosis of type 2 diabetes.
Oxidative stress is considered a major contributor to DR. In the retina, hyperglycemic conditions cause oxidative stress through overproduction of reactive oxygen species (ROS) or superoxide from the mitochondria, and increased superoxide further impairs glucose metabolism.81–84 Hyperglycemia-induced ROS causes translocation of NF-κB to the nucleus and further activates the production of many inflammatory cytokines.84,85 Hence, antioxidants and anti-inflammatory treatments have been sought after as treatments for DR.82,83,86 P65 is a subunit of NF-κB complex, and once phosphorylated and activated, pP65 acts as a transcriptional factor and facilitates the production of preinflammatory cytokines.60 We observed that in HFD retinas, there was an increase in pP65. This result implies that oxidative stress–induced inflammation might have already occurred in the prediabetic/early diabetic retina. Thus, oxidative stress–induced inflammation might contribute to impairment of cellular calcium homeostasis and further cause decreased retinal light sensitivities. Alternatively, both oxidative stress–induced inflammation and the down-regulation of PI3K-AKT leading to impairment of intracellular calcium homeostasis occur concurrently in prediabetic/early diabetic retina. It is our great interest for future investigation to determine the potential links between oxidative stress and intracellular calcium homeostasis.
In summary, HFD-induced prediabetic/early diabetic conditions caused a decrease in retinal light responses as measured by ERGs. PI3K-AKT signaling, L-VGCCs, and PMCA1 were down-regulated in obesity-induced prediabetic/early diabetic retinas, as well as in human DR retinas, suggesting that down-regulation of PI3K-AKT and impaired calcium homeostasis might contribute to the etiology of DR. In part, the decreased ERG responses could be a reflection of reduced L-VGCCα1 and PMCA1. Currently, there is no effective treatment to reverse the retinal degeneration of DR. In this study, we correlated the ERG abnormalities with impaired calcium homeostasis in obesity-induced prediabetic/early diabetic retina. Since PI3K-AKT signaling is important in regulating L-VGCCs and PMCA, we postulate that activation of PI3K-AKT signaling in early diabetes or in the prediabetic stage might be able to prevent the impairment of calcium homeostasis, stop retinal degeneration, and become a potential treatment for DR.
Acknowledgments
We thank Chaodong Wu, MD, PhD, for fruitful comments.
Supported by 1-13-JF-59 from the American Diabetes Association; National Institutes of Health (NIH) Grant R01DK098662 from the National Institute of Diabetes and Digestive and Kidney Diseases (BZ); and NIH Grants R01EY017452 and R21EY023339 from the National Eye Institute (GY-PK).
Disclosure: R.C.-A. Chang, None; L. Shi, None; C.C.-Y. Huang, None; A.J. Kim, None; M.L. Ko, None; B. Zhou, None; G.Y.-P. Ko, None
References
- 1.Kaul K,, Tarr JM,, Ahmad SI,, Kohner EM,, Chibber R.Introduction to diabetes mellitus. Adv Exp Med Biol. 2012; 771: 1–11. [DOI] [PubMed] [Google Scholar]
- 2.Ola MS,, Nawaz MI,, Siddiquei MM,, Al-Amro S,Abu El-Asrar AM. Recent advances in understanding the biochemical and molecular mechanism of diabetic retinopathy. J Diabetes Complications. 2012; 26: 56–64. [DOI] [PubMed] [Google Scholar]
- 3.Wong TY, Klein R, Islam FM, et al. . Diabetic retinopathy in a multi-ethnic cohort in the United States. Am J Ophthalmol. 2006; 141: 446–455. [DOI] [PMC free article] [PubMed] [Google Scholar]
- 4.Cunha-Vaz J,, Ribeiro L,, Lobo C.Phenotypes and biomarkers of diabetic retinopathy. Prog Retin Eye Res. 2014; 41: 90–111. [DOI] [PubMed] [Google Scholar]
- 5.Fong DS,, Aiello LP,, Ferris FL III., Klein R.Diabetic retinopathy. Diabetes Care. 2004; 27: 2540–2553. [DOI] [PubMed] [Google Scholar]
- 6.Alvarez Y,, Chen K,, Reynolds AL,, Waghorne N,, O'Connor JJ,, Kennedy BN.Predominant cone photoreceptor dysfunction in a hyperglycaemic model of non-proliferative diabetic retinopathy. Dis Model Mech. 2010; 3: 236–245. [DOI] [PubMed] [Google Scholar]
- 7.Harrison WW, Bearse MA Jr, Ng JS, et al. . Multifocal electroretinograms predict onset of diabetic retinopathy in adult patients with diabetes. Invest Ophthalmol Vis Sci. 2011; 52: 772–777. [DOI] [PMC free article] [PubMed] [Google Scholar]
- 8.Barber AJ,, Lieth E,, Khin SA,, Antonetti DA,, Buchanan AG,, Gardner TW.Neural apoptosis in the retina during experimental and human diabetes: early onset and effect of insulin. J Clin Invest. 1998; 102: 783–791. [DOI] [PMC free article] [PubMed] [Google Scholar]
- 9.Feitosa-Santana C, Oiwa NN, Paramei GV, et al. . Color space distortions in patients with type 2 diabetes mellitus. Vis Neurosci. 2006; 23: 663–668. [DOI] [PubMed] [Google Scholar]
- 10.O'Neill-Biba M,, Sivaprasad S,, Rodriguez-Carmona M,, Wolf JE,, Barbur JL.Loss of chromatic sensitivity in AMD and diabetes: a comparative study. Ophthalmic Physiol Opt. 2010; 30: 705–716. [DOI] [PubMed] [Google Scholar]
- 11.Fernyhough P,, Calcutt NA.Abnormal calcium homeostasis in peripheral neuropathies. Cell Calcium. 2010; 47: 130–139. [DOI] [PMC free article] [PubMed] [Google Scholar]
- 12.Kinukawa J,, Shimura M,, Harata N,, Tamai M.Gliclazide attenuates the intracellular Ca2+ changes induced in vitro by ischemia in the retinal slices of rats with streptozotocin-induced diabetes. Curr Eye Res. 2005; 30: 789–798. [DOI] [PubMed] [Google Scholar]
- 13.Costa G,, Pereira T,, Neto AM,, Cristovao AJ,, Ambrosio AF,, Santos PF.High glucose changes extracellular adenosine triphosphate levels in rat retinal cultures. J Neurosci Res. 2009; 87: 1375–1380. [DOI] [PubMed] [Google Scholar]
- 14.Santiago AR,, Rosa SC,, Santos PF,, Cristovao AJ,, Barber AJ,, Ambrosio AF.Elevated glucose changes the expression of ionotropic glutamate receptor subunits and impairs calcium homeostasis in retinal neural cells. Invest Ophthalmol Vis Sci. 2006; 47: 4130–4137. [DOI] [PubMed] [Google Scholar]
- 15.Zundorf G,, Reiser G.Calcium dysregulation and homeostasis of neural calcium in the molecular mechanisms of neurodegenerative diseases provide multiple targets for neuroprotection. Antioxid Redox Signal. 2011; 14: 1275–1288. [DOI] [PMC free article] [PubMed] [Google Scholar]
- 16.He L,, Poblenz AT,, Medrano CJ,, Fox DA.Lead and calcium produce rod photoreceptor cell apoptosis by opening the mitochondrial permeability transition pore. J Biol Chem. 2000; 275: 12175–12184. [DOI] [PubMed] [Google Scholar]
- 17.Edward DP,, Lam TT,, Shahinfar S,, Li J,, Tso MO.Amelioration of light-induced retinal degeneration by a calcium overload blocker: flunarizine. Arch Ophthalmol. 1991; 109: 554–562. [DOI] [PubMed] [Google Scholar]
- 18.Krizaj D.Calcium stores in vertebrate photoreceptors. Adv Exp Med Biol. 2012; 740: 873–889. [DOI] [PMC free article] [PubMed] [Google Scholar]
- 19.Krizaj D,, Copenhagen DR.Compartmentalization of calcium extrusion mechanisms in the outer and inner segments of photoreceptors. Neuron. 1998; 21: 249–256. [DOI] [PMC free article] [PubMed] [Google Scholar]
- 20.Barnes S,, Jacklet JW.Ionic currents of isolated retinal pacemaker neurons: projected daily phase differences and selective enhancement by a phase-shifting neurotransmitter. J Neurophysiol. 1997; 77: 3075–3084. [DOI] [PubMed] [Google Scholar]
- 21.Szikra T, Barabas P, Bartoletti TM, et al. . Calcium homeostasis and cone signaling are regulated by interactions between calcium stores and plasma membrane ion channels. PLoS One. 2009; 4: e6723. [DOI] [PMC free article] [PubMed] [Google Scholar]
- 22.Bech-Hansen NT, Naylor MJ, Maybaum TA, et al. . Loss-of-function mutations in a calcium-channel alpha1-subunit gene in Xp11.23 cause incomplete X-linked congenital stationary night blindness. Nat Genet. 1998; 19: 264–267. [DOI] [PubMed] [Google Scholar]
- 23.Miyake Y,, Yagasaki K,, Horiguchi M,, Kawase Y,, Kanda T.Congenital stationary night blindness with negative electroretinogra: a new classification. Arch Ophthalmol. 1986; 104: 1013–1020. [DOI] [PubMed] [Google Scholar]
- 24.Morgans CW,, Bayley PR,, Oesch NW,, Ren G,, Akileswaran L,, Taylor WR.Photoreceptor calcium channels: insight from night blindness. Vis Neurosci. 2005; 22: 561–568. [DOI] [PubMed] [Google Scholar]
- 25.Strom TM, Nyakatura G, Apfelstedt-Sylla E, et al. . An L-type calcium-channel gene mutated in incomplete X-linked congenital stationary night blindness. Nat Genet. 1998; 19: 260–263. [DOI] [PubMed] [Google Scholar]
- 26.Sancho-Pelluz J, Arango-Gonzalez B, Kustermann S, et al. . Photoreceptor cell death mechanisms in inherited retinal degeneration. Mol Neurobiol. 2008; 38: 253–269. [DOI] [PubMed] [Google Scholar]
- 27.Barabas P,Cutler Peck C, Krizaj D. Do calcium channel blockers rescue dying photoreceptors in the Pde6b (rd1) mouse? Adv Exp Med Biol. 2010; 664: 491–499. [DOI] [PMC free article] [PubMed] [Google Scholar]
- 28.Krizaj D,, Copenhagen DR.Calcium regulation in photoreceptors. Front Biosci. 2002; 7: d2023–d2044. [DOI] [PMC free article] [PubMed] [Google Scholar]
- 29.Szikra T,, Krizaj D.Intracellular organelles and calcium homeostasis in rods and cones. Vis Neurosci. 2007; 24: 733–743. [DOI] [PMC free article] [PubMed] [Google Scholar]
- 30.Jian K,, Barhoumi R,, Ko ML,, Ko GY.Inhibitory effect of somatostatin-14 on L-type voltage-gated calcium channels in cultured cone photoreceptors requires intracellular calcium. J Neurophysiol. 2009; 102: 1801–1810. [DOI] [PMC free article] [PubMed] [Google Scholar]
- 31.Brehm P,, Eckert R.Calcium entry leads to inactivation of calcium channel in Paramecium. Science. 1978; 202: 1203–1206. [DOI] [PubMed] [Google Scholar]
- 32.Peterson BZ,, DeMaria CD,, Adelman JP,, Yue DT.Calmodulin is the Ca2+ sensor for Ca2+-dependent inactivation of L-type calcium channels. Neuron. 1999; 22: 549–558. [DOI] [PubMed] [Google Scholar]
- 33.Fischer MJ,, Paulussen JJ,, de Mol NJ,, Janssen LH.Dual effect of the anti-allergic astemizole on Ca2+ fluxes in rat basophilic leukemia (RBL-2H3) cells: release of Ca2+ from intracellular stores and inhibition of Ca2+ release-activated Ca2+ influx. Biochem Pharmacol. 1998; 55: 1255–1262. [DOI] [PubMed] [Google Scholar]
- 34.Mohr FC,, Alojipan SV,, Dunston SK,, Pessah IN.The delta isomer of hexachlorocyclohexane induces rapid release of the myo-inositol-1,4,5-trisphosphate-sensitive Ca2+ store and blocks capacitative Ca2+ entry in rat basophilic leukemia cells. Mol Pharmacol. 1995; 48: 512–522. [PubMed] [Google Scholar]
- 35.Thayer SA,, Hirning LD,, Miller RJ.The role of caffeine-sensitive calcium stores in the regulation of the intracellular free calcium concentration in rat sympathetic neurons in vitro. Mol Pharmacol. 1988; 34: 664–673. [PubMed] [Google Scholar]
- 36.Carafoli E,, Stauffer T.The plasma membrane calcium pump: functional domains, regulation of the activity, and tissue specificity of isoform expression. J Neurobiol. 1994; 25: 312–324. [DOI] [PubMed] [Google Scholar]
- 37.Johnson JE Jr, Perkins GA, Giddabasappa A, et al. . Spatiotemporal regulation of ATP and Ca2+ dynamics in vertebrate rod and cone ribbon synapses. Mol Vis. 2007; 13: 887–919. [PMC free article] [PubMed] [Google Scholar]
- 38.Morgans CW,, El Far O,, Berntson A,, Wassle H,, Taylor WR.Calcium extrusion from mammalian photoreceptor terminals. J Neurosci. 1998; 18: 2467–2474. [DOI] [PMC free article] [PubMed] [Google Scholar]
- 39.Xing W,, Akopian A,, Krizaj D.Trafficking of presynaptic PMCA signaling complexes in mouse photoreceptors requires Cav1.4 alpha1 subunits. Adv Exp Med Biol. 2012; 723: 739–744. [DOI] [PMC free article] [PubMed] [Google Scholar]
- 40.Ola MS, Berkich DA, Xu Y, et al. . Analysis of glucose metabolism in diabetic rat retinas. Am J Physiol Endocrinol Metab. 2006; 290: E1057–E1067. [DOI] [PubMed] [Google Scholar]
- 41.Puchowicz MA, Xu K, Magness D, et al. . Comparison of glucose influx and blood flow in retina and brain of diabetic rats. J Cereb Blood Flow Metab. 2004; 24: 449–457. [DOI] [PubMed] [Google Scholar]
- 42.Engerman RL,, Kern TS.Experimental galactosemia produces diabetic-like retinopathy. Diabetes. 1984; 33: 97–100. [DOI] [PubMed] [Google Scholar]
- 43.Matsushita K, Fukumoto M, Kobayashi T, et al. . Diabetes-induced inhibition of voltage-dependent calcium channels in the retinal microvasculature: role of spermine. Invest Ophthalmol Vis Sci. 2010; 51: 5979–5990. [DOI] [PMC free article] [PubMed] [Google Scholar]
- 44.Wu C, Kang JE, Peng LJ, et al. . Enhancing hepatic glycolysis reduces obesity: differential effects on lipogenesis depend on site of glycolytic modulation. Cell Metab. 2005; 2: 131–140. [DOI] [PubMed] [Google Scholar]
- 45.Woo SL, Xu H, Li H, et al. . Metformin ameliorates hepatic steatosis and inflammation without altering adipose phenotype in diet-induced obesity. PLoS One. 2014; 9: e91111. [DOI] [PMC free article] [PubMed] [Google Scholar]
- 46.Huo Y, Guo X, Li H, et al. . Disruption of inducible 6-phosphofructo-2-kinase ameliorates diet-induced adiposity but exacerbates systemic insulin resistance and adipose tissue inflammatory response. J Biol Chem. 2010; 285: 3713–3721. [DOI] [PMC free article] [PubMed] [Google Scholar]
- 47.Guo X, Xu K, Zhang J, et al. . Involvement of inducible 6-phosphofructo-2-kinase in the anti-diabetic effect of peroxisome proliferator-activated receptor gamma activation in mice. J Biol Chem. 2010; 285: 23711–23720. [DOI] [PMC free article] [PubMed] [Google Scholar]
- 48.Ko ML,, Liu Y,, Dryer SE,, Ko GY.The expression of L-type voltage-gated calcium channels in retinal photoreceptors is under circadian control. J Neurochem. 2007; 103: 784–792. [DOI] [PMC free article] [PubMed] [Google Scholar]
- 49.Ko ML,, Shi L,, Ko GY.Circadian controls outweigh acute illumination effects on the activity of extracellular signal-regulated kinase (ERK) in the retina. Neurosci Lett. 2009; 451: 74–78. [DOI] [PMC free article] [PubMed] [Google Scholar]
- 50.Dilly AK,, Rajala RV.Insulin growth factor 1 receptor/PI3K/AKT survival pathway in outer segment membranes of rod photoreceptors. Invest Ophthalmol Vis Sci. 2008; 49: 4765–4773. [DOI] [PMC free article] [PubMed] [Google Scholar]
- 51.Li G,, Rajala A,, Wiechmann AF,, Anderson RE,, Rajala RV.Activation and membrane binding of retinal protein kinase Balpha/Akt1 is regulated through light-dependent generation of phosphoinositides. J Neurochem. 2008; 107: 1382–1397. [DOI] [PMC free article] [PubMed] [Google Scholar]
- 52.Fayard E,, Xue G,, Parcellier A,, Bozulic L,, Hemmings BA.Protein kinase B (PKB/Akt), a key mediator of the PI3K signaling pathway. Curr Top Microbiol Immunol. 2010; 346: 31–56. [DOI] [PubMed] [Google Scholar]
- 53.Chang L,, Chiang SH,, Saltiel AR.Insulin signaling and the regulation of glucose transport. Mol Med. 2004; 10: 65–71. [DOI] [PMC free article] [PubMed] [Google Scholar]
- 54.Le Marchand-Brustel Y,, Tanti JF,, Cormont M,, Ricort JM,, Gremeaux T,, Grillo S.From insulin receptor signalling to Glut 4 translocation abnormalities in obesity and insulin resistance. J Recept Signal Transduc Res. 1999; 19: 217–228. [DOI] [PubMed] [Google Scholar]
- 55.Rowland AF,, Fazakerley DJ,, James DE.Mapping insulin/GLUT4 circuitry. Traffic. 2011; 12: 672–681. [DOI] [PubMed] [Google Scholar]
- 56.Barros LF,, Deitmer JW.Glucose and lactate supply to the synapse. Brain Res Rev. 2010; 63: 149–159. [DOI] [PubMed] [Google Scholar]
- 57.Lopez L,, Sannita WG.Glucose availability and the electrophysiology of the human visual system. Clin Neurosci. 1997; 4: 336–340. [PubMed] [Google Scholar]
- 58.Thorens B.Brain glucose sensing and neural regulation of insulin and glucagon secretion. Diabetes Obes Metabol. 2011; 13(suppl 1): 82–88. [DOI] [PubMed] [Google Scholar]
- 59.Vannucci SJ,, Maher F,, Simpson IA.Glucose transporter proteins in brain: delivery of glucose to neurons and glia. Glia. 1997; 21: 2–21. [DOI] [PubMed] [Google Scholar]
- 60.Karin M,, Greten FR.NF-kappaB: linking inflammation and immunity to cancer development and progression. Nat Rev Immunol. 2005; 5: 749–759. [DOI] [PubMed] [Google Scholar]
- 61.Chae KS,, Martin-Caraballo M,, Anderson M,, Dryer SE.Akt activation is necessary for growth factor-induced trafficking of functional K(Ca) channels in developing parasympathetic neurons. J Neurophysiol. 2005; 93: 1174–1182. [DOI] [PubMed] [Google Scholar]
- 62.Ko ML,, Jian K,, Shi L,, Ko GY.Phosphatidylinositol 3 kinase-Akt signaling serves as a circadian output in the retina. J Neurochem. 2009; 108: 1607–1620. [DOI] [PMC free article] [PubMed] [Google Scholar]
- 63.Lhuillier L,, Dryer SE.Developmental regulation of neuronal K(Ca) channels by TGFbeta1: an essential role for PI3 kinase signaling and membrane insertion. J Neurophysiol. 2002; 88: 954–964. [DOI] [PubMed] [Google Scholar]
- 64.Macrez N, Mironneau C, Carricaburu V, et al. . Phosphoinositide 3-kinase isoforms selectively couple receptors to vascular L-type Ca(2+) channels. Circ Res. 2001; 89: 692–699. [DOI] [PubMed] [Google Scholar]
- 65.Sun H, Kerfant BG, Zhao D, et al. . Insulin-like growth factor-1 and PTEN deletion enhance cardiac L-type Ca2+ currents via increased PI3Kalpha/PKB signaling. Circ Res. 2006; 98: 1390–1397. [DOI] [PubMed] [Google Scholar]
- 66.Viard P, Butcher AJ, Halet G, et al. . PI3K promotes voltage-dependent calcium channel trafficking to the plasma membrane. Nature Neurosci. 2004; 7: 939–946. [DOI] [PubMed] [Google Scholar]
- 67.Huang CC,, Ko ML,, Ko GY.A new functional role for mechanistic/mammalian target of rapamycin complex 1 (mTORC1) in the circadian regulation of L-type voltage-gated calcium channels in avian cone photoreceptors. PLoS One. 2013; 8: e73315. [DOI] [PMC free article] [PubMed] [Google Scholar]
- 68.Huang CC,, Ko ML,, Vernikovskaya DI,, Ko GY.Calcineurin serves in the circadian output pathway to regulate the daily rhythm of L-type voltage-gated calcium channels in the retina. J Cell Biochem. 2012; 113: 911–922. [DOI] [PMC free article] [PubMed] [Google Scholar]
- 69.Ko ML,, Shi L,, Grushin K,, Nigussie F,, Ko GY.Circadian profiles in the embryonic chick heart: L-type voltage-gated calcium channels and signaling pathways. Chronobiol Int. 2010; 27: 1673–1696. [DOI] [PMC free article] [PubMed] [Google Scholar]
- 70.Hou JC,, Pessin JE.Ins (endocytosis) and outs (exocytosis) of GLUT4 trafficking. Curr Opin Cell Biol. 2007; 19: 466–473. [DOI] [PMC free article] [PubMed] [Google Scholar]
- 71.Summers SA,, Birnbaum MJ.A role for the serine/threonine kinase, Akt, in insulin-stimulated glucose uptake. Biochem Soc Trans. 1997; 25: 981–988. [DOI] [PubMed] [Google Scholar]
- 72.Surwit RS,, Kuhn CM,, Cochrane C,, McCubbin JA,, Feinglos MN.Diet-induced type II diabetes in C57BL/6J mice. Diabetes. 1988; 37: 1163–1167. [DOI] [PubMed] [Google Scholar]
- 73.Mirhashemi F, Kluth O, Scherneck S, et al. . High-fat, carbohydrate-free diet markedly aggravates obesity but prevents beta-cell loss and diabetes in the obese, diabetes-susceptible db/db strain. Obes Facts. 2008; 1: 292–297. [DOI] [PMC free article] [PubMed] [Google Scholar]
- 74.Umeda M,, Ohkubo T,, Ono J,, Fukuizumi T,, Kitamura K.Molecular and immunohistochemical studies in expression of voltage-dependent Ca2+ channels in dorsal root ganglia from streptozotocin-induced diabetic mice. Life Sci. 2006; 79: 1995–2000. [DOI] [PubMed] [Google Scholar]
- 75.Hall KE,, Sima AA,, Wiley JW.Voltage-dependent calcium currents are enhanced in dorsal root ganglion neurones from the Bio Bred/Worchester diabetic rat. J Physiol. 1995; 486(pt 2): 313–322. [DOI] [PMC free article] [PubMed] [Google Scholar]
- 76.Hattori Y, Matsuda N, Kimura J, et al. . Diminished function and expression of the cardiac Na+-Ca2+ exchanger in diabetic rats: implication in Ca2+ overload. J Physiol. 2000; 527(pt 1): 85–94. [DOI] [PMC free article] [PubMed] [Google Scholar]
- 77.Chattou S,, Diacono J,, Feuvray D.Decrease in sodium-calcium exchange and calcium currents in diabetic rat ventricular myocytes. Acta Physiol Scand. 1999; 166: 137–144. [DOI] [PubMed] [Google Scholar]
- 78.Janicki PK,, Horn JL,, Singh G,, Franks WT,, Franks JJ.Diminished brain synaptic plasma membrane Ca(2+)-ATPase activity in rats with streptozocin-induced diabetes: association with reduced anesthetic requirements. Life Sci. 1994; 55: PL359–PL364. [DOI] [PubMed]
- 79.Lehotsky J,, Kaplan P,, Murin R,, Raeymaekers L.The role of plasma membrane Ca2+ pumps (PMCAs) in pathologies of mammalian cells. Front Biosci. 2002; 7: d53–d84. [DOI] [PubMed] [Google Scholar]
- 80.Takahashi H,, Murata T,, Hanahisa Y,, Yamaguchi M.Streptozotocin-induced diabetes increases (Ca2+-Mg2+)-ATPase activity in hepatic plasma membranes of rats: involvement of protein kinase C. Mol Cell Biochem. 1998; 178: 311–316. [DOI] [PubMed] [Google Scholar]
- 81.Du Y,, Miller CM,, Kern TS.Hyperglycemia increases mitochondrial superoxide in retina and retinal cells. Free Radic Biol Med. 2003; 35: 1491–1499. [DOI] [PubMed] [Google Scholar]
- 82.Kanwar M,, Chan PS,, Kern TS,, Kowluru RA.Oxidative damage in the retinal mitochondria of diabetic mice: possible protection by superoxide dismutase. Invest Ophthalmol Vis Sci. 2007; 48: 3805–3811. [DOI] [PubMed] [Google Scholar]
- 83.Kowluru RA,, Tang J,, Kern TS.Abnormalities of retinal metabolism in diabetes and experimental galactosemia, VII: effect of long-term administration of antioxidants on the development of retinopathy. Diabetes. 2001; 50: 1938–1942. [DOI] [PubMed] [Google Scholar]
- 84.Nishikawa T, Edelstein D, Du XL, et al. . Normalizing mitochondrial superoxide production blocks three pathways of hyperglycaemic damage. Nature. 2000; 404: 787–790. [DOI] [PubMed] [Google Scholar]
- 85.Du XL, Edelstein D, Rossetti L, et al. . Hyperglycemia-induced mitochondrial superoxide overproduction activates the hexosamine pathway and induces plasminogen activator inhibitor-1 expression by increasing Sp1 glycosylation. Proc Natl Acad Sci U S A. 2000; 97: 12222–12226. [DOI] [PMC free article] [PubMed] [Google Scholar]
- 86.Antonetti DA,, Klein R,, Gardner TW.Diabetic retinopathy. N Engl J Med. 2012; 366: 1227–1239. [DOI] [PubMed] [Google Scholar]


