Abstract
The object of this study is to develop optimization procedures that account for both the optical heterogeneity as well as photosensitizer (PS) drug distribution of the patient prostate and thereby enable delivery of uniform photodynamic dose to that gland. We use the heterogeneous optical properties measured for a patient prostate to calculate a light fluence kernel (table). PS distribution is then multiplied with the light fluence kernel to form the PDT dose kernel. The Cimmino feasibility algorithm, which is fast, linear, and always converges reliably, is applied as a search tool to choose the weights of the light sources to optimize PDT dose. Maximum and minimum PDT dose limits chosen for sample points in the prostate constrain the solution for the source strengths of the cylindrical diffuser fibers (CDF). We tested the Cimmino optimization procedures using the light fluence kernel generated for heterogeneous optical properties, and compared the optimized treatment plans with those obtained using homogeneous optical properties. To study how different photosensitizer distributions in the prostate affect optimization, comparisons of light fluence rate and PDT dose distributions were made with three distributions of photosensitizer: uniform, linear spatial distribution, and the measured PS distribution. The study shows that optimization of individual light source positions and intensities are feasible for the heterogeneous prostate during PDT.
Keywords: Photodynamic therapy, prostate, Cimmino Optimization, light dosimetry, PDT dose, photosensitizer distribution
INTRODUCTION
Photodynamic therapy (PDT) is a treatment modality employing light of an appropriate wavelength in the presence of oxygen to activate a photosensitizing drug which then causes localized cell death or tissue necrosis. Using a surface illumination technique, PDT has been used to treat many superficial tumors including skin, lung, esophagus, and bladder.1 This technique is, however, inadequate when applied to large bulky tumors or solid organs due to limited light penetration into tissue. A more efficient illumination scheme would be interstitial light delivery whereby optical fibers are placed directly into the bulky tumors or organs.
The prostate gland is an organ that appears to be a good target for interstitial PDT. Tumors of the prostate are often confined to the prostate itself and brachytherapy techniques used for the placement of radioactive seed implants can be adapted for the placement of interstitial optical fibers.2 Several studies have evaluated the feasibility of delivering PDT to the prostate via this interstitial approach.2,3 We have initiated a motexafin lutetium (MLu)-mediated PDT of the prostate in human at University of Pennsylvania.4–6 Ideal optimization of the photodynamic linear light sources depends on knowledge of the spatial distributions of (1) tissue light opacity within the prostate and (2) photosensitizing drug. We have developed a method to determine the heterogeneous distribution of optical properties using a point source.7 For MLu-mediated PDT, the photosensitizer drug concentration can be determined by either interstitial fluorescence spectroscopy8 or absorption spectroscopy2,7. Since these spatial distributions can vary in time, measurements must be done just prior to the clinical procedure. Moreover, the optical properties distribution may be affected by bleeding associated with insertion of the light sources and ideally should be monitored at a significant number of points during the entire procedure. Ultimately, PDT efficacy is determined by the PDT dose, defined as a product of light fluence and drug concentration.
A number of optimization algorithms used in brachytherapy are of interest for prostate photodynamic therapy. In general, gradient algorithms give reproducible solutions but may be trapped in local minima far from the global minimum.9 Simulated annealing and genetic algorithms avoid getting trapped in local minima, but are relatively slow because they are stochastic algorithms.10 We use a systematic search procedure based on the Cimmino feasibility algorithm11 to obtain the locations and strengths of light sources for photodynamic treatment. The Cimmino algorithm is an iterative linear algorithm which was first applied to radiotherapy inverse problems by Censor et al.12–14 The algorithm is safer than most common optimization algorithms outlined above since it always converges and, if no solution exists for the inequalities (i.e. the prescribed PDT dose constraints are not all satisfied), the Cimmino algorithm reverts to a least-square solution14
Previous studies concentrate on the optimization of light fluence only under homogeneous15 or heterogeneous16 optical properties. For the present study we concentrate on optimization of PDT dose as a product of photosensitizer drug concentration and the light fluence for heterogeneous prostate optical properties.
II. METHODS AND MATERIALS
1. Calculation of light fluence rate in heterogeneous optical properties
The transport scattering (µ’s) and absorption (µa) coefficients characterize the scattering and absorption properties of tissue. With the diffusion approximation and the assumption that µa,i and µs,i’ are a function of ri (i = 1,2,…N) only, the light fluence rate ϕ at a distance r from a point source of power, S, can be expressed as17
| (1) |
and in the last shell,
| (2) |
The coefficients C, pi, qi are obtained using the boundary conditions between two shells and the energy conservation in the volume. For arbitrary 3D distribution of optical properties, we expanded the expressions for the light fluence rate to keep the forms the same as those expressed above; optical properties along a ray line between a source and a detector were used, i.e., µeff(r) was replaced by µeff(r,θ,ϕ). The model was applied to linear sources by considering a linear source to be composed of multiple point sources.17
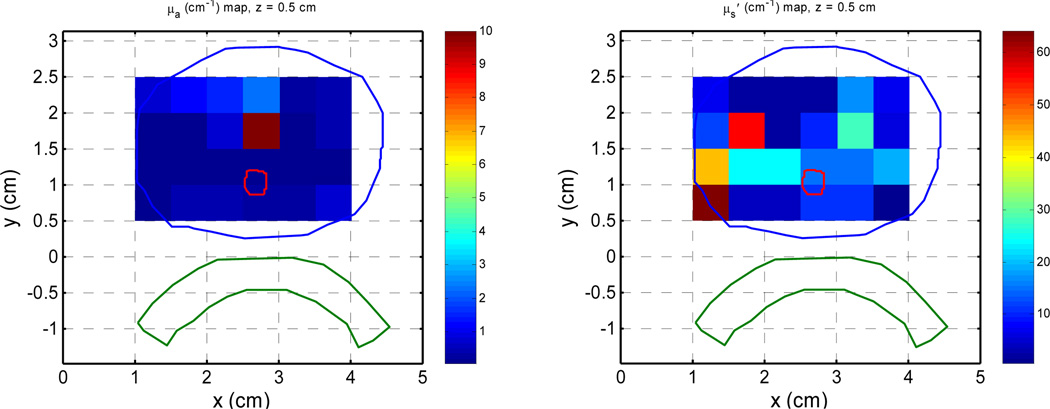
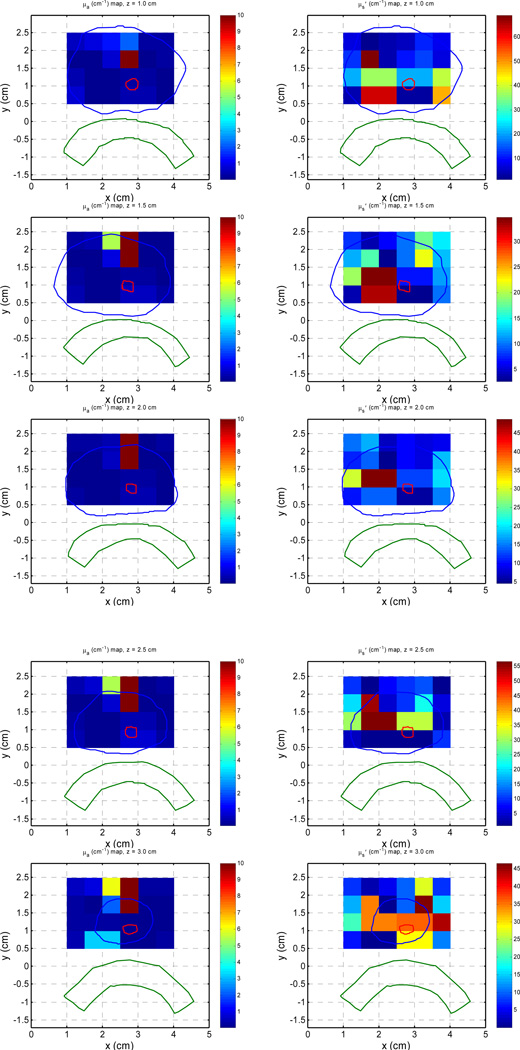
Measurements at multiple sites allow evaluating the variation of these optical characteristics within the prostate volume. This is done for a clinical case and the distribution of optical properties are shown in Fig. 1. Details about how to obtain the optical properties distribution are described elsewhere.17 Previous studies have determined that the mean optical properties in human prostate is µa = 0.3±0.2 cm−1 and µs’ = 14 ± 11 cm−1 at the wavelength of treatment (732nm).18
Figure 1.
Distribution of optical properties in a clinical patient for µa (left column) and µs’ (right column) for different slices.
2. Description of the patient being studied
A Phase I clinical trial of motexafin lutetium (MLu)-mediated PDT in patients with locally recurrent prostate carcinoma was initiated at the University of Pennsylvania. The protocol was approved by the Institutional Review board of the University of Pennsylvania, the Clinical Trials and Scientific Monitoring Committee (CTSRMC) of the University of Pennsylvania Cancer Center, and the Cancer Therapy Evaluation Program (CTEP) of the National Cancer Institute. Approximately two weeks prior to the scheduled treatment a transrectal ultrasound (TRUS) was performed for treatment planning. An urologist drew the target volume (the prostate) on each slice of the ultrasound images. These images were spaced 0.5 cm apart and were scanned with the same ultrasound unit used for treatment (Fig. 1).
A built-in template with a 0.5-cm grid projected the locations of possible light sources relative to the prostate. A treatment plan was then prepared to determine the location and length of light sources. Cylindrical diffusing fibers (CDF) with active lengths 1–5 cm were used as light sources. The sources were spaced one centimeter apart and the light power per unit length was less than or equal to 150 mW/cm for all optical fibers. The length of the CDF at a particular position within the prostate was selected to cover the full length of the prostate (see Fig. 1). These source catheters were used for light delivery and optical properties measurements. A 15-W diode laser, model 730 (Diomed, Ltd., Cambridge, United Kingdom) was used as the 732 nm light source.
3. Search procedure with the Cimmino optimization algorithm
The algorithms discussed below try to achieve (1) a prescribed minimum PDT dose within the prostate, and (2) PDT doses not exceeding the maximum PDT doses specified separately for the prostate, urethra, rectum, and background tissues. The contours of the prostate, urethra, and rectum in each transverse slice (parallel to the template plane and perpendicular to the linear light sources) are assumed available in computer memory. At present, up to 13 transverse slices spaced 5 mm apart are allowed.
The discretized simple inverse problem can be written as
| (3) |
or in matrix form as
| (4) |
where I is the number of voxels (or constraint points); bmax and bmin are the PDT dose bounds on the voxels; J is the number of light sources; a component of matrix A denoted Aij gives the PDT dose absorbed at voxel i per unit strength of light source j. A positive lower bound prescribes a minimum PDT dose for a prostate (target) voxel; it is zero for non-prostate voxels. An upper bound on PDT dose is provided for every voxel. The goal is to find the vector x of source strengths that satisfies the inequality constraints of the expression (4).
The matrix A is a pre-calculated 2-D PDT dose (or kernel) table, that equals the product of the light fluence table for sources of all allowed lengths and the known drug concentration. In this study, for simplicity, the matrix is calculated for sources of fixed lengths, which are geometrically pruned based on the prostate geometry.
To focus this paper on algorithmic procedures, we omit any discussion on choosing the number of light sources. The number of sources is always assumed to be given, in this study either 35 sources that cover the entire prostate gland at 0.5 cm interval or 12 sources that covers the entire prostate gland at 1 cm interval.
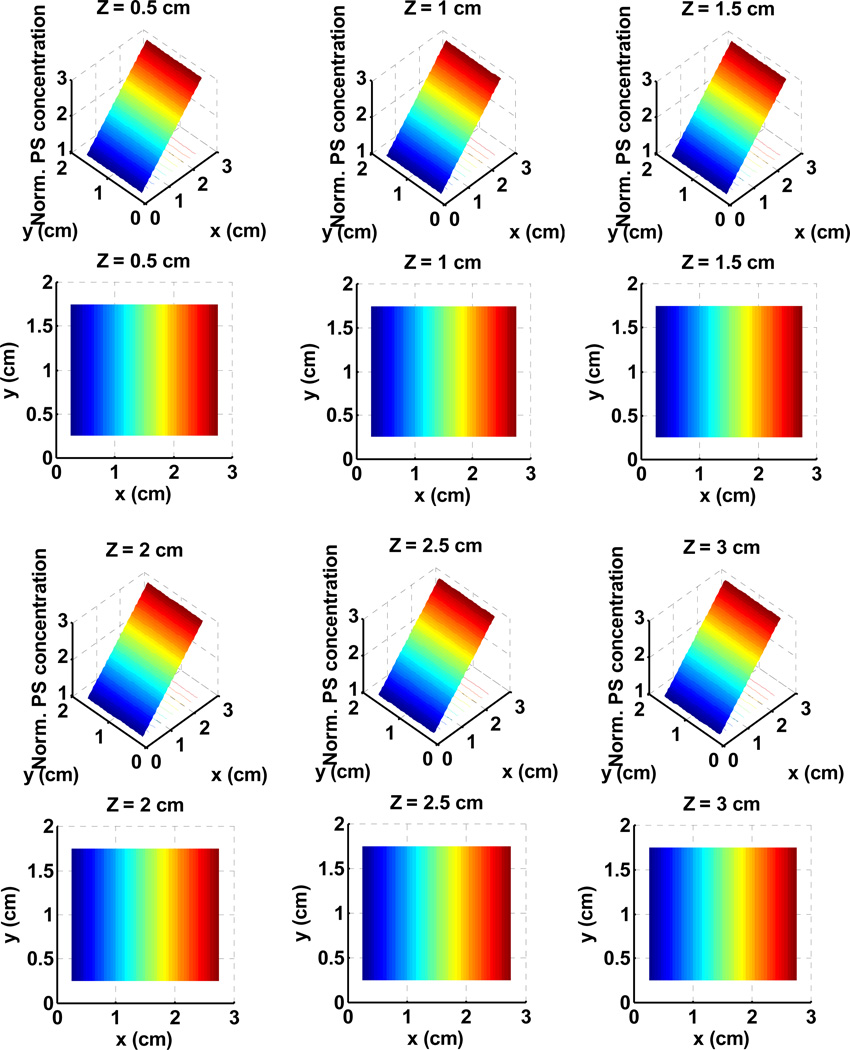
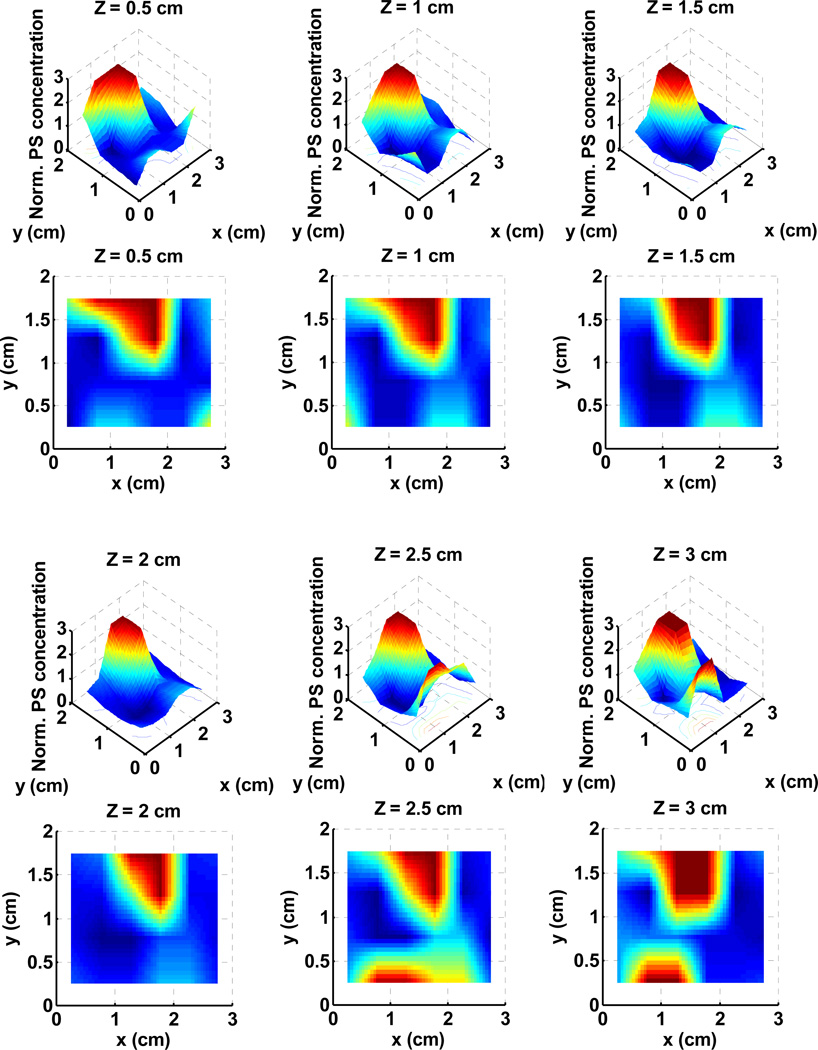
To check the effect of Cimmino optimizations, two different optical properties were chosen: (a) the average optical properties of all prostate patients, µa = 0.3 cm−1 and µs’ = 14 cm−1; and (b) clinical optical properties as measured in Fig. 1. In addition, three different PS drug concentrations are considered: (i) uniform (c = 1); (ii) linear (Fig. 2); (iii) clinical PS drug distribution (Fig. 3). Notice that all drug concentration are normalized distribution such that c = 1 corresponding to the average PS distribution. It is noteworthy to point out the similarity between the absorption coefficient map at 732 nm (Fig. 1) and the photosensitizer drug distribution (Fig. 3). Previous studies have shown that the drug concentration (in mg per kg body mass) is proportional to the absorption coefficient.8,18
Figure 2.
Normalized linear photosensitizer (PS) drug distribution used for the solid lines for PDT dose distribution as shown in Figs. 5 and 6. The drug concentration changes by 3 times from c = 1 for × = 0 to c = 3 for × = 2.5 cm.
Figure 3.
Normalized clinical photosensitizer (PS) drug distribution used for the solid lines for PDT dose distribution as shown in Figs. 5 and 6.
III. RESULTS AND DISCUSSIONS
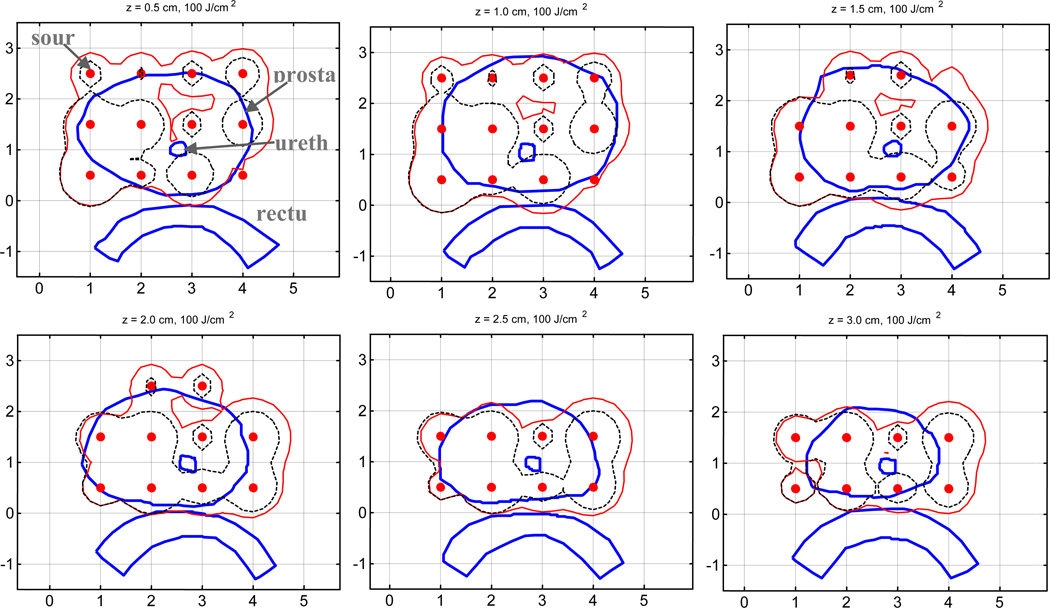
Figure 4 compares computer runs of optimized 100% isodose distributions for light fluence rate to the 3D prostate volume using light source weight based on Cimmino algorithm assuming uniform optical properties (µa = 0.3 cm−1 and µs’ = 14 cm−1) (dashed lines) and that using the actual clinical optical properties distribution (Fig. 1) (solid line). The source locations for the Cimmino run were chosen manually and kept the same (solid circles). The forward calculation uses the actual optical properties distribution and the heterogeneous kernel (Eq. 1). There is a huge difference between the two planes. This is not surprising since the mean light penetration depth is much larger than the light penetration in the upper right side of the prostate.
Figure 4.
Comparison of 100% isodose lines for light fluence rate distribution of Cimmino optimized loading with mean uniform optical properties (µa = 0.3 cm−1, µs’ = 14 cm−1) (dashed lines) and clinical distribution of optical properties (solid line). Contours for prostate, urethra, and rectum are also shown in the figure.
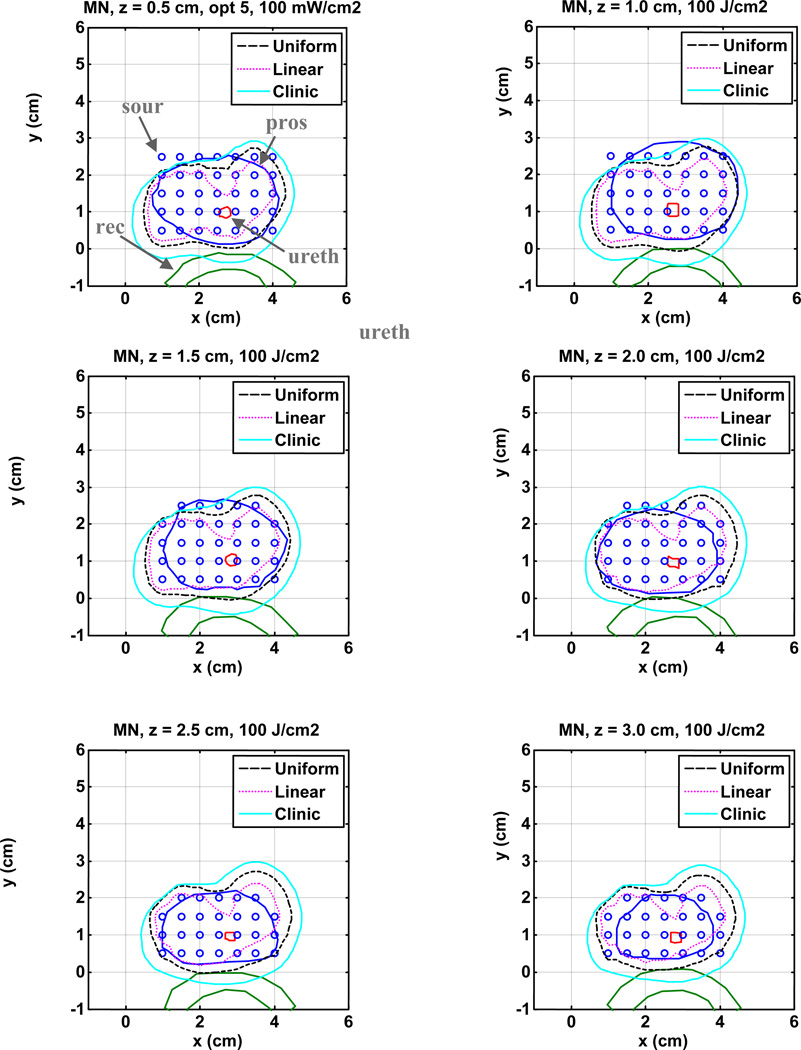
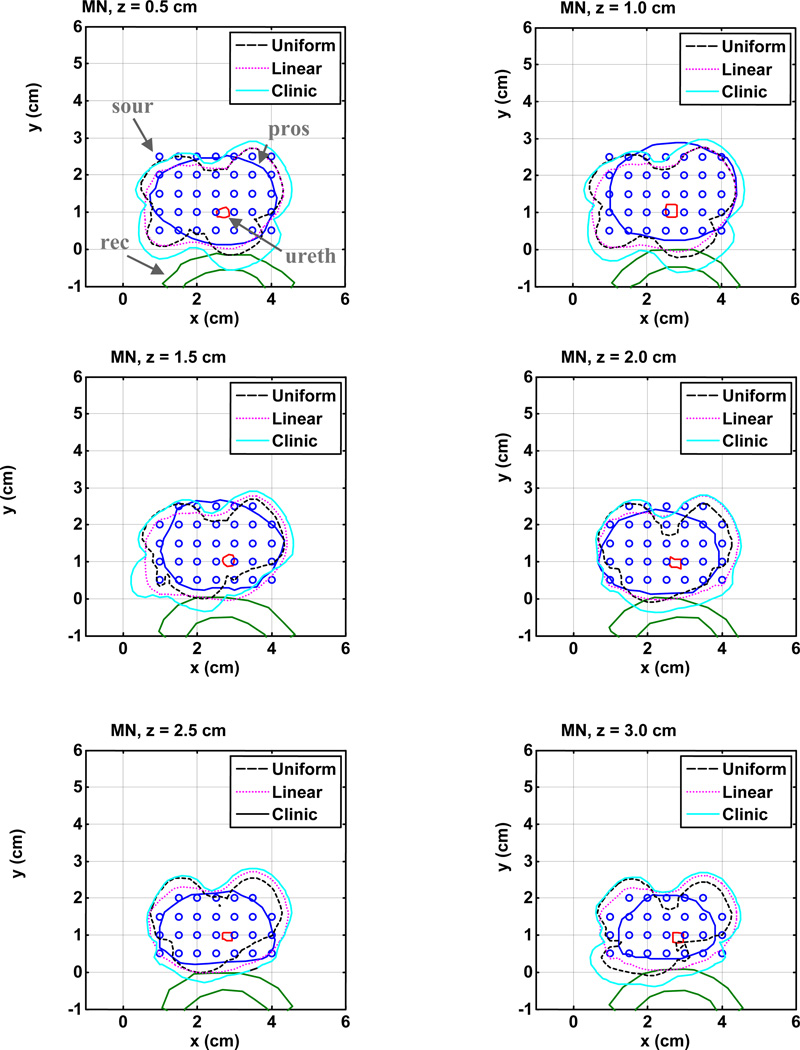
Finally we examined the additional effects of photosensitizer drug distribution on light fluence rate distribution (Fig. 5) and the PDT dose distribution (Fig. 6). To minimize the effect of number of light sources, we restricted the study to 35 source positions for three different photosensitizer distributions: (i) c = 1; (ii) linear PS distributions (Fig. 2); (iii) clinical PS distribution (Fig. 3). Only clinical heterogeneous optical properties (Fig. 1) are considered. The Cimmino optimal source strengths and other light source parameters are listed in Table 1.
Figure 5.
Comparison of 100% isodose lines of light fluence rate in the heterogeneous prostate among three cases: ignoring clinic PS drug distribution (dashed line); including clinical PS drug distribution (solid line); and using linear PS drug distribution (dotted line). The source strengths are listed in Table 1.
Figure 6.
A comparison of prostate coverage for PDT dose in the heterogeneous prostate among three conditions: ignoring clinic PS drug distribution (dashed line), with clinical PS drug distribution (solid line) and with linear PS drug distribution (dotted line). The source strengths are listed in Table 1.
Table 1.
Results of source strengths (J) obtained using Cimmino search algorithms for 35 sources for heterogeneous prostate optical properties and three different conditions of photosensitizer drug distribution: uniform (c = 1 everywhere), linear (Fig. 2), and clinical optical properties (Fig. 3). The location (X, Y), retraction (negative number means extension instead of retraction from the first slice), and length of CDF are also listed.
| X (cm) | Y (cm) | Retraction (cm) |
length (cm) |
W (J) (Uniform) |
W (J) (linear) |
W (J) (Clinical) |
|---|---|---|---|---|---|---|
| 1.0 | 2.5 | −0.25 | 1 | 1.00 | 0.00 | 0.00 |
| 1.5 | 2.5 | −0.25 | 2 | 3.00 | 1.00 | 6.00 |
| 2.0 | 2.5 | −0.25 | 2 | 8.00 | 3.00 | 17.00 |
| 2.5 | 2.5 | −0.25 | 2 | 10.00 | 3.00 | 20.00 |
| 3.0 | 2.5 | −0.25 | 2 | 6.00 | 2.00 | 13.00 |
| 3.5 | 2.5 | −0.25 | 2 | 18.00 | 6.00 | 42.00 |
| 4.0 | 2.5 | −0.25 | 1 | 2.00 | 0.00 | 2.00 |
| 1.0 | 2.0 | −0.25 | 2 | 9.00 | 6.00 | 4.00 |
| 1.5 | 2.0 | −0.25 | 3 | 25.00 | 11.00 | 33.00 |
| 2.0 | 2.0 | −0.25 | 3 | 39.00 | 15.00 | 72.00 |
| 2.5 | 2.0 | −0.25 | 3 | 83.00 | 29.00 | 217.00 |
| 3.0 | 2.0 | −0.25 | 3 | 38.00 | 12.00 | 82.00 |
| 3.5 | 2.0 | −0.25 | 3 | 109.00 | 35.00 | 271.00 |
| 4.0 | 2.0 | −0.25 | 2 | 8.00 | 3.00 | 17.00 |
| 1.0 | 1.5 | −0.25 | 3 | 21.00 | 14.00 | 30.00 |
| 1.5 | 1.5 | −0.25 | 3 | 50.00 | 23.00 | 10.00 |
| 2.0 | 1.5 | −0.25 | 4 | 106.00 | 40.00 | 207.00 |
| 2.5 | 1.5 | −0.25 | 4 | 46.00 | 16.00 | 146.00 |
| 3.0 | 1.5 | −0.25 | 4 | 29.00 | 9.00 | 60.00 |
| 3.5 | 1.5 | −0.25 | 4 | 138.00 | 45.00 | 313.00 |
| 4.0 | 1.5 | −0.25 | 3 | 19.00 | 6.00 | 47.00 |
| 1.0 | 1.0 | −0.25 | 3 | 21.00 | 14.00 | 96.00 |
| 1.5 | 1.0 | −0.25 | 3 | 19.00 | 10.00 | 27.00 |
| 2.0 | 1.0 | −0.25 | 4 | 50.00 | 20.00 | 99.00 |
| 2.5 | 1.0 | −0.25 | 4 | 49.00 | 17.00 | 172.00 |
| 3.0 | 1.0 | −0.25 | 4 | 92.00 | 30.00 | 278.00 |
| 3.5 | 1.0 | −0.25 | 4 | 26.00 | 8.00 | 85.00 |
| 4.0 | 1.0 | −0.25 | 3 | 7.00 | 2.00 | 25.00 |
| 1.0 | 0.5 | −0.25 | 3 | 16.00 | 9.00 | 86.00 |
| 1.5 | 0.5 | −0.25 | 3 | 21.00 | 11.00 | 80.00 |
| 2.0 | 0.5 | −0.25 | 4 | 37.00 | 15.00 | 86.00 |
| 2.5 | 0.5 | −0.25 | 3 | 48.00 | 17.00 | 150.00 |
| 3.0 | 0.5 | −0.25 | 4 | 50.00 | 16.00 | 223.00 |
| 3.5 | 0.5 | −0.25 | 3 | 9.00 | 3.00 | 46.00 |
| 4.0 | 0.5 | −0.25 | 3 | 4.00 | 1.00 | 15.00 |
Figure 5 compare the effect of photosensitizer (PS) drug distribution on the prostate light fluence coverage. In this figure, source strengths and source parameters from Table 1 are used. The 100% isodose line provides adequate prostate coverage for uniform drug distribution, as expected, but not for the linear PS distribution (solid line). This is likely the result of Cimmino optimization to ensure PDT dose (product of PS concentration and light fluence) to be more uniform.
Figure 6 compare the effect of PS drug distribution on the prostate PDT dose coverage. It is clear that the PDT dose prostate coverage is the worst for the uniform PS distribution (dashed line) condition. On the other hand, there are regions where PDT dose still does not cover the entire prostate even when the PS distribution is taken into account in the upper middle zones. That is likely due to extremely high light absorption in this region.
IV. CONCLUSION
The question addressed is whether any significant advantage may derive from methods that weight each CDF source separately and/or choose the geometry of the light sources as well. In summary, our comparison shows that: (1) it is important to measure the optical properties of a patient because it determines the light fluence distribution. This source strength using the Cimmino algorithm is feasible for optimizing PDT dose for heterogeneous prostate PDT. (3) The heterogeneous Cimmino optimization with the drug concentration may significantly alter the light fluence rate distribution to obtain the most optimal PDT dose distribution. The Cimmino optimization is fast enough for this problem to obtain clinical real-time optimization (less than 300 s, Table 1).
ACKNOWLEDGMENT
This work is supported by grants from National Institute of Health (NIH) R01 CA 109456 and P01 CA87971.
REFERENCES
- 1.Huang Z. A review of Progress in Clinical Photodynamic Therapy. Technol Can Res Treat. 2005;4(3):283–293. doi: 10.1177/153303460500400308. [DOI] [PMC free article] [PubMed] [Google Scholar]
- 2.Zhu TC, Finlay JC. Prostate PDT dosimetry. Photodiag. Photodyn. Ther. 2006;4:234–246. doi: 10.1016/j.pdpdt.2006.08.002. [DOI] [PMC free article] [PubMed] [Google Scholar]
- 3.Moore CM, Pendse D, Emberton M. Photodynamic therapy for prostate cancer--a review of current status and future promise. Nature clinical practice. 2009;6(1):18–30. doi: 10.1038/ncpuro1274. [DOI] [PubMed] [Google Scholar]
- 4.Verigos K, Stripp DC, Mick R, Zhu TC, Whittington R, Smith D, Dimofte A, Finlay J, Busch TM, Tochner ZA, Malkowicz S, Glatstein E, Hahn SM. Updated results of a phase I trial of motexafin lutetium-mediated interstitial photodynamic therapy in patients with locally recurrent prostate cancer. J Environ Pathol Toxicol Oncol. 2006;25:373–387. doi: 10.1615/jenvironpatholtoxicoloncol.v25.i1-2.230. [DOI] [PubMed] [Google Scholar]
- 5.Patel H, Mick R, Finlay JC, Zhu TC, Rickter E, Cengel K, Malkowicz S, Hahn S, Busch T. Motexafin lutetium-photodynamic therapy of prostate cancer: short and long term effect on prostate-specific antigen. Clin Can Res. 2008;14:4869–4876. doi: 10.1158/1078-0432.CCR-08-0317. [DOI] [PMC free article] [PubMed] [Google Scholar]
- 6.Du KL, Mick R, Busch TM, Zhu TC, Finlay JC, Yu G, Yodh AG, Malkowicz SB, Smith D, Whittington R, Stripp D, Hahn SM. Preliminary results of interstitial motexafin lutetium-mediated PDT for prostate cancer. Lasers Surg Med. 2006;38:427–434. doi: 10.1002/lsm.20341. [DOI] [PubMed] [Google Scholar]
- 7.Zhu TC, Finlay JC, Hahn SM. Determination of the distribution of light, optical properties, drug concentration, and tissue oxygenation in-vivo in human prostate during motexafin lutetium-mediated photodynamic therapy. J Photochem Photobiol B. 2005;79(3):231–241. doi: 10.1016/j.jphotobiol.2004.09.013. [DOI] [PMC free article] [PubMed] [Google Scholar]
- 8.Finlay JC, Zhu TC, Dimofte A, Stripp D, Malkowicz SB, Busch TM, Hahn SM. Interstitial fluorescence spectroscopy in the human prostate during motexafin lutetium-mediated photodynamic therapy. Photochem Photobiol. 2006;82(5):1270–1278. doi: 10.1562/2005-10-04-RA-711. [DOI] [PMC free article] [PubMed] [Google Scholar]
- 9.Zhang X, Liu H, Wang X, Dong L, Wu Q, Mohan R. Speed and convergence properties of gradient algorithms for optimization of IMRT. Med Phys. 2004;31:1141–1152. doi: 10.1118/1.1688214. [DOI] [PubMed] [Google Scholar]
- 10.Sloboda RS. Optimization of brachytherapy dose distributions by simulated annealing. Med Phys. 1992;19:955–964. doi: 10.1118/1.596783. [DOI] [PubMed] [Google Scholar]
- 11.Cimmino G. Calcolo approxximato per le soluzioni dei sistemi di equazioni lineari. La Ric Sci Roma 16 Anno IX. 1938;1:326–333. [Google Scholar]
- 12.Censor Y, Altschuler MD, Powlis W. On the use of Cimmino's simultaneous projections methods for computing a solution of the inverse problem in radiation therapy treatment planning. J Inv. Prob. 1988;4:607–623. [Google Scholar]
- 13.Powlis WD, Altschuler MD, Censor Y, Buhle EL., Jr Semi-automated radiotherapy treatment planning with a mathematical model to satisfy treatment goals. Int J Radiat Oncol Biol Phys. 1989;16:271–276. doi: 10.1016/0360-3016(89)90042-4. [DOI] [PubMed] [Google Scholar]
- 14.Censor Y, Gordon D, Gordon R. Component averaging: an efficient iterative parallel algorithm for large and sparse unstructured problems. Paral Comp. 2001;27:770–808. [Google Scholar]
- 15.Altschuler MD, Zhu TC, Li J, Hahn SM. Optimized interstitial PDT prostate treatment planning with the Cimmino feasibility algorithm. Med Phys. 2005;32(12):3524–3536. doi: 10.1118/1.2107047. [DOI] [PMC free article] [PubMed] [Google Scholar]
- 16.Li J, Altschuler MD, Hahn SM, Zhu TC. Optimization of light source parameters in the photodynamic therapy of heterogeneous prostate. Phys Med Biol. 2008;53(15):4107–4121. doi: 10.1088/0031-9155/53/15/007. [DOI] [PMC free article] [PubMed] [Google Scholar]
- 17.Li J, Zhu TC. Determination of in vivo light fluence distribution in a heterogeneous prostate during photodynamic therapy. Phys Med Biol. 2008;53(8):2103–2114. doi: 10.1088/0031-9155/53/8/007. [DOI] [PMC free article] [PubMed] [Google Scholar]
- 18.Zhu TC, Dimofte A, Finlay JC, Stripp D, Busch T, Miles J, Whittington R, Malkowicz SB, Tochner Z, Glatstein E, Hahn SM. Optical properties of human prostate at 732 nm measured in MLu-mediated photodynamic therapy. Photochem Photobiol. 2005;81(1):96–105. doi: 10.1562/2004-06-25-RA-216. [DOI] [PMC free article] [PubMed] [Google Scholar]


