

Abstract
Alzheimer’s disease (AD) is associated with a microglia-dependent neuroinflammatory response against plaques containing the fibrous protein amyloid-β (Aβ). Activation of microglia, which closely associate with Aβ plaques, engenders the release of pro-inflammatory cytokines and the internalization of Aβ fibrils. Since the pro-inflammatory transcription factor NF-κB is one of the major regulators of Aβ-induced inflammation, we treated transgenic amyloid-β protein protein/presenilin-1 (AβPP/PS1) mice for one year with a low dose (0.01% by weight in the diet) of either of two trans-stilbene NF-κB inhibitors, resveratrol or a synthetic analog LD55. The 3D distribution of Aβ plaques was measured ex vivo in intact brains at 60 μm resolution by quantitative magnetic resonance imaging (MRI) using blood-brain barrier-permeable, anti-AβPP-conjugated superparamagentic iron oxide nanoparticles (SPIONs). The MRI measurements were confirmed by optical microscopy of thioflavin-stained brain tissue sections and indicated that supplementation with either of the two trans-stilbenes lowered Aβ plaque density in the cortex, caudoputamen, and hippocampus by 1.4 to 2-fold. The optical measurements also included the hippocampus and indicated that resveratrol and LD55 reduced average Aβ plaque density by 2.3-fold and 3.1-fold, respectively. Ex vivo measurements of the regional distribution of microglial activation by Iba-1 immunofluorescence of brain tissue sections showed that resveratrol and LD55 reduced average microglial activation by 4.2-fold and 3.5-fold, respectively. Since LD55 lacked hydroxyl groups but both resveratrol and LD55 concomitantly reduced both Aβ plaque burden and neuroinflammation to a similar extent, it appears that the antioxidant potential of resveratrol is not an important factor in plaque reduction.
Keywords: LD55, magnetic resonance imaging, microglia, neuroinflammation, NF-κB, resveratrol, SPIONs, transgenic mice
INTRODUCTION
An exceptional challenge for modern medical science is the fact that Alzheimer’s disease (AD) currently afflicts approximately 5.5 million people in the US [1] and that its incidence is anticipated to rise to 12 million cases by 2040 [2]. Among the principal pathological findings related to AD are accretions in the brain of the filamentous amyloid-β peptides (Aβ) resulting from the proteolytic cleavage of the membrane-associated amyloid-β protein precursor (AβPP) by the β- and γ-secretases [3]. Although there are a number of cleavage products, aggregations of the 40–42 amino acid peptides (Aβ40,42) appear to be the major contributors to AD-associated pathology. Through self-aggregation, these peptides form multi-Aβ oligomers, which are neurotoxic [4, 5] and disrupt hippocampal long-term potentiation and synaptic plasticity [6, 7]. These oligomers continue to grow to form larger, classical Aβ plaques [8]. Although the Aβ plaques themselves do not appear to be as neurotoxic as the soluble oligomers, they do elicit an immune response, and because the production of Aβ is continuous, this leads to chronic inflammation of the brain [9].
There is a significant need to develop drugs that reduce plaques and inflammation, but a major impediment to the study of potential drugs is a dearth of robust, non-invasive methods for longitudinally monitoring either plaque formation or neuroinflammation within the brain. This problem has been partially addressed in human patients by the development of PET agents that reveal plaques, such as Pittsburg Compound B [10, 11] and [18F]-AV-45 [12, 13], but the resolution, even for microPET, is too poor to resolve individual plaques in either humans or rodents. On the other hand, magnetic resonance imaging (MRI) holds significant promise for solving this problem because the resolution of high-field MRI is approximately the same as the 30–60 μm diameter of an Aβ plaque. High-field MRI has been successfully applied to imaging plaques in transgenic mice, both ex vivo and in vivo, for over a decade [14–19] without the aid of contrast agents. The endogenous MRI contrast mechanism is based on the magnetic susceptibility difference between the protein core of the plaque and the surrounding tissue water. We have recently devised a method using blood-brain barrier (BBB) penetrating, amyloid-targeted, superparamagnetic iron oxide nanoparticles (SPIONs) for markedly enhancing this susceptibility difference [20]. By applying this novel technology to the MRI of AβPP/PS-1 transgenic (Tg) AD mice, we were able to more than double the MRI conspicuity of plaques. It was of great interest, therefore, to use this new non-invasive method for the determination of the effects of potential drugs on plaque formation in Tg AD mice.
Along with the hallmark Aβ plaques in the brain, AD also involves substantial microglia-mediated neuroinflammation. Microglial cells, the brain’s resident macrophages [21–24], form dense clusters surrounding the Aβ plaques [25]. Ramified microglia are characterized by their active processes that scan the brain parenchyma every few hours for CNS damage [26]. Microglia enter their activated ameboid form after sensing brain insults via the Toll-like receptor (TLR) family of pattern recognition receptors [27]. TLR4, in particular, participates in the recognition and phagocytosis of Aβ plaques [28] and is an activator of the pro-inflammatory NF-κB pathway [29, 30]. Furthermore, phagocytosis components, such as the macrosialin and Fc receptors, are elevated in plaque-associated microglia [31], congruent with the fact that microglia internalize and degrade amyloid [5, 32]. The inflammatory response of microglia is accompanied by the release of several pro-inflammatory cytokines, including TNFα and IL1β, which act on astrocytes to promote secondary inflammatory responses. Microglia may be beneficial under some circumstances to clear dead or dying neurons, but can phagocytose viable neurons under inflammatory conditions [33].
The pro-inflammatory transcription factor NF-κB is the primary regulator of inflammatory responses in AD [34]. In AD brains, activated NF-κB is found in neurons and in microglia and astrocytes that surround plaques. NF-κB can be activated by the amyloid plaques directly [35]. It must be noted, however, that NF-κB may have different roles in different cell types and may be protective in neurons. It appears that the cell type and duration of NF-κB activation determine the role of NF-κB, where chronic activation in microglia and astrocytes leads to sustained pro-inflammatory stimuli that may contribute to the death of neurons [36, 37]. Because TNFα, IL1β, and oxidative stress can all stimulate microglia and astrocytes to secrete additional TNFα and IL1β, it is not difficult to imagine a mechanism for sustained activation of a pro-inflammatory environment [38]. The natural product resveratrol (Fig. 1) possesses anti-inflammatory, antioxidant, and anti-cancer activities, which may result from its known inhibition of NF-κB [30, 39–43]. Of special interest, resveratrol was shown to inhibit the expression of iNOS and TNFα in LPS-activated microglia by an NF-κB-dependent pathway [44]. The finding that resveratrol, in contrast to other antioxidants, protected astroglial cells from ammonia toxicity [45] through a pathway involving NF-κB is significant in view of the antioxidant properties of resveratrol [43] and the frequent suggestion that many of the biological properties of polyphenolic natural products derive from their antioxidant activities [46]. The abundant literature on resveratrol suggests that it has multiple targets in cells, but many of these directly or indirectly affect the expression of NF-κB [47–50].
Fig. 1.

Comparison of the chemical structures of the trans-stilbene based inhibitors of NF-κB used in this study. Resveratrol, ((E)-3,5,4′-trihydroxystilbene), and the novel NF-κB inhibitor, LD55, ((E)-2-fluoro-4′-methoxystilbene).
Genetic mutations associated with early-onset AD have been isolated to chromosome 21 in the gene for AβPP [7, 51], chromosome 14 in the gene for pre-senilin 1 (PS-1), and chromosome 1 on the gene for presenilin 2 (PS-2) [52]. Transgenic mice bearing these mutated human genes recapitulate many of the characteristic changes seen in humans with early-onset AD [31, 53, 54]; thus we employed mice transgenic for AβPP and PS-1 genes in our experimental design to test the long-term effects of NF-κB inhibitors on plaque load and inflammation, beginning treatment when the animals were young, and to determine whether long-term treatment with resveratrol or other trans-stilbenes is toxic.
Resveratrol has been shown to reduce Aβ plaque load in several studies with transgenic mice. For example, Tg19959 mice fed resveratrol by dietary supplementation for 45 days showed a markedly reduced plaque load in certain areas of the brain, such as the striatum and the hypothalamus, but this treatment had no effect on plaque load in the hippocampus [55], which is a strongly-involved brain region in human AD patients. In another study, it was found that AβPP/PS1 transgenic mice fed resveratrol in their diet for 15 weeks [56] demonstrated significant plaque reduction in the cerebral cortex, but once again no plaque reduction was found in the hippocampus. A more recent study by this group [30] also demonstrated that oral administration of resveratrol lowered LPS-induced microglial activation. However, these studies used high dietary concentrations of resveratrol (0.2 to 0.35%) for fairly small time periods, and did not initiate treatment in very young animals.
LD55 (Fig. 1), which was synthesized [43] as an inhibitor of the activation of NF-κB, shares the trans-stilbene backbone with resveratrol but lacks the hydroxyl groups thought to contribute to resveratrol’s antioxidant activity. Nevertheless, we found LD55 to be both a potent inhibitor of NF-κB in the Panomics NF-κB Reporter Stable Cell Line assay [43], and of the LPS-induced expression of pro-inflammatory cytokines in BV2 microglial cells. Resveratrol shared these properties with LD55 [43]. LD55 was predicted by the Volsurf program to cross the BBB.
The present study was the first application of our newly-developed, non-invasive, SPION-enhanced, MRI method [20] to the measurement of the effects of drugs on the 3D distribution of Aβ plaques in intact transgenic AD mouse brains. The major question we asked was whether one or both of the NF-κB inhibitors, resveratrol and LD55, could elicit a concomitant decrease in MRI-detected plaque load and in microglial activation in multiple areas of the brain, especially the hippocampal region associated with many of the learning and memory deficits in AD. We report here that non-invasive, SPION-enhanced MRI can be used to measure the regional dependence of drug response in the brains of transgenic AD mice. We also found that resveratrol and LD55 prevented both plaque accumulation and microglial activation in the brains of transgenic mice fed these NF-κB inhibitors in their diets at a low concentration (0.01% by weight) for one year, from the time the mice were 6 weeks old. This finding of concomitant decreases supports the idea that inflammation and Aβ plaque load are closely linked in AD. We also found that the proposed antioxidant properties of resveratrol were not likely to be responsible for its effects because LD55 was found to be just as potent even though it lacked hydroxyl groups. Our data provide support for an alternative hypothesis where the primary mechanism responsible for the observed reduction in both plaque density and neuroinflammation is the inhibition of NF-κB.
MATERIALS AND METHODS
Reagents and antibodies
The SPIONs (superparamagnetic iron oxide nanoparticles) were from Chemicell GmbH, Berlin, Germany (Type: SiMAG-TCL, Lot # 0808/07, 50 nm nominal hydrodynamic diameter). LD55 was synthesized as reported previously [43]. Thioflavin-S and resveratrol were obtained from Sigma-Aldrich Corp. (St. Louis, MO, USA). Mouse anti-Tau, clone tau-5, N-hydroxysulfosuccinimide (Sulfo-NHS) and 1-Ethyl-3-[3-dimethylaminopropyl]carbodiimide hydrochloride (EDC) were obtained from Thermo Fisher Scientific (Fremont, CA, USA). Rabbit (polyclonal) anti-Aβ and Rabbit (polyclonal) anti-AβPP antibodies were obtained from Invitrogen Corp. (Camarillo, CA, USA). Rabbit anti-Iba-1 was obtained from Wako (Richmond, VA). The secondary antibody, rhodamine-conjugated donkey anti-rabbit IgG, for fluorescence microscopy, and normal donkey serum used in immunohistochemistry were purchased from JacksonImmuno Research (West Grove, PA, USA). Vectashield DAPI stain was purchased from Vector Laboratories (Burlingame, CA, USA). Paraffin embedding and sectioning were performed by TriCore Reference Laboratories (Albuquerque, NM, USA). Immunohistochemistry was performed by TriCore Reference Laboratories (Albuquerque, NM, USA) using the Ventana BenchMark XT IHC/ISH Staining Module.
Animals
The UNM IACUC approved all animal procedures. Six-week old, double transgenic AD mice (B6C3-Tg (AβPPswe, PSEN1dE9) 85Dbo/Mmjax) were obtained from Jackson Laboratory (Bar Harbor, ME, USA). One transgene encoded a mouse/human chimeric amyloid beta (A4) precursor protein containing the double Swedish mutations (AβPPswe; K595N/M596L). The second transgene for human pre-senilin 1 contained a deletion of exon 9 (dE9) which corresponded to an early-onset form of AD. A mouse prion promoter drove expression of both transgenes. Substantial expression of Aβ peptide and human pre-senilin was detected after 20 weeks of age, preceding the appearance of numerous plaques in the hippocampus and cortex by 9 months of age. Astrocytosis was measurable by 12 months, and by 13 months these animals showed significant cognitive impairment (http://jaxmice.jax.org/strain/004462.html). Thirty-six mice were divided into three groups of twelve each: (1) A control group fed a regular mouse diet (Research Diets, New Brunswick, NJ, USA); (2) A group whose diet was supplemented with 100 ppm resveratrol (Fig. 1); and (3) A group fed a diet containing 100 ppm LD55 (Fig. 1). There was no observed difference in weights among the three groups of mice over the 12 month duration of feeding. The mice were given ad libitum access for the 12 months that they were on these diets, after which time they were either sacrificed or were treated with either of the two SPION preparations (vide supra) by tail vein injection and were killed 24 h later. The brains of these groups of mice were quickly harvested and fixed in buffered formalin for three days. Brains used for MRI were embedded in 2% agarose gel containing phosphate buffered saline (PBS) at pH 7.40, 3 mM NaN3 and stored at 4°C until used. The amount of iron injected into the mice (in 100 μl of PBS) was 1.52 μg for the anti-AβPP-SPIONs and 7.07 μg for the control, anti-Tau SPIONs.
Histology
The fixed brains were embedded in paraffin, sectioned into 7 μm thick slices, and mounted on glass slides. Immunohistochemistry to detect Iba-1 was performed by Tricore Reference Laboratories, Inc. (Albuquerque, NM), a CAP-certified clinical laboratory, using antibodies described above (See Reagents and Antibodies). Digital images of the brain sections were taken with the aid of a spatially-calibrated Zeiss Axiostar-plus microscope equipped with an Axiocam IC3 firewire camera and Zeiss AxioVs40 Software.
Fluorescence microscopy of activated microglia
Paraffin embedded brain sections were rehydrated by progressively immersing them in Hemo-De, 95% EtOH, 70% EtOH, and finally 0.1 M PBS. Antigens were retrieved by placing the slides in 6.0 pH 0.01 M sodium citrate buffer with heating to 90°C for 20 min. After cooling to room temperature, the slides were stained with Thioflavin-S by the following method: A fresh, aqueous, 0.5% (w/v) Thioflavin-S solution was prepared, filtered through a 45 μm filter and applied to the slides, which were then incubated at room temperature for 5 min. The slides were rinsed with 70% ethanol, rehydrated in double-distilled water at room temperature for 5 minutes, and air-dried. After rehydrating with 0.1 M PBS for 5 min, the slides were blocked with 0.1 M PBS containing 6% normal donkey serum for 45 min and then incubated overnight with rabbit anti-Iba-1, diluted 1 : 400, at 4°C in a humidity chamber. The next day the slides were washed three times, for 5 min each, with 0.1 M PBS. The secondary antibody, rhodamine-conjugated donkey anti-rabbit IgG, was diluted with 0.5% BSA in 0.1 M PBS to 1 : 200 under light-restricted conditions. 100 μl of this secondary antibody solution was applied to each brain slice for 2 h in a light-tight container at room temperature. The slides were then rinsed three times with 0.1 M PBS and twice with double-distilled water. Vectashield with DAPI was applied, and the slides were cover-slipped and sealed for imaging. Images were taken with a Zeiss Axioskop 2 MOT equipped with a Zeiss AxioCam and a Prior Lumen 200 fluorescence lamp at the University of New Mexico Shared Microscopy Resource (http://hsc.unm.edu/crtc/microscopy). Images were processed using Slidebook (Denver, CO, USA).
Confocal images were taken on a laser scanning LSM510 META Confocal Microscope (Carl Zeiss MicroImaging GmbH, Germany) also at the UNM Shared Resource and processed using Zen (Carl Zeiss MicroImaging GmbH, Germany).
Magnetic resonance imaging
MRI studies of this line of transgenic mice were carried out at a magnetic field strength of 9.4 Tesla at the Center for Magnetic Resonance Research at the University of Minnesota. The optimal sequence for plaque detection, free from artifacts or signal blooming, was a multiple–asymmetric spin echo protocol which gave T2-weighted images with a small amount of T2*-weighting [14, 15]. A receive-only surface coil was used with a matrix of 256 × 96 pixels of 60 μm each (zero-filled to 30 μm each during post-processing) and with 32 slices, each 120 μm thick, resulting in an axially-sampled region 3.84 mm thick approximately centered on the bregma. Plaques appeared as hypointense localized regions several pixels in diameter in the brain images due to the decreased T2 value of the plaques relative to the surrounding tissue. 192 MRI slices were analyzed by counting plaques in each slice, and by computing the statistical significance of the intensity in the hypointense plaque core versus the noise level in the surrounding tissue. This latter method produced a statistic commonly called a Z-score (or contrast to noise ratio), which is the number of standard deviations the MRI signal decreased in the plaque’s core versus the background noise in image of the surrounding tissue:
Only plaques four or more pixels in area with Z-scores greater than 2.5 were considered, which implies a p-value of 0.006, i.e., there was less than a 0.6% probability that a given hypointense region resulted solely from noise in the image. The method used for Z-score measurement is graphically illustrated in the Supplementary Fig. 1 of [20].
Superparamagnetic iron oxide nanoparticle (SPION) modification
The SiMAG-TCL SPIONs were labeled with antibodies according to the manufacturer’s suggested protocol as previously described [20]. Briefly, 5 mg of nanoparticles were activated with EDC and Sulfo-NHS in double-distilled water. 25 μl of the antibody (either anti-AβPP or anti-Tau) was added to the activated nanoparticle solution and mixed on a rotating mixer for 2 h at room temperature. The nanoparticles were washed, resuspended in 120 μl of PBS containing 0.5% fetal bovine serum and stored at 4°C. The iron concentration of the resulting nanoparticle solution was determined by the FerroZine Iron Assay method [57]. Aggregation testing of antibody labeled nanoparticles using a Superconducting Quantum Interference Device Magnetometer showed no aggregation of these modified SiMAG nanoparticles for several years when stored at 4°C. The SPIONs had an iron oxide core diameter of 9.5 ± 1.0 nm by transmission electron microscopy, with a nominal hydrodynamic diameter of 50 nm as reported by the manufacturer. By dynamic light scattering measurements using a Zetatrac (Microtrac Inc., Largo, FL, USA) these SPIONs had a zeta potential of −42 mV, indicating a positive surface charge, which favored passage through the BBB [20].
Image analysis
Plaque number, radii, and areal density were measured from CCD images of the brain sections stained for Aβ or with thioflavin-S with the aid of ImageJ software [58] by thresholding and conversion of the images to binary images. The areas, A, were converted to radii by r = Sqrt[A/π]. The areal density of activated microglia was measured from CCD images of fluorescence micrographs of Iba-1 stained brain sections. The radial distributions of activated microglia were measured on spatially calibrated fluorescence micrographs of Iba-1 stained brain sections using the center of the thioflavin-S stained plaque as the point of reference and the center of the DAPI-stained microglial nucleus as the endpoint. A total of 651 optical images from the brains of 20 animals (5 control mice, 59 images; 8 resveratrol-treated mice, 268 images; and 7 LD55 treated mice, 324 images) were measured using SlideBook, ImageJ, and MaximDL (Diffraction Limited, Ottawa, Canada). The 192 MRI slices were analyzed with the aid of ImageJ, MaximDL, and Mathematica® (Wolfram Research, Champaign, IL, USA). The 3D plaque distribution data were embedded within a Mathematica-rendered surface plot of the mouse brain generated from coordinates obtained from the Allen Institute for Brain Science (http://www.alleninstitute.org). Briefly, the brain coordinates were stripped of interior points to produce the set of surface points that were then rendered using Delaunay tetrahedra (TetGen Delaunay). The 3D models of plaque and microglial spatial distributions were generated from the optical measurements with the aid of Mathematica. The MRI-derived 3D plaque distribution data in the presence of anti-AβPP SPIONs shown in Fig. 9C were redrawn from Fig. 4D–F of [20] so that the reader might have a self-contained direct comparison contained within this paper without having to refer to the literature. For the same reason, the MRI-derived Z-score distributions in the absence of drug treatment shown in Fig. 11A, B were redrawn from Fig. 5 of [20] so that a direct comparison could be made between drug-treated and untreated animals without having to refer to the literature.
Fig. 9.
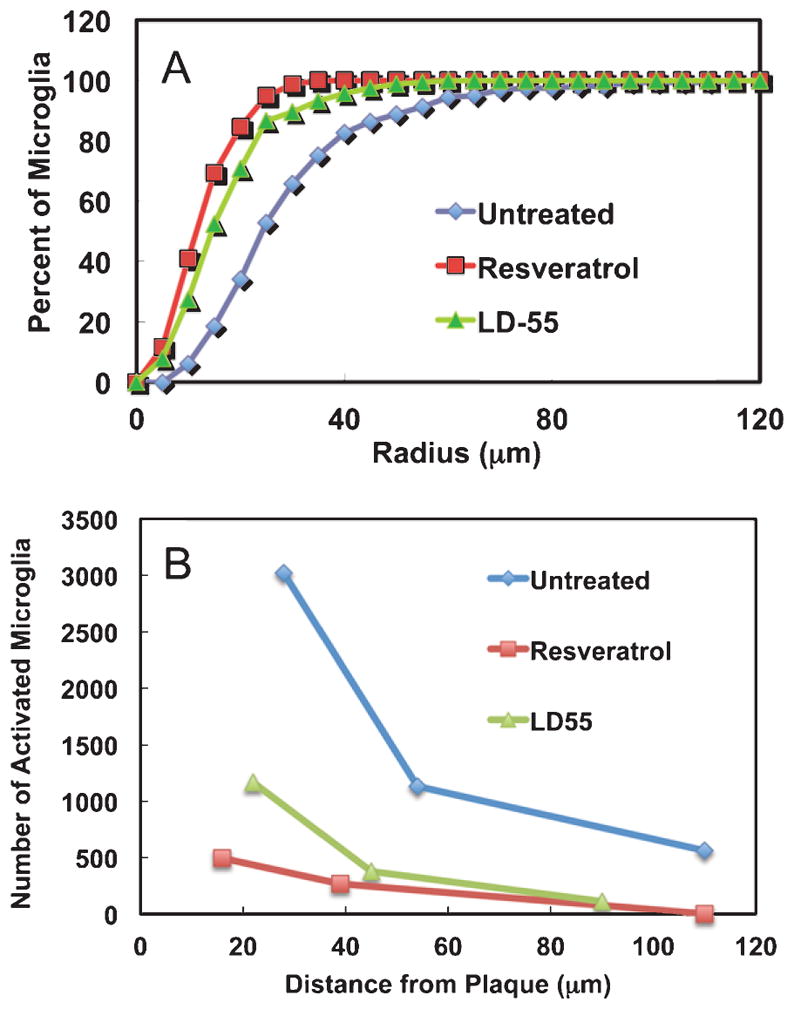
Effect of drug treatment on the radial distributions of activated cortical microglial cells in the brains of AβPP/PS-1 transgenic AD mice. A) Integral distribution of the percent of activated cortical microglia as a function of the distance from the center of a plaque in untreated, positive control AD mouse brain (Untreated: Blue diamonds; radius encompassing 50% of the total = 32 μm) and in the brains of AD mice treated with either resveratrol (Resveratrol: Red squares; 50% radius = 17 μm) or LD55 (LD55: Green triangles; 50% radius = 24 μm). Note that drug treatment reduces the proximal halo of activated microglia around the plaques. B) The number of microglia surrounding plaques as a function of distance from the nearest plaque in untreated, positive control AD mouse brain (Untreated: Blue diamonds) and in the brains of AD mice treated with either resveratrol (Resveratrol: Red squares) or LD55 (LD55: Green triangles). Data taken from the three integrals of the Gaussian fits shown in Fig. 4A, C, F. Note that drug treatment uniformly reduces the halo of activated microglia around the plaques.
Fig. 11.
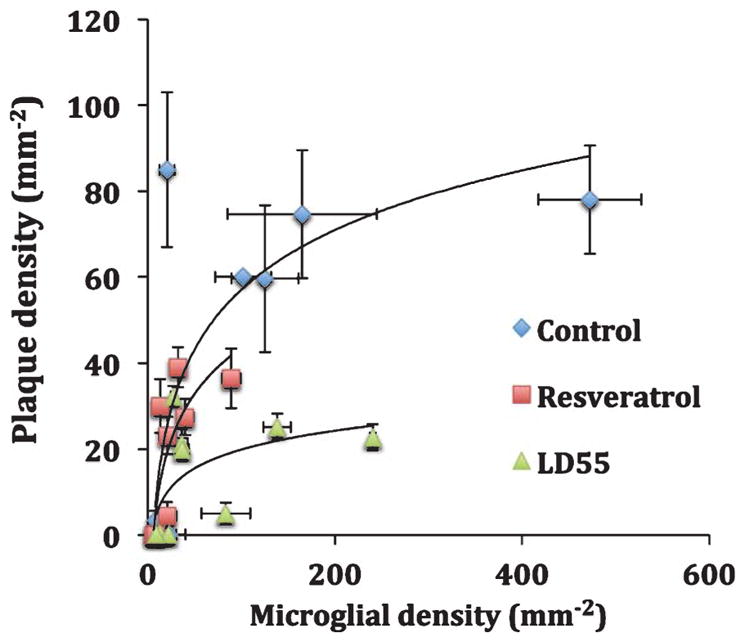
Effect of drug treatment on the relationship between plaque and activated microglial areal density in the brains of AβPP/PS-1 transgenic AD mice. Blue diamonds: Control, untreated mice; Red squares: resveratrol-treated mice; and Green triangles: LD55 treated mice. Shown are the means and standard errors for n = 5–8 mice (see methods).
The effects of drug treatment were presented in the Tables as a treatment ratio, R = T/U, which was the ratio of the number of measured plaques or activated microglia per region in the brains from drug-treated mice to those in the control, untreated mice. A treatment ratio less than one corresponded to a lowering of the measured plaques or neuroinflammation. Therefore R was the reciprocal of the fold reduction observed. Similarly, a SPION enhancement ratio was computed as the number of MRI-detected plaques in the presence of SPIONs to that without SPIONs. A SPION enhancement ratio greater than one indicated that the MRI conspicuity of the plaques was increased by SPION treatment.
RESULTS
Histological examination of AβPP/PS1 transgenic mouse brains
At age 6 weeks, the 36 transgenic (Tg) AD mice were split into three groups of 12 each: a control, untreated group fed a regular mouse diet, and two other groups fed the same diet formulated with 100 ppm (0.01% by weight) of either resveratrol or LD55. Resveratrol was used as a positive control since it had previously been reported to lower plaque accumulation in Tg mouse models of AD in a region-specific manner [55, 56] and is known to modulate microglial activation [59, 60] through inhibition of NF-κB [43]. After 12 months of treatment, the mice were either sacrificed directly, or injected with anti-AβPP, or control anti-Tau, SPIONs, according to our published procedures [20] and sacrificed 24 h later. The brains were then removed and fixed in formalin for MRI and optical histology.
Histological examination of the brains from the Tg mice was performed using thioflavin-S to stain the Aβ plaques, a primary antibody against Iba-1 to reveal activated microglia, and DAPI to stain the cell nuclei. Fluorescence microscopy of whole brain sections (Fig. 2) revealed blue-green Aβ plaques and red activated microglia in these mice. The brains from control, untreated mice had large numbers of plaques located in the olfactory bulb, cortex, hippocampus, and cerebellum (Fig. 2A). Treatment of the mice with either resveratrol or LD55 led to a dramatic reduction in plaque areal density which is qualitatively shown in Fig. 2B, C. This result is more evident at higher resolution, as shown in the insets in Fig. 2 and in Fig. 3D–F. Along with this reduction in plaques, we observed a concomitant lowering of activated microglia (compare the inset in Fig. 2A with those in Fig. 2B, C). A close examination of the micrographs also showed an association of the activated microglia with the plaques.
Fig. 2.

Fluorescence microscopy of AβPP/PS1 Tg AD mouse brain in sagittal cross-section. A) A control AβPP/PS-1 transgenic stained for plaques with Thioflavin-S (Green), with anti-Iba-1 to show activated microglia (Red), and DAPI (Blue) to show the cell nuclei. B) A whole brain from an AβPP/PS-1 Tg AD mouse treated with resveratrol (stained as in A). C) A whole brain from an AβPP/PS-1 Tg AD mouse treated with LD55 (stained as in A). Note the reduction in plaque (Green) and activated microglia (Red) in B & C, which is particularly evident in the insets.
Fig. 3.

Histological examination of the effects of resveratrol and LD55 on plaque formation and microglial activation. A) Optical microscopic image of a brain section from a control AD mouse, without drug treatment, immunohistochemically stained for Aβ. Note the central plaque and the Aβ fibrils. The scale bar is 20 μm long. B) Optical microscopic image of a healthy, non-AD control mouse without drug treatment immunohistochemically stained for Aβ showing no plaque formation. The scale bar is 10 μm long. C) Optical microscopic image of a control AβPP/PS-1 Tg AD mouse brain (as in A) immunohistochemically stained for Iba-1 showing the activated microglia surrounding an Aβ plaque. The scale bar is 10 μm long. D) Confocal microscopic image of a brain section from an AD mouse without drug treatment, stained as in Fig. 2A–C. Note the clustering of the activated microglia around the Aβ plaque and how their processes penetrate into the plaque and surround it. Amyloid is visible in the cytoplasm of the microglia. The scale bar is 10 μm long. E) Confocal microscopic image of a brain section (stained as in D) from an AD mouse treated with resveratrol. The scale bar is 10 μm long. F) Confocal microscopic image of a brain section (stained as in D) from an AD mouse treated with LD55. Note the smaller plaque radius (Green) and the attenuation of microglial activation (Red) in both E and F as compared with D. The scale bar is 10 μm long.
Higher resolution microscopy of brain sections showed the classic immunohistochemical pattern for Aβ plaques (Fig. 3A), which were absent in brain sections from wild-type mice (Fig. 3B). Immunohistochemical staining for Iba-1 also showed (Fig. 3C) the activated microglia surrounding the plaques. Fluorescence confocal microscopy of the brain sections stained as in Fig. 2 resulted in the observation of the thioflavin-S positive plaque cores and fibrils (Fig. 3D–F), the anti-Iba-1 positive activated microglia, and the microglial nuclei. There appeared to be a physical association of the activated microglia with the plaques, and although the microglia cells did not appear to reside inside the plaque cores, their processes penetrated into the plaque’s fibrillar periphery. Treatment of the AβPP/PS-1 transgenic AD mice with either of the NF-κB inhibitors, resveratrol (Fig. 3E) or LD55 (Fig. 3F), led to a reduction in the plaque-associated, activated microglia and a shrinkage of the plaques. A detailed, regional, quantitative analysis will be presented below.
MRI-detected plaque distribution in the brains of AβPP/PS1 transgenic mice
MRI at 9.4 T was used to show that we could indeed detect plaques without the aid of a contrast agent, as has been extensively reported earlier ([20] and references cited therein). MR images from the brains of untreated mice (Fig. 4A) displayed an average of 347 plaques per 3.84 mm axially-sampled brain region, with an average contrast to noise ratio (Z score) of 5.1 (Table 1). The representative MR image in Fig. 4A showed 16 MRI-detected plaques in this 130 μm-thick slice. Treatment of the mice with resveratrol lowered the MRI-detected plaque count 4-fold to 4 in the representative slice shown in Fig. 4B, while the average decrease over the entire 3.84 mm sampled brain region was 6.3-fold, resulting in a treatment ratio of 0.16 (Table 1), which is the ratio (R = T/C) of the plaque density in the drug treated group to that in the control, untreated animals.
Fig. 4.

Effect of drug treatment on plaque density in SPION-enhanced 9.4 T MRI of the brains of AβPP/PS-1 transgenic AD mice. A) MRI of control, untreated brain showing 16 plaques in this slice. B) Image of the brain from an animal treated with resveratrol showing four plaques in this slice. C) MRI of a control, untreated brain from an animal injected with anti-AβPP conjugated SPIONs showing 32 plaques in this slice. D) Image from the brain of an animal treated with LD55 and injected with anti-AβPP conjugated SPIONs showing four plaques in this slice.
Table 1.
MRI detection of plaques in control and drug-treated Tg mouse brain, and the enhancement by SPIONs. The treatment Ratio (T/C) is the ratio of plaques detected in the resveratrol and LD55-treated (T) mice versus the untreated controls (C)
| MRI-detected plaques
|
SPION-enhancement Ratio | Treatment Ratio (T/C)
|
|||||||
|---|---|---|---|---|---|---|---|---|---|
| No SPIONs
|
+SPIONs
|
||||||||
| Number | <Z-Score> | Zmax | Number | <Z-Score> | Zmax | Control | +SPIONs | ||
| Untreated | 347 ± 45 | 5.1 ± 0.2 | 24 ± 4 | 668 ± 86 | 8.0 ± 0.1 | 41 ± 3 | 1.93 | – | – |
| Resveratrol | 55 ± 8 | 5.2 ± 0.2 | 12 ± 3 | 94 ± 14# | 8.2 ± 0.2# | 21 ± 5# | 1.71# | 0.16 | 0.14# |
| LD-55 | 88 ± 12# | 4.6 ± 0.6# | 15 ± 2# | 209 ± 20 | 7.6 ± 1.3 | 24 ± 4 | 2.38 | 0.25# | 0.31 |
SPION enhancement of MRI-detected plaques in the brains of AβPP/PS1 transgenic mice
The conspicuity of the plaques markedly increased, as previously reported [20], when the mice were injected with BBB-permeable anti-AβPP-conjugated SPIONs (Fig. 4C). This was revealed by the Z-score increase for the plaques from 5.1, in the non-SPION-injected mice, to 8.0 in the brains from the SPION-injected mice (Table 1). The number (32) of MRI-detected plaques in the representative image slice from the brain of a SPION-injected mouse shown in Fig. 4C were greater than those (16) found without SPIONs (Fig. 4A) in the 3.84 mm thick region sampled. The average SPION enhancement ratio of 1.93 (Table 1) reflected the increase in the number of MRI-detected plaques across the brain and indicated that these SPIONs penetrated the BBB [20] and were therefore useful as targeted contrast agents that could be used to determine the response of Aβ plaques in the brains of these AβPP/PS1 Tg mice to drug treatment. The effect of treatment with LD55 on the plaque density could readily be obtained by using the anti-AβPP conjugated SPIONs to increase the plaque detection efficiency. SPION-enhanced MRI showed that the number of MRI-detected plaques in a representative image slice from an LD55-treated mouse dropped 8-fold, from 32 (Fig. 4C) without drug treatment to only 4 (Fig. 4D) when the mouse was fed LD55 at 100 ppm for 12 months. The average SPION enhancement ratio for the LD55 treated animals was 2.38 (Table 1), again showing the usefulness of SPIONs for increasing the conspicuity of the plaques.
The 3D distribution of MRI-detected plaques in the Tg mouse brain
The MRI studies produced hundreds of images for measurement, like those shown in Fig. 4. It was impractical to include these large numbers of images here, so we sought a method for extracting the plaque parameters from the MR images so that these could be displayed in summary form within the brain. We wrote a Mathematica® notebook to display the entire three-dimensional MRI-detected plaque distribution from a single brain [20] within a surface-rendered mouse brain. The complete, 3D plaque distributions produced with the aid of this notebook are shown in Fig. 5 in which the diameters and RGB colors of each plotted sphere were proportional to the Z-score of the plaque located at that set of (x, y, z) coordinates measured from the MR images. Red corresponded to the lowest Z = 2.5, while green, blue, and purple encoded Z-scores up to 20 using a rainbow scale. These distributions may be rotated and viewed in 3D with the aid of the Mathematica® CDF player as a browser add-in (see Supplementary material for details).
Fig. 5.

Three-dimensional distribution of SPION-enhanced, MRI-detected plaques in the brains of AβPP/PS-1 transgenic AD mice: Effect of drug treatment. A) Control 3D distribution of plaques in the brain of a mouse without drug treatment showing 327 plaques. B) 3D distribution of plaques in the brain of a mouse treated with resveratrol showing 55 plaques. C) Anti-AβPP SPION-enhanced 3D MRI distribution of plaques in the brain of a mouse without drug treatment showing 668 plaques. D) Anti-AβPP SPION-enhanced 3D MRI distribution of plaques in the brain of a mouse treated with LD55 showing 214 plaques. The size and color of each sphere is set in a rainbow scale and is proportional to the Zscore of the plaque located at that set of (x, y, z) coordinates measured from the MR images. Red corresponds to Z = 2.5, while purple codes Z = 20. The diameter of each sphere gives its Z-score in these coordinates. Note how drug treatment led to a 3–6-fold reduction in MRI detected plaques and SPION treatment markedly increased the conspicuity of the plaques.
Application of this Mathematica® code to the MRI data from a representative transgenic mouse brain without drug, contrast agent, or SPION treatment (a slice of whose MR image is given in Fig. 4A) illustrated (Fig. 5A) the detection of a total of 327 Aβ plaques, whose average Z-score was Z = 5.1 (Table 1). In accord with the optical histological results shown in Fig. 10A (vide infra), a large number of MRI detected plaques were found in the cortex, caudoputamen, hippocampus, and thalamus of this brain (Fig. 6A). The more distal portions of this brain were not imaged because they were outside the MR surface coil’s limited axial field of view (3.84 mm).
Fig. 10.

Effect of drug treatment on the regional distribution of plaque and activated microglial densities in the brains of AβPP/PS-1 transgenic AD mice. A) Plaque areal density and (B) Areal density of activated microglia, in control (Blue) Resveratrol-treated (Red) and LD55 treated (Green) AD mice. Shown are the means and standard errors for n = 5–8 mice (see methods).
Fig. 6.

Regional distribution of SPION-enhanced, MRI-detected plaques in the brains of AβPP/PS-1 transgenic AD mice: Effect of drug treatment. A) MRI data from brains without SPION enhancement revealed both control plaques (Blue bars) and the decrease in plaque number upon treatment with resveratrol (Red bars). Shown are the means and standard errors of the means (n = 6). B) Anti-AβPP SPION-enhanced MRI of the control, untreated mouse brains revealed large numbers of plaques (Blue bars) in the cortex, caudoputamen, and thalamus, which markedly decreased upon treatment of the mice with LD55 (Green bars).
Effect of resveratrol on the 3D distribution of MRI-detected brain plaques
We next turned to an examination of the result of resveratrol treatment on the 3D distribution of MRI-detected plaques in the Tg mouse brain without contrast agents. Among its several effects in biological tissues, resveratrol has been shown by us [43] and others [40, 44] to inhibit NF-κB and to lower plaque density in Tg mice [55]. We therefore measured the plaques in the brains from mice treated with resveratrol in order to show that high-field MRI could not only detect plaques [14–20], but that it was also useful for monitoring drug treatments. The 3D plaque distribution in the brain from an animal fed 100 ppm resveratrol for 12 months (Fig. 5B) showed a ~6-fold reduction in plaque number to 55 compared to the control value of 347 (Table 1; n = 3, p < 0.0002 with respect to the untreated Tg controls). It was interesting to note that MRI of resveratrol treated mice showed predominantly the remaining higher Z-score thalamic plaques.
SPION enhancement of the 3D distribution of MRI-detected plaques
As we have shown previously [20], injection of amyloid-targeted, BBB-permeable SPIONs into the circulation of Tg AD mice led to an approximate doubling (Table 1) of the MRI-detected plaques (compare Fig. 4A with 4C). The 3D MR image of a brain (Fig. 5C) from a representative control, non-drug-treated Tg AD mouse injected with SPIONs showed a significant increase in both the number, from an average of 347 to 668 (p < 0.0001 versus control) and the Z-score, from 5.1 to 8.0 (p < 0.0001 versus control) of the detected lesions compared with the control transgenic mice without SPION injection (Fig. 5A; Table 1). Most of the MRI-detected lesions appeared in the cortex, but by comparing the data in Fig. 5A with that in Fig. 5C, it can be appreciated that the SPIONs also enhanced the MRI conspicuity (Z-score) of plaques in other brain areas as well. Injection of control, anti-Tau SPIONs targeted with the same isotype antibody as the anti-AβPP SPIONs into the circulation of Tg AD mice produced 3D plaque distributions indistinguishable in number and Z-score from the controls, showing that our targeting of the amyloid plaques was robust and specific [20].
SPION enhancement of the effect of LD55 on the MRI-detected 3D plaque distribution
LD55 was synthesized [43] as a resveratrol analogue that lacked resveratrol’s hydroxyl groups (Fig. 1) in order to determine if resveratrol’s putative antioxidant properties played a dominant role in its reported action on plaque density. In fact, we found that LD55 was a significantly more potent inhibitor of NF-κB than resveratrol [43], and since resveratrol has been found to lower plaque density in Tg AD mice (vide supra and [55]), we sought to measure the effect of LD55 treatment on the distribution of MRI-detected plaques in the Tg mouse brain using our targeted SPIONs. The 3D distribution of MRI-detected plaques in the brains of mice fed 100 ppm LD55 for 12 months and treated with anti-AβPP SPIONs for 24 h before sacrifice (Fig. 5D) showed a significant (3.2-fold) decrease in the total number of SPION-enhanced, MRI-detected plaques (Table 1) from 668 to 209 (p < 0.0009; compare Fig. 5C with 5D) and an increase in their average Z-score from 4.6 to 7.6 (Table 1; p < 0.0001). This increase in the Z-score, against a lowering of the number of MRI-detected plaques, shows that our amyloid-targeted SPIONs are efficacious for measuring the effects of drugs on plaque density in Tg AD mice.
Effect of NF-κB inhibitors on the regional distribution of MRI-detected plaques
Even though the MR imaging did not sample the entire brain volume, it was still possible to measure the regional distribution of plaques within the 3.84 mm axially observed region. The majority (~70%) of the MRI-detected plaques, without SPION enhancement, were found in the cortex (Fig. 6A), while the remainder were distributed between the caudoputamen (~5%), hippocampus (~14%), and the thalamus (~10%). Treatment with resveratrol lowered the density of the MRI-detected plaques by 10-fold in the cortex, and by 19-fold in the caudoputamen, while completely eliminating these plaques in the hippocampus (Table 3). Plaques in the thalamus, on the other hand appeared to resist resveratrol’s influence, experiencing only a 1.2-fold decrease (Table 3). This cortical reduction was larger than that seen in the optical plaque data (Table 3; vide infra; Fig. 10A) where a ~2-fold reduction in plaque density was observed. It appears that MRI is most sensitive to the largest plaques, while the optical techniques reveal the entire ensemble of plaques, regardless of size.
Table 3.
Effect of resveratrol treatment on the Aβ plaques in Tg mouse brain
| Resveratrol dose (ppm) | Brain region | Aβ plaques (control) | Aβ plaques (treated) | Treatment ratio (T/C) | Method | Source |
|---|---|---|---|---|---|---|
| 100 | Caudoputamen | 19 | 1 | 0.05 | MRI | Fig. 6A |
| 100 | Cortex | 244 | 22 | 0.09 | MRI | Fig. 6A |
| 100 | Cortex | 73/mm2 | 39/mm2 | 0.53 | Optical | Fig. 10A |
| 2000 | Cortex | 0.92% | 0.48% | 0.52 | Optical | [55] |
| 3500 | Cortex | 9/section | 4.7/section | 0.58 | Optical | [56] |
| 100 | Hippocampus | 48 | 0 | 0 | MRI | Fig. 6A |
| 100 | Hippocampus | 77/mm2 | 36/mm2 | 0.48 | Optical | Fig. 10A |
| 2000 | Hippocampus | 0.41% | 0.41% | 1.0 | Optical | [55] |
| 3500 | Hippocampus | 6/section | 6/section | 1.0 | Optical | [56] |
| 2000 | Hypothalamus | 0.14% | 0.014% | 0.10 | Optical | [55] |
| 100 | Thalamus | 36 | 30 | 0.83 | MRI | Fig. 6A |
| 100 | Thalamus | 60/mm2 | 27/mm2 | 0.45 | Optical | Fig. 10A |
| 2000 | Striatum | 0.13% | 0.012% | 0.11 | Optical | [55] |
| 100 | Whole Brain | 104 | 36 | 0.35 | Optical | Fig. 8 C,E and Table 2 |
| 100 | Whole 3.84 mm region | 347 | 55 | 0.16 | MRI | Table 1 |
| Average = | 0.23 ± 0.34 | MRI | This work only | |||
| Average = | 0.45 ± 0.08 | Optical | This work only |
Injection of anti-AβPP conjugated SPIONs into the mice resulted in an approximate doubling in the number of MRI-detected plaques in all MRI-sampled brain regions (Table 1; Fig. 6B). SPION-enhanced MRI also showed that treatment of the mice with LD55 reduced the total number of MRI-detected plaques in the cortex by ~3-fold with similar reductions seen across the other MRI-sampled brain regions (Table 4; Fig. 6B). However, since SPIONs were present, the average Z-score increased to 7.6 from the control value of 4.6 (Table 1; p < 0.02). The magnitude of these reductions closely resembled those seen in the optically-measured data (Table 4; vide infra; Fig. 10A). It is clear that MRI can be used to non-invasively monitor plaque burden and that it is sensitive to alterations in this burden resulting from drug treatment. SPION enhancement is an important advance in MRI detection of plaque burden since it reveals a larger number of plaques than found with unenhanced MRI, and it also reveals the effects of drug treatment.
Table 4.
Effect of LD55 (100 ppm) treatment on Aβ plaques in Tg mouse brain
| Treatment (± SPIONs) | Brain region density (control) | Aβ plaque density (treated) | Aβ plaque | Treatment ratio (T/C) | Method | Source |
|---|---|---|---|---|---|---|
| LD55 | Cortex | 73/mm2 | 32/mm2 | 0.44 | Optical | Fig. 10A |
| LD55 | Hippocampus | 77/mm2 | 24/mm2 | 0.31 | Optical | Fig. 10A |
| LD55 | Whole Brain | 104 | 34 | 0.33 | Optical | Fig. 8 C,E and Table 2 |
| LD55 + SPIONs | Caudoputamen | 21 | 2 | 0.09 | MRI | Fig. 6B |
| LD55 + SPIONs | Cortex | 453 | 145 | 0.32 | MRI | Fig. 6B |
| LD55 + SPIONs | Hippocampus | 101 | 7 | 0.07 | MRI | Fig. 6B |
| LD55 + SPIONs | Thalamus | 93 | 55 | 0.59 | MRI | Fig. 6B |
| LD55 + SPIONs | Brain slice displayed | 32 | 4 | 0.13 | MRI | Fig. 4C&D |
| LD55 + SPIONs | Whole 3.84 mm region | 668 | 209 | 0.31 | MRI | Fig. 5D and Table 1 |
| Average = | 0.25 ± 0.20 | MRI | ||||
| Average = | 0.36 ± 0.07 | Optical |
Integral Z-score distributions for MRI-detected plaques
Examination of the distribution of Z-scores from the MRI data among brains from the transgenic mice imaged for this study revealed interesting trends. The integral distribution of Z-scores (Fig. 7) provided a good view of both the total number of plaques and the maximum Z-score value attained in the various brains. For the control Tg AD animals, untreated with either drugs or SPIONs, the total number of MRI-detected plaques per 3.84 mm axial brain region was 347, with a mean Z-score of 5.1, and a maximum Z-score of 24 (Table 1; Fig. 7A, Blue curve). Treatment with resveratrol (without SPIONs) lowered the number of MRI-detected plaques 6-fold and the maximum Z-score to only 12 (Table 1; Fig. 7A, Red curve). Treatment of these animals with resveratrol appeared to selectively remove the high-Z plaques, except in the thalamus (Fig. 6A).
Fig. 7.

Effect of drug treatment on the integral distribution of Z-scores from SPION enhanced MRI of brains from the AβPP/PS-1 Tg transgenic AD mice. A) Integral frequency distribution of the MRI Z-score data in the absence of SPION injection. Blue diamonds indicate data from control mice without drug treatment; Red squares denote the data from mice treated with resveratrol. Drug treatment lowers both the number of plaques (see text) and their maximum Z score from 24 to 12. B) Integral frequency distribution of the MRI Z-score data from mice injected with antihuman AβPP conjugated SPIONs. Blue squares indicate data from mice injected with anti-human AβPP conjugated SPIONs, but without drug treatment; Green triangles reflect treatment with both LD55 and anti-human AβPP conjugated SPIONs. Note how drug treatment led to a 3–6-fold reduction in MRI detected plaques and SPION treatment increased the conspicuity of the plaques; the SPION injected mice displayed twice as many lesions (B; Blue squares) as the control mice (A; Blue diamonds).
The presence of anti-human AβPP antibody-conjugated SPIONs increased both the total number of MRI-detected plaques (Fig. 7B; Blue curve) and the maximum Z- score for the mice by ~1.7-fold to 41 (Table 1; p < 0.02) for the mice not treated with drugs. Treatment with LD55 (and SPIONs) lowered the MRI-detectable plaques by 3-fold, from 668 to 209, and reduced the maximum Z-score to 24 (Fig. 7B; Green curve). Once again, treatment of these animals with the plaque-lowering drug, LD55, appeared to selectively remove the high-Z plaques, except in the thalamus (Fig. 6B).
Optical measurement of plaques in AβPP/PS1 Tg mouse brains
Although the data presented above indicate that SPION-enhanced MRI had significant potential for non-invasively studying the effects of drugs on the distribution of plaques in AD brains, we believed that the results of this novel application of MRI should be vetted, as far as possible, by comparison against another, well-established technique. Also, due to temporal and economic constraints, we were not able to use MRI to measure all of the potential combinations of drug treatments and SPIONs. Therefore, we turned to optical microscopy, which has been used for more than 100 years in the study of AD, as a standard against which the MRI results could be compared for all of the drug treatments. Optical microscopy had the advantages of superior resolution and simultaneous interrogation of brain sections for multiple specific molecules of interest. In particular, it was of considerable interest to examine the effects of resveratrol and LD55 on not only plaque density, but neuroinflammation as well. 3D models derived from the optical data could also be used to inform the choice of future targets for the SPIONs.
The qualitative characteristics of both plaque and activated microglial distribution in Tg AD mouse brains were well-represented by the optical histology shown in Fig. 3, but considerable additional information could be gleaned from a quantitative analysis of brain section microscopy. Parameters of great importance for the MRI measurements were the actual sizes of the plaques themselves, and the extent of the microglial halo surrounding the plaques. Gaussian fits to measurements of the plaque radii derived from Thioflavin-S staining (Materials and Methods: Image Analysis) gave mean values of 8.5 μm, with a width of 5 μm (Table 2; Fig. 8A; Blue curve). These plaque sizes compared favorably with data measured postmortem from the brains of humans diagnosed with AD [20]. The majority of the plaques (>90%) had areas less than 300 μm2 but there were plaques as large as 3554 μm2, which corresponded to MRI susceptibility shifting regions almost 70 μm in diameter. This is congruent with our MRI measurements that indicated the area of perturbed water surrounding a plaque was on the order of 2–4 pixels of 60 μm within the slice.
Table 2.
Properties of the Gaussians used to fit the radial distribution of optically-detected plaques and activated microglia in the untreated control, and drug-treated Tg mouse brains. R(50%) is the radius from the plaque at which the integral of the distribution contains half of the total microglia
| Microglia | R(50%) (μm) |
Plaques
|
||||||||||||||
|---|---|---|---|---|---|---|---|---|---|---|---|---|---|---|---|---|
| Proximal
|
Medial
|
Dista
|
||||||||||||||
| Treatment | Fraction of total |
Amplitude | Radius (μm) |
Width (μm) |
Fraction of total |
Amplitude | Radius (μm) |
Width (μm) |
Fraction of total |
Amplitude | Radius (μm) |
Width (μm) |
Amplitude | Radius (μm) |
Width (μm) |
|
| Untreated | 0.64 | 94 | 28 | 13 | 0.24 | 32 | 54 | 14 | 0.12 | 10 | 110 | 24 | 32 | 104 | 8.5 | 5 |
| Resveratrol | 0.64 | 23 | 16 | 9 | 0.35 | 11 | 39 | 10 | 0.01 | 0.1 | 110 | 24 | 17 | 36 | 7 | 3.5 |
| LD-55 | 0.7 | 40 | 22 | 12 | 0.23 | 13 | 45 | 12 | 0.07 | 2 | 90 | 24 | 24 | 34 | 7.2 | 4.1 |
Fig. 8.

Frequency distributions of plaque radii and the distances from the center of a plaque to the center of an activated microglial cell in cortical brain sections from AβPP/PS-1 transgenic AD mice. A) The blue points are the measured frequencies of plaque radii for a total of 1243 cortical plaques fitted to a Gaussian distribution with a mean of 8.5 μm and a width of 5 μm (Table 2). The red points are the measured distances from an activated microglia to the plaque center, while the red curve is a Gaussian fit with three components whose parameters are summarized in Table 2. The individual Gaussians are shown in green, while the residual of the fit is shown in purple. These and the following measurements were taken from 80 optical histology sections each, like those shown in Fig. 3D–F. B) A 3D model of the radial distribution of microglia (rainbow colored rings) surrounding a plaque (the central green peak) derived from the measurements in A, showing the physical association of proximal, medial, and distal populations of microglia to the plaque. The model parameters were derived from the measurements in (A) and are summarized in Table 2. C) Frequency distributions from mice treated with resveratrol; the colors and meanings are the same as in (A). The red curve is a Gaussian fit with three components summarized in Table 2. D) A 3D model of the radial distribution of microglia (rainbow colored rings) surrounding a plaque (the central green peak) derived from the measurements in C from animals treated with resveratrol. E) Frequency distributions from mice treated with LD55; the colors and meanings are the same as in (A). The red curve is a Gaussian fit with three components summarized in Table 2. F) A 3D model of the radial distribution of microglia (rainbow colored rings) surrounding a plaque (the central green peak) derived from the measurements in E from mice treated with LD55.
Optical measurement of microglial activation in AβPP/PS1 Tg mouse brains
Since the activated microglia appeared to surround the plaques and to be associated with them, we measured the distances from the center of a plaque to each of the Iba-1 stained microglia in the vicinity. The radial distribution of activated cortical microglia (Fig. 3D–F) suggested that the microglia surrounded the plaques but that no processes actually reached the dense core at the center. These impressions were confirmed by the measured radial distributions of cortical microglia surrounding a large number of plaques (Fig. 8A; Red curve). When 466 cortical microglial distances were measured in animals without drug treatment, the results showed (Fig. 8A) that less than 3% of the microglia were associated with the plaque core and that 50% of the activated microglia were contained within a ring with a radius of 32 μm (Table 2; Figs. 8A, B and 9A). The number of microglia at a given radius from the center of a plaque could be described by a sum of three Gaussians representing three rings of microglia (Table 2): a proximal ring 28 μm from the plaque core containing 64% of the total, a medial ring at 54 μm containing 24%, and a distal ring at 110 μm containing 12% (Fig. 8A). These features were used to generate a three-dimensional quantitative model of the plaques and the surrounding inflammatory cells (Fig. 8B). The proximal ring represented the halo of activated microglia closely associated with the plaques, and they were seen to surround, rather than to engulf the central plaques. The large distal ring of activated microglia would then constitute an attractive MRI target for anti-Iba-1 conjugated SPIONs. We have used this information to construct and use such anti-Iba-1 conjugated superparamagnetic FePt nanoparticles [63] to successfully image neuroinflammation in work to be reported separately.
Treatment with NF-κB inhibitors shrank the halo of cortical microglial activation
The effect on the halo of activated cortical microglia produced by treatment of the AβPP/PS-1 transgenic AD mice with our trans-stilbene inhibitors of NF-κB was to quantitatively reduce the number of the microglia associated with the plaques (Table 2; Fig. 8A, C, E). We fit the radial distribution of microglia in the brains of the drug treated mice to the sum of three Gaussians, whose parameters are given in Table 2. These fits were characterized by their amplitudes, mean radii, and widths, which enabled us to generate 3D quantitative models of the association of the activated microglia with the plaques (Fig. 8B, D, F). Treatment with resveratrol reduced the radius of the proximal microglial ring from 28 to 16 μm (Table 2; Figs. 8C, D and 9A) (n = 232), while similar treatment with LD55 reduced the radius of the proximal halo to 22 μm (Table 2; Figs. 8E, F and 9A) (n = 296) as also indicated by the change in the spatial dependence of the normalized integral distributions of microglia (Fig. 9A). Also seen is a 3- to 6-fold reduction in both the plaque and microglial numbers in the cortex (Fig. 8C, E) compared with the untreated mice (Fig. 8A) congruent with the MRI results presented earlier (Table 1; vide supra; Fig. 6).
In the face of a reduction of the proximal microglial halo one would expect that fewer activated microglia would be associated with plaques in the drug-treated animals than in the control, untreated cohort. The data in Table 2 as well as radial integration of the 3D Gaussian models in Fig. 8B, D, and F supported this expectation (Fig. 9B) where it was seen that both resveratrol and LD55 reduced the number of activated microglia as a function of distance at every measured point from the plaque center. It is interesting that activated microglia could be detected as far away as 110 μm from the plaque center in the control animals (Fig. 9B) and that treatment with either drug almost completely abolished this distal ring of activation (Table 2).
NF-κB inhibitors reduce plaques and activated microglia across the brain
Since cortical plaque formation in these AD transgenic mice was closely correlated with microglial activation, it was of interest to determine if the inhibition of the primary pro- inflammatory pathway involving NF-κB would alter this inflammation and what effect this would have on the plaque density and corresponding inflammation across the entire brain. One explanation for the cortical data in the previous section is that treatment with either resveratrol or LD55 lowers the number of activated microglia in the entire brains of the examined mice. We confirmed this by measuring the areal densities of both activated microglia and plaques in our animal cohort. The optical microscopy data showed (Fig. 10A) that treatment with resveratrol or LD55 lowered plaque density from an untreated value of 54 plaques/mm2 to 25 and 20 plaques/mm2 respectively, when an average was taken over the brain regions most heavily affected by plaques (the olfactory bulb, cortex, hippocampus, thalamus, and cerebellum; See also Tables 3 and 4). This was in line with the MRI results (Fig. 6) that showed a similar, profound drop in plaques upon drug treatment. This reduction in optically-detected plaques amounted to a factor of 3 (Treatment ratio = 0.33; Table 3) for resveratrol and 2.6–4.0 (Treatment ratio = 0.25–0.39; Table 4) for LD55.
Treatment with our trans-stilbene NF-κB inhibitors also led to an average 3.7 ± 0.2-fold reduction (average treatment ratio = 0.27; Tables 5 and 6) in activated microglial density that was seen across all of the affected brain regions (Fig. 10B); the reduction caused by resveratrol was statistically indistinguishable from that found for the LD55-treated mice. It should be noted that the brain region most heavily affected by neuroinflammation, the hippocampus, experienced a larger 4.8 ± 0.2-fold (average treatment ratio = 0.21; Tables 5 and 6) statistically-significant (p < 0.0001) reduction in activated microglial density than the other major brain structures.
Table 5.
Effect of resveratrol treatment on activated microglia in Tg mouse brain
| Resveratrol dose (ppm) | Brain region | Activated microglia (control) | Activated microglia (treated) | Treatment ratio (T/C) | Method | Source |
|---|---|---|---|---|---|---|
| 100 | Cortex | 99 | 16 | 0.19 | Optical | Fig. 10B |
| 3500 | Cortex | 10/plaque | 6/plaque | 0.60 | Optical | [30] |
| 100 | Hippocampus | 471 | 84 | 0.18 | Optical | Fig. 10B |
| 100 | Thalamus | 121 | 38 | 0.31 | Optical | Fig. 10B |
| 100 | Whole Brain | 136 | 34 | 0.25 | Optical | Fig. 8 C,E and Table 2 |
| Average = | 0.23 ± 0.06 | Optical | This work only |
Table 6.
Effect of LD55 treatment on activated microglia in Tg mouse brain
| LD55 dose (ppm) | Brain region | Activated microglia (control) | Activated microglia (treated) | Treatment ratio (T/C) | Method | Source |
|---|---|---|---|---|---|---|
| 100 | Hippocampus | 471/mm2 | 114/mm2 | 0.24 | Optical | Fig. 10B |
| 100 | Whole Brain | 136 | 55 | 0.40 | Optical | Fig. 8C, E and Table 2 |
| Average = | 0.32 ± 0.11 | Optical |
Relationship between plaques and microglia in all brain regions
The data presented so far suggest two additional questions: Does inhibition of NF-κB account for the reduction of plaque and microglial activation, and what is the relationship between both of these pathological features in the presence of NF-κB inhibitors. Since the data on plaque and microglial reductions with drug treatment show that both processes decrease in tandem, it was useful to examine their relationship. It is likely that plaques induce the activation of microglia; under these circumstances, one would expect to observe a direct correlation between the two. The data (Fig. 11) indicate that the areal densities of the plaques and the inflammatory cells are directly correlated; as the plaques increase so do the activated microglial cells, and vice versa. When either plaques or microglial are reduced by drug treatment the other is also concomitantly reduced for all major brain regions.
DISCUSSION
In the present study, we demonstrated that long-term dietary supplementation with a low dose of 0.01% (100 ppm by weight) of either of the two trans-stilbene inhibitors of NF-κB, resveratrol or LD55, produced substantial concomitant reductions in plaque density and microglia activation across the entire Tg AD mouse brain, including the hippocampus, indicating that there may be a correlation between microglial activation and plaque deposition and that inflammation may inhibit microglial mediated plaque clearance. Our novel trans-stilbene, LD55, achieved equal efficacy as resveratrol in lowering brain plaque density even though LD55 lacked the hydroxyl groups and antioxidant activity of resveratrol (Fig. 1).
Both the MRI and optical measurements showed that treatment with either resveratrol or LD55 led to profound reductions of 2-, to >15-fold (Treatment ratios of <0.07–0.50) in plaque density in the hippocampus (Tables 3 and 4; Figs. 6A, B and 10A). In the case of resveratrol, these findings differed significantly from the results obtained by others on Tg AD mice [30, 55, 56]. For example, when Karuppagounder et al. [55] fed Tg19959 mice 0.2% resveratrol (2000 ppm) by dietary supplementation (which the authors equated to a mouse dose of 300 mg/Kg), for ~7 weeks, beginning at seven weeks of age, a reduction in plaque loads was observed in certain areas of the brain, such as the cortex (−48%; R = 0.52) striatum (−89%; R = 0.11), and hypothalamus (−90%; R = 0.10), but no effect was observed on plaque load in the hippocampus (Table 3). In this study, the equivalent human dose was estimated to be 24 mg/Kg, or roughly, 1.7 g/day. In another study [56], AβPP/PS1 Tg mice were fed 0.35 % (3500 ppm) resveratrol (which these authors equated to a mouse dose of ~360 mg/Kg) in the diet for 15 weeks resulting in a 42% (R = 0.58) reduction in plaque number in the cerebral cortex with again no observed reduction in the hippocampus (Table 3).
A recent study by this group also demonstrated that oral administration of 0.35% (3500 ppm) resveratrol to 15 week old mice for 15 weeks lowered microglia activation in the cortex by about 40% (R = 0.60; Table 5) [30], whereas we observe a much larger treatment effect (R = 0.23 ± 0.06, Table 5). The major differences between our study and these previous studies included our low 0.01% concentration of resveratrol (and LD55) and the one-year exposure to these compounds, beginning with very young animals. Our results, using these low doses, showed a much larger reduction in inflammation encompassing the cortex, hippocampus and thalamus (Tables 5 and 6).
Our quantitative evaluation of plaques and activated microglia allowed us to conclude that activated microglia were physically associated with plaques, rather than dispersed throughout the brain. Although microglia interact with the fibrous portion of Aβ, it is not clear that they penetrate as far as the core of the plaque. By measuring plaque sizes and distances from the center of the plaques to the associated activated microglia, we observed that microglia surrounded the plaques but did not extend into the core of the plaques. In addition, treatment with either resveratrol or LD55 reduced the number of plaques, decreased the sizes of the plaques, and at the same time decreased the number of plaque-associated, activated microglia. In addition, the distribution of activated microglia around a plaque could be fit mathematically to quantitative, 3D mathematical models of both Aβ plaque density and microglial activation. These models were used to relate the trans-stilbene-induced reductions in these pathological markers to the spatial relationship between plaque and activated microglia. The activated microglia appeared in three concentric rings at different distances from the core of the plaques, with about 65% of the activated microglia contained within the first ring and only a small fraction (<3%) found near the plaque core (Table 2; Fig. 8). These models were also useful in interpreting the MRI results in terms of the fraction of plaques visible by this method.
It has been suggested that, although microglia can clear peripheral plaque fibrils, they lack the ability to dispose of the dense cores of plaques [5]. The microglia’s processes penetrate into the fibrilar material of the plaque itself, pushing almost to the core (Fig. 2A). Processes appear to attach to the fibrous tendrils of the plaque to begin the process of phagocytosis, after which the internalized amyloid can been observed by confocal microscopy within the cytoplasm of the microglia (Fig. 3D). Treatment with either resveratrol or LD55 reduced the average distance between the activated microglia and the core of the plaques (Table 2; Fig. 9A). This supports the idea that the rate of plaque deposition is a failure of flux and not of an inability of microglia to clear plaques [5, 61].
This is the first application of our novel BBB-permeable SPION technology [20] to the study of the effects of drug treatment on AD mice. SPION MRI showed plaque patterns which were confirmed using more traditional destructive optical methods. The small differences evident on comparing data between the plaques detected by the optical and the MRI methods in the caudoputamen and thalamus could be ascribed to the fact that the optical measurements were reported as areal densities in specific regions, while the MRI data were given as the total numbers of plaques per brain. The development of BBB-permeable SPIONs enabled us to non-destructively monitor the 3-dimensional distribution of plaques within the brain in ex vivo specimens, a feature that is not possible with optical methods. Our 3D Mathematica® plots provided dramatic, quantitative demonstrations of the effects of drug treatment.
Since MRI is a non-destructive, non-invasive technology that is routinely used to image the brains of living mice, our findings support the possibility of using MRI in vivo, without sacrificing the animals, to follow the development of plaques and their amelioration by drug treatment in a longitudinal fashion. Our BBB-permeable SPIONs can also be targeted to almost any site of interest in the brain. For example, recent work in our laboratory has successfully targeted Iba-1 on activated microglia with FePt nanoparticles [63] to directly image neuroinflammation in vivo (to be reported separately). The fact that our SPIONs increased the number and conspicuity of MRI-detected plaques at high-field, combined with the knowledge that SPIONs perform even better as contrast agents at the lower magnetic fields available currently in clinics across the country, suggests that applications of this technology to lower-field MRI studies of human clinical patients may soon become feasible. This is important for drug development where one wishes to both detect the plaques in vivo and to determine the effect of an intervention. The fact that the SPIONs did not appear to be acutely toxic indicated that application of this technology to human patients might provide a major improvement in AD research [62].
In summary, our development of LD55 [43] focused specifically on identification of trans-stilbenes that target the NF-κB pro-inflammatory signaling pathway in microglia. Our results with LD55 and resveratrol point to a close association between plaque density and neuroinflammation, consistent with the suggestion that microglia-dependent inflammation is driving plaque formation. We view LD55 as a viable lead compound for drug development and are pursuing the hypothesis that the effects of LD55 derive from its ability to inhibit the NF-κB signaling pathway in activated microglia. The present study also afforded the opportunity to test our recently developed SPION-enhanced MRI technology [20] to study the effects of resveratrol and LD55 on plaque accumulation and to confirm the results by optical microscopy of thioflavin-stained brain tissue sections.
This promises to be a major new methodology to study the effects of potential AD drugs in live animals and to monitor the effects of drugs longitudinally on brain inflammation of plaque accumulation.
Supplementary Material
Acknowledgments
This research was supported by NIH (SBIR) grant AG032139 (to DLVJ), by grant BC043125 from the US Army/DOD Breast Cancer Program (to DLVJ), by NIH R01 CA123194 (to LOS), by a grant from the UNM Brain and Behavioral Health Institute (to LOS), and by The New Mexico Fraternal Order of Eagles (to LOS). The MRI studies at the University of Minnesota were supported in part by Biotechnology Research Resource Center (BTRC) grants P41 RR008079 (NCRR) and P41 EB015894 (NIBIB).
Optical images in this paper were generated in the UNM Cancer Center Fluorescent Microscopy shared resource, http://hsc.unm.edu/crtc/microscopy/. It is always a pleasure to thank Karen Buehler, of TriCore, for her enthusiastic assistance and Jenny Wilkerson for her expert advice in the realm of immunohistochemistry. The SQUID measurements, showing the lack of aggregation of the SPIONs, were kindly performed by K. Butler and E. Flynn of Senior Scientific, Albuquerque, NM. We would like to thank Terri Gilbert of the Allen Institute for Brain Science for providing the mouse brain coordinates, and Jesus Hernandez of Wolfram Inc. for assistance with brain surface rendering in Mathematica.
Footnotes
Supplementary material includes a Mathematica® computable document format (CDF) notebook containing the 3D distributions shown in Figure 9. These files can be found online at http://dx.doi.org/10.3233/JAD-131031. The CDF player needed in order to view these Mathematica® notebooks is freely available at http://www.wolfram.com/cdf-player.
Authors’ disclosures available online (http://www.j-alz.com/disclosures/view.php?id=2021).
References
- 1.Alzheimer’s Association. Alzheimer’s disease facts and figures. Alzheimer’s Association; Washington, D.C: 2011. http://www.alz.org/downloads/facts_figures_2011.pdf. [DOI] [PubMed] [Google Scholar]
- 2.Hebert LE, Scherr PA, Bienias JL, Bennett DA, Evans DA. Alzheimer’s disease in the U.S. population: Prevalence estimates using the 2000 census. Arch Neurol. 2003;60:1119–1122. doi: 10.1001/archneur.60.8.1119. [DOI] [PubMed] [Google Scholar]
- 3.Fodero-Tavoletti AT, Villemagn VL, Rowe CC, Masters CL, Barnham KJ, Cappai R. Amyloid-β: The seeds of darkness. Int J Biochem Cell Biol. 2011;43:1247–1251. doi: 10.1016/j.biocel.2011.05.001. [DOI] [PubMed] [Google Scholar]
- 4.McLean CA, Cherny RA, Fraser FW, Fuller SJ, Smith MJ, Beyreuther K, Bush AI, Masters CL. Soluble pool of Abeta amyloid as a determinant of severity of neurodegeneration in Alzheimer’s disease. Ann Neurol. 1999;46:860–866. doi: 10.1002/1531-8249(199912)46:6<860::aid-ana8>3.0.co;2-m. [DOI] [PubMed] [Google Scholar]
- 5.Liu Z, Condello C, Schain A, Harb R, Grutzendler J. CX3CR1 in microglia regulates brain amyloid deposition through selective protofibrillar amyloid-β phagocytosis. J Neurosci. 2010;30:17091–17101. doi: 10.1523/JNEUROSCI.4403-10.2010. [DOI] [PMC free article] [PubMed] [Google Scholar]
- 6.Selkoe DJ. The molecular pathology of Alzheimer’s disease. Neuron. 1991;6:487–498. doi: 10.1016/0896-6273(91)90052-2. [DOI] [PubMed] [Google Scholar]
- 7.Selkoe DJ, Schenk D. Alzheimer’s disease: Molecular understanding predicts amyloid-based therapeutics. Annu Rev Pharmacol Toxicol. 2003;43:545–584. doi: 10.1146/annurev.pharmtox.43.100901.140248. [DOI] [PubMed] [Google Scholar]
- 8.Urbanc B, Betnel M, Cruz L, Bitan G, Teplow D. Elucidation of amyloid β-protein oligomerization mechanisms: Discrete molecular dynamics study. J Am Chem Soc. 2010;132:4266–4280. doi: 10.1021/ja9096303. [DOI] [PMC free article] [PubMed] [Google Scholar]
- 9.Khandelwal PJ, Herman AM, Moussa CE. Inflammation in the early stages of neurodegenerative pathology. J Neuroimmunol. 2011;238:1–11. doi: 10.1016/j.jneuroim.2011.07.002. [DOI] [PMC free article] [PubMed] [Google Scholar]
- 10.Doré V, Villemagne VL, Bourgeat P, Fripp J, Acosta O, Chetélat G, Zhou L, Martins R, Ellis KA, Masters CL, Ames D, Salvado O, Rowe CC. Cross-sectional and longitudinal analysis of the relationship between Aβ deposition, cortical thickness, and memory in cognitively unimpaired individuals and in Alzheimer disease. JAMA Neurol. 2013;27:1–9. doi: 10.1001/jamaneurol.2013.1062. [DOI] [PubMed] [Google Scholar]
- 11.Jack CR, Jr, Lowe VJ, Senjem ML, Weigand SD, Kemp BJ, Shiung MM, Knopman DS, Boeve BF, Klunk WE, Mathis CA, Petersen RC. 11C PiB and structural MRI provide complementary information in imaging of Alzheimer’s disease and amnestic mild cognitive impairment. Brain. 2008;131:665–680. doi: 10.1093/brain/awm336. [DOI] [PMC free article] [PubMed] [Google Scholar]
- 12.Choi SR, Golding G, Zhuang Z, Zhang W, Lim N, Hefti F, Benedum TE, Kilbourn MR, Skovronsky D, Kung HF. Preclinical properties of 18F-AV-45: A PET agent for Abeta plaques in the brain. J Nucl Med. 2009;50:1887–1894. doi: 10.2967/jnumed.109.065284. [DOI] [PMC free article] [PubMed] [Google Scholar]
- 13.Yang L, Rieves D, Ganley C. Brain amyloid imaging—FDA approval of florbetapir F18 injection. N Engl J Med. 2012;367:885–887. doi: 10.1056/NEJMp1208061. [DOI] [PubMed] [Google Scholar]
- 14.Chamberlain R, Reyes D, Curran GL, Marjanska M, Wengenack TM, Poduslo JF, Garwood M, Jack CR. Comparison of amyloid plaque contrast generated by T2-weighted, T2*-weighted, and susceptibility-weighted imaging methods in transgenic mouse models of Alzheimer’s disease. Magn Reson Med. 2009;61:1158–1164. doi: 10.1002/mrm.21951. [DOI] [PMC free article] [PubMed] [Google Scholar]
- 15.Jack CR, Wengenack TM, Reyes DA, Garwood M, Curran GL, Borowsk BJ, Lin J, Preboske GM, Holasek SS, Adriany G, Poduslo JF. In vivo magnetic resonance microimaging of individual amyloid plaques in Alzheimer’s transgenic mice. J Neurosci. 2005;25:10041–10048. doi: 10.1523/JNEUROSCI.2588-05.2005. [DOI] [PMC free article] [PubMed] [Google Scholar]
- 16.Benveniste H, Einstein G, Kim KR, Hulette C, Johnson GA. Detection of neuritic plaques in Alzheimer’s disease by magnetic resonance microscopy. Proc Natl Acad Sci U S A. 1999;96:14079–14084. doi: 10.1073/pnas.96.24.14079. [DOI] [PMC free article] [PubMed] [Google Scholar]
- 17.Borthakur A, Gur T, Wheaton AJ, Corbo M, Trojanowski JQ, Lee VM, Reddy R. In vivo measurement of plaque burden in a mouse model of Alzheimer’s disease. J Magn Reson Imag. 2006;24:1011–1017. doi: 10.1002/jmri.20751. [DOI] [PMC free article] [PubMed] [Google Scholar]
- 18.Braakman N, Matysik J, van Duinen SG, Verbeek F, Schliebs R, de Groot HJ, Alia A. Longitudinal assessment of Alzheimer’s beta-amyloid plaque development in transgenic mice monitored by in vivo magnetic resonance microimaging. J Magn Reson Imaging. 2006;24:530–536. doi: 10.1002/jmri.20675. [DOI] [PubMed] [Google Scholar]
- 19.Benveniste H, Ma Y, Dhawan J, Gifford A, Smith SD, Fein-stein I, Du C, Grant SC, Hof PR. Anatomical and functional phenotyping of mice models of Alzheimer’s disease by MR microscopy. Ann N Y Acad Sci. 2007;1097:12–29. doi: 10.1196/annals.1379.006. [DOI] [PubMed] [Google Scholar]
- 20.Sillerud LO, Solberg NO, Chamberlin R, Heidrich JE, Brown DC, Brady CI, Vander Jagt TA, Garwood M, Vander Jagt DL. SPION-enhanced magnetic resonance imaging of Alzheimer’s plaques in AβPP/PS-1 transgenic mouse brain. J Alzheimers Dis. 2013;34:349–365. doi: 10.3233/JAD-121171. [DOI] [PMC free article] [PubMed] [Google Scholar]
- 21.Kim YS, Joh TH. Microglia, major player in the brain inflammation: Their roles in the pathogenesis of Parkinson’s disease. Exp Mol Med. 2006;38:333–347. doi: 10.1038/emm.2006.40. [DOI] [PubMed] [Google Scholar]
- 22.El Khoury J, Luster AD. Mechanisms of microglia accumulation in Alzheimer’s disease: Therapeutic implications. Trends Pharmacol Sci. 2008;29:626–632. doi: 10.1016/j.tips.2008.08.004. [DOI] [PubMed] [Google Scholar]
- 23.Graeber MB. Changing face of microglia. Science. 2010;330:783–788. doi: 10.1126/science.1190929. [DOI] [PubMed] [Google Scholar]
- 24.Schlachetzki JC, Hüll M. Microglial activation in Alzheimer’s disease. Curr Alzheimer Res. 2009;6:554–563. doi: 10.2174/156720509790147179. [DOI] [PubMed] [Google Scholar]
- 25.Heneka MT, O’Banion MK. Inflammatory processes in Alzheimer’s disease. J Neuroimmunol. 2007;184:69–91. doi: 10.1016/j.jneuroim.2006.11.017. [DOI] [PubMed] [Google Scholar]
- 26.Nimmerjahn A, Kirchoff F, Helmchen F. Resting microglial cells are highly dynamic surveillants of brain parenchyma in vivo. Science. 2005;308:1314–1318. doi: 10.1126/science.1110647. [DOI] [PubMed] [Google Scholar]
- 27.Takeuchi O, Akira S. Pattern recognition receptors and inflammation. Cell. 2010;140:805–820. doi: 10.1016/j.cell.2010.01.022. [DOI] [PubMed] [Google Scholar]
- 28.Tahara K, Kim HD, Jin JJ, Maxwell JA, Li L, Fukuchi KI. Role of toll-like receptor signaling in Aβ uptake and clearance. Brain. 2006;129:3006–3019. doi: 10.1093/brain/awl249. [DOI] [PMC free article] [PubMed] [Google Scholar]
- 29.Rhee SH, Hwang D. Murine TOLL-like receptor 4 confers lipopolysaccharide responsiveness as determined by activation of NF-κB and expression of the inducible cyclooxygenase. J Biol Chem. 2000;275:34035–34040. doi: 10.1074/jbc.M007386200. [DOI] [PubMed] [Google Scholar]
- 30.Capiralla H, Vingtdeux V, Zhao H, Sankowski R, Al-Abed Y, Davies P, Marambaud P. Resveratrol mitigates lipopolysaccharide- and Aβ-mediated microglial inflammation by inhibiting the TLR4/NF-κB/STAT signaling cascade. J Neurochem. 2012;120:461–472. doi: 10.1111/j.1471-4159.2011.07594.x. [DOI] [PMC free article] [PubMed] [Google Scholar]
- 31.Bornemann KD, Wiederhold KH, Pauli C, Ermini F, Stalder M, Schnell L, Sommer B, Jucker M, Staufenbiel M. Abeta-induced inflammatory processes in microglia cells of AβPP23 transgenic mice. Am J Pathol. 2001;158:63–73. doi: 10.1016/s0002-9440(10)63945-4. [DOI] [PMC free article] [PubMed] [Google Scholar]
- 32.Pan XD, Zhu YG, Lin N, Zhang J, Ye QY, Huang HP, Chen XC. Microglial phagocytosis induced by fibrillar β-amyloid is attenuated by oligomeric β-amyloid: Implications for Alzheimer’s disease. Mol Neurodegener. 2011;6:45. doi: 10.1186/1750-1326-6-45. [DOI] [PMC free article] [PubMed] [Google Scholar]
- 33.Neher JJ, Neniskyte U, Brown GC. Primary phagocytosis of neurons by inflamed microglia: Potential roles in neurodegeneration. Front Pharmacol. 2012;3:27. doi: 10.3389/fphar.2012.00027. [DOI] [PMC free article] [PubMed] [Google Scholar]
- 34.Granic I, Dolga AM, Nijholt IM, van Dijk G, Eisel ULM. Inflammation and NF-κB in Alzheimer’s disease and diabetes. J Alzheimers Dis. 2009;16:809–821. doi: 10.3233/JAD-2009-0976. [DOI] [PubMed] [Google Scholar]
- 35.Kaltschmidt B, Uherek M, Volk B, Baeuerle PA, Kaltschmidt C. Transcription factor NF-kappaB is activated in primary neurons by amyloid beta peptides and in neurons surrounding early plaques from patients with Alzheimer disease. Proc Natl Acad Sci U S A. 1997;94:2642–2647. doi: 10.1073/pnas.94.6.2642. [DOI] [PMC free article] [PubMed] [Google Scholar]
- 36.Mattson MP. NF-κB in the survival and plasticity of neurons. Neurochem Res. 2005;30:883–893. doi: 10.1007/s11064-005-6961-x. [DOI] [PubMed] [Google Scholar]
- 37.Kaltschmidt B, Kaltschmidt C. NF-κB in the nervous system. Cold Spring Harb Perspect Biol. 2009;1:a001271. doi: 10.1101/cshperspect.a001271. [DOI] [PMC free article] [PubMed] [Google Scholar]
- 38.Lee Y-J, Han SB, Nam S-Y, Oh K-W, Hong JT. Inflammation and Alzheimer’s disease. Arch Pharm Res. 2010;33:1539–1556. doi: 10.1007/s12272-010-1006-7. [DOI] [PubMed] [Google Scholar]
- 39.Sovak M. Grape extract, resveratrol, and its analogs: A review. J Med Food. 2001;4:93–105. doi: 10.1089/109662001300341752. [DOI] [PubMed] [Google Scholar]
- 40.Leiro J, Arranz JA, Fraiz N, Sanmartin ML, Quezada E, Orallo F. Effect of cis-resveratrol on genes involved in nuclear factor kappa B signaling. Int Immunopharmacol. 2005;5:393–406. doi: 10.1016/j.intimp.2004.10.006. [DOI] [PubMed] [Google Scholar]
- 41.Storz P, Doppler H, Toker A. Activation loop phosphorylation controls protein kinase D-dependent activation of nuclear factor kappaB. Mol Pharmacol. 2004;66:870–879. doi: 10.1124/mol.104.000687. [DOI] [PubMed] [Google Scholar]
- 42.Ulrich S, Wolter F, Stein JM. Molecular mechanisms of the chemopreventive effects of resveratrol and its analogs in carcinogenesis. Mol Nutr Food Res. 2005;49:452–461. doi: 10.1002/mnfr.200400081. [DOI] [PubMed] [Google Scholar]
- 43.Heynekamp JJ, Weber WM, Hunsaker LA, Gonzales AM, Orlando RA, Deck LM, Vander Jagt DL. Substituted trans-stilbenes, including analogues of the natural product resveratrol, inhibit the human tumor necrosis factor alpha-induced activation of transcription factor nuclear factor kappaB. J Med Chem. 2006;49:7182–7189. doi: 10.1021/jm060630x. [DOI] [PubMed] [Google Scholar]
- 44.Bi XL, Yang JY, Dong YX, Wang JM, Cui YH, Ikeshima T, Zhao YQ, Wu CF. Resveratrol inhibits nitric oxide and TNF-alpha production by lipopolysaccharide- activated microglia. Int Immunopharmacol. 2005;5:185–193. doi: 10.1016/j.intimp.2004.08.008. [DOI] [PubMed] [Google Scholar]
- 45.Boberin LD, Quincozes-Santos A, Guerra MC, Leite MC, Souza DO, Goncalves CA, Gottfried C. Resveratrol prevents ammonia toxicity in astroglial cells. PLoS One. 2012;7:e52164. doi: 10.1371/journal.pone.0052164. [DOI] [PMC free article] [PubMed] [Google Scholar]
- 46.Kim J, Lee HJ, Lee KW. Naturally occurring phytochemicals for the prevention of Alzheimer’s disease. J Neurochem. 2010;112:1415–1430. doi: 10.1111/j.1471-4159.2009.06562.x. [DOI] [PubMed] [Google Scholar]
- 47.Kotha A, Sekharam M, Cilenti L, Siddiquee K, Khaled A, Zervos AS, Carter B, Turkson J, Jove R. Resveratrol inhibits Src and Stat3 signaling and induces the apoptosis of malignant cells containing activated Stat3 protein. Mol Cancer Res. 2006;5:621–629. doi: 10.1158/1535-7163.MCT-05-0268. [DOI] [PubMed] [Google Scholar]
- 48.Faber AC, Dufort FJ, Blair D, Wagoer D, Roberts MF, Chikes TC. Inhibition of phosphatidylinositol 3-kinase-mediated glucose metabolism coincides with resveratrol-induced cell cycle arrest in human diffuse large B-cell lymphomas. Biochem Pharmacol. 2006;72:1246–1256. doi: 10.1016/j.bcp.2006.08.009. [DOI] [PubMed] [Google Scholar]
- 49.Feng L, Jin J, Zhang LF, Yan T, Tao WY. Analysis of the resveratrol-binding protein using phage-displayed random peptide library. Acta Biochim Biophys Sin (Shanghai) 2006;38:342–348. doi: 10.1111/j.1745-7270.2006.00163.x. [DOI] [PubMed] [Google Scholar]
- 50.Kundu JK, Shin YK, Kim SH, Surh YJ. Resveratrol inhibits phorbol ester- induced expression of COX-2 and activation of NF-kappaB in mouse skin by blocking IkappaB kinase activity. Carcinogenesis. 2006;27:1465–1474. doi: 10.1093/carcin/bgi349. [DOI] [PubMed] [Google Scholar]
- 51.Hardy J, Allsop D. Amyloid deposition as the central event in the aetiology of Alzheimer’s disease. Trends Pharmacol Sci. 1991;12:383–388. doi: 10.1016/0165-6147(91)90609-v. [DOI] [PubMed] [Google Scholar]
- 52.Hardy J. Amyloid, the presenilins and Alzheimer’s disease. Trends Neurosci. 1997;20:154–159. doi: 10.1016/s0166-2236(96)01030-2. [DOI] [PubMed] [Google Scholar]
- 53.Hsaio K, Chapman P, Nilsen S, Eckman C, Harigaya Y, Younkin S, Yang F, Cole G. Correlative memory deficits, Aβ elevation, and amyloid plaques in transgenic mice. Science. 1996;274:99–102. doi: 10.1126/science.274.5284.99. [DOI] [PubMed] [Google Scholar]
- 54.Holcomb L, Gordon MN, McGowan E, Yo X, Benkovic S, Jantzen P, Wright K, Saad I, Mueller R, Morgan D, Sanders S, Zehr C, O’Campo K, Hardy J, Prada CM, Eckman C, Younkin S, Hsaio K, Duff K. Accelerated Azlheimer-type phenotype in transgenic mice carrying both mutant amyloid precursor protein and presenilin 1 transgenes. Nat Med. 1998;4:97–100. doi: 10.1038/nm0198-097. [DOI] [PubMed] [Google Scholar]
- 55.Karuppagounder SS, Pinto JT, Xu H, Chen HL, Beal MF, Gibson GE. Dietary supplementation with resveratrol reduces plaque pathology in a transgenic model of Alzheimer’s disease. Neurochem Int. 2009;54:111–118. doi: 10.1016/j.neuint.2008.10.008. [DOI] [PMC free article] [PubMed] [Google Scholar]
- 56.Vingtdeux V, Giliberto L, Zhao H, Chandakkar P, Wu Q, Simon JE, Janle EM, Lobo J, Ferruzzi MG, Davies P, Marambaud P. AMP-activated protein kinase signaling activation by resveratrol modulates amyloid-β peptide metabolism. J Biol Chem. 2010;285:9100–9113. doi: 10.1074/jbc.M109.060061. [DOI] [PMC free article] [PubMed] [Google Scholar]
- 57.Stookey LL. Ferrozine-a new spectrophotometric reagent for iron. Anal Chem. 1970;42:779–781. [Google Scholar]
- 58.Schneider CA, Rasband WS, Eliceiri KW. NIH image to ImageJ: 25 years of image analysis. Nat Methods. 2012;9:671–675. doi: 10.1038/nmeth.2089. [DOI] [PMC free article] [PubMed] [Google Scholar]
- 59.Lu X, Ma L, Ruan L, Kong Y, Mou H, Zhang Z, Wang Z, Wang JM, Le Y. Resveratrol differentially modulates inflammatory responses of microglia and astrocytes. J Neuroinflammation. 2010;7:46–60. doi: 10.1186/1742-2094-7-46. [DOI] [PMC free article] [PubMed] [Google Scholar]
- 60.Zhang F, Liu J, Shi JS. Anti-inflammatory activities of resveratrol in the brain: Role of resveratrol in microglial activation. Eur J Pharmacol. 2010;636:1–7. doi: 10.1016/j.ejphar.2010.03.043. [DOI] [PubMed] [Google Scholar]
- 61.Yan P, Bero AW, Cirrito JR, Xiao Q, Hu X, Wang Y, Gonzales E, Holtzman DM, Lee J. Characterizing the appearance and growth of amyloid plaques in AβPP/PS1 mice. J Neurosci. 2009;29:10706–10714. doi: 10.1523/JNEUROSCI.2637-09.2009. [DOI] [PMC free article] [PubMed] [Google Scholar]
- 62.Masters CL, Cappai R, Barnham KJ, Villemagne VL. Molecular mechanisms for Alzheimer’s disease: Implications for neuroimaging and therapeutics. J Neurochem. 2006;106:1700–1725. doi: 10.1111/j.1471-4159.2006.03989.x. [DOI] [PubMed] [Google Scholar]
- 63.Taylor RM, Huber DL, Monson TC, Ali AS, Bisoffi M, Sillerud LO. Multifunctional iron platinum stealth immunomicelles: Targeted detection of human prostate cancer cells using both fluorescence and magnetic resonance imaging. J Nanopart Res. 2011;13:4717–4729. doi: 10.1007/s11051-011-0439-3. [DOI] [PMC free article] [PubMed] [Google Scholar]
Associated Data
This section collects any data citations, data availability statements, or supplementary materials included in this article.