Abstract
Blends of poliglecaprone (PGC) and polycaprolactone (PCL) of varying compositions were electrospun into tubular conduits and their mechanical, morphological, thermal and in vitro degradation properties were evaluated under simulated physiological conditions. Generally, mechanical strength, modulus and hydrophilic nature were enhanced by the addition of PGC to PCL. An in vitro degradation study in phosphate-buffered saline (pH 7.3) was carried out for up to 1 month to understand the hydrolytic degradation effect on the mechanical properties in both the longitudinal and circumferential directions. Pure PCL and 4:1 PCL/PGC blend scaffolds exhibited considerable elastic stiffening after a 1 month in vitro degradation. Fourier transform infrared spectroscopic and DSC techniques were used to understand the degradation behavior and the changes in structure and crystallinity of the polymeric blends. A 3:1 PCL/PGC blend was concluded to be a judicious blend composition for tubular grafts based on overall results on the mechanical properties and performance after a 1 month in vitro degradation study.
Keywords: poliglecaprone, electrospinning, degradation, mechanical properties, vascular graft
INTRODUCTION
Engineering scaffolds based on biodegradable synthetic polymers are in high demand due to their low toxicity, ease of processability, tunable mechanical properties and modifiable degradation times.1–3 Researchers have utilized these polymers as various tissue scaffolds for bone, blood vessel, cartilage, nerve, skin and heart tissue engineering.4,5 Since mechanical properties and degradation time vary greatly for different polymers,6 it is important to tune the degradability and mechanical properties of biodegradable polymers to optimize their structural, temporal and mechanical integrity for a specific tissue-scaffold application.
Previously, polyesters such as poly(lactic acid) (PLA), polycaprolactone (PCL), poly(lactic-co-glycolic acid) (PLGA), polyglycolic acid (PGA) and poly(ester urethane) urea have been used as biodegradable and biocompatible scaffolds to create biodegradable templates in vascular tissue engineering.7 While progress has been made in mimicking native biomechanical properties and biocompatibility, stability and mechanical integrity for an extended duration of several months still remains a huge challenge.8 Among the various methods to recreate fibrous features of the extracellular matrix (ECM) morphology,9 electrospinning technique has gained considerable attention as a simple technique to readily fabricate seamless tubular 3D conduits of various dimensions for blood vessels.10,11 The electrospinning process is simple, robust, cost-effective and widely used to fabricate fibers with diameters down to nanoscale levels.4,9,12
The tubular scaffolds obtained from electrospinning should have appropriate mechanical properties to provide the initial mechanical strength and stability to allow new tissue formation.13 The mechanical strength, degradation time and the balanced hydrophilic/hydrophobic nature of an electrospun scaffold will be greatly influenced by the choice of synthetic biodegradable polymer. However, a single polymer may not have all three qualities necessary to act as a ‘backbone’ material in scaffolding applications. Blending of two different polymers could be a simple solution to this material property issue. For instance, PGA shows rapid degradation in vivo due to its hydrophilic nature,14 while a combination of PLA and PGA (such as PLGA, a copolymer of PLA and PGA15) can help to decrease the degradation time and increase the hydrophilic nature of PLA. Since PCL is more flexible than PLA, a vascular graft made with a copolymer of the two, poly(L-lactic acid-co-caprolactone), exhibits better flexibility and elasticity than PLA.16 In addition, polydioxanone has been blended with durable PCL to create a robust and mechanically stable vascular graft.17 Thus, blending of two different polymers with distinct chemical, mechanical and degradation characteristics represents a simple opportunity to tailor the mechanical properties, hydrophilic/hydrophobic balance and degradation profile of electrospun tissue scaffolds.
Poliglecaprone (PGC), a copolymer made of randomly segmented PCL and PGA, has better mechanical properties and a shorter degradation period (60% reduction in mechanical strength within 3 – 4weeks as a suture)18 compared with PCL. PCL can provide enhanced viscoelasticity, but prolonged degradation time of the polymer may inhibit the regeneration/tissue-remodeling processes. PGC can provide necessary strength and hydrophilicity. Thus, an optimal composition of PCL and PGC polymers may have the potential to be a ‘mechanoactive’ scaffold for vascular graft applications. Coating of biomatrix proteins (collagens or laminin) or peptide amphiphiles on these scaffolds can further provide the necessary biological cues for tissue regeneration (which will be reported shortly) but will not contribute much toward the mechanical integrity. This paper provides a detailed comparison of three blend ratios of PCL/PGC (2:1, 3:1 and 4:1) to understand the synergistic effect of blend composition and degradation up to 1 month on their mechanical properties to fabricate mechanically robust tubular grafts.
EXPERIMENTAL
Materials
PCL, with inherent viscosity between 1.0 and 1.3 dL g−1 in CHCl3, was purchased from Lactel Absorbable Polymers (Birmingham, AL, USA). PGC was supplied in the form of monofilament absorbable surgical sutures under the trade name of Monocryl® (Ethicon) from Advanced Inventory Management Inc. (Mokena, IL, USA). PCL and PGC (PCL/PGC weight ratios 2:1, 3:1, 4:1) were dissolved in 1,1,1,3,3,3-hexafluoro-2-propanol (HFP) purchased from Sigma-Aldrich (St Louis, MO, USA) and were homogenized by magnetic stirring.
Electrospinning and fabrication of tubular scaffolds
The polymer blend (PCL/PGC) solution loaded into a 3 mL syringe was placed on a motorized and programmable syringe pump (PHD 2000, Harvard Apparatus, Holliston, MA, USA). The syringe was connected to a 25-G syringe needle (Small Parts Inc., Logansport, IN, USA) fitted in a translating stage using Teflon tubing. A high voltage power supply (M826, Gamma High-Voltage Research, and Ormond Beach, FL, USA) was used to provide the necessary electric potential between the needle and a 4 mm diameter stainless steel mandrel rotating at 400 rpm. PCL/PGC blends (2:1, 3:1 and 4:1) in HFP with a concentration of 12% w/v were prepared and the viscosity was measured with a Brookfield viscometer (DV-II + Pro) at 25 °C using the CP40 spindle with cone/plate. The viscosity values were measured over the shear rate range 10–30 s−1 as 0.73, 0.5 and 0.6 Pa s for 2:1, 3:1 and 4:1, respectively. The polymer infusion rate (between 0.8 and1.0 mL h−1) and voltage (between 15 and 20 kV) were used to optimize critical spinning conditions to produce fine bead-free fibers of nano/micro diameter. The distance between the needle tip and mandrel was fixed at 25 cm and the needle was translated at a speed of 3 cm s−1 to produce a uniformly thick tubular conduit of 25 cm length. Scaffolds from PCL alone (pure PCL) and PGC alone (pure PGC) were prepared under the same conditions (1.0 mL h−1 perfusion rate, 20 kV voltage and 25 cm needle – collector gap) and used as controls.
Characterization of structural and morphological properties
SEM and DSC were used to distinguish the scaffold’s microstructural/morphological and thermal characterizations. Scaffold samples were sputter-coated with Au – Pd and scanned using a field emission scanning electron microscope (Quanta FEG 650 from FEI, Hillsboro, OR, USA). The fiber diameter – frequency distribution was determined by measuring fibers from different SEM images with the same magnification using ImageJ.19 The SEM image was loaded into the ImageJ software and the scale bar was determined to measure the diameter accurately. From the SEM image, 100 different fiber diameter measurements were recorded by drawing a straight line (stretching across the fiber diameter). To obtain thermal properties, samples were subjected to DSC experiments using a DSC instrument (TA Instruments Q100) from −90 to 250 °C at a rate of 10 °C min−1. For infrared spectroscopy of various compositions of PCL and PGC, the Fourier transform infrared (FTIR) spectra were recorded with 64 scans per sample ranging from 4000 to 400 cm−1 in the attenuated total reflection mode using an IR spectrophotometer (Thermo Fisher Co.) The porosity (%) of the scaffolds was measured from apparent density measurements as per our earlier reports.19,20
Water contact angle measurement and hydration studies
The water contact angle technique was utilized to understand the hydrophilicity of the scaffolds. The samples were cut into 1 cm × 1 cm strips (n = 3) for each composition and were then mounted onto a glass slide. Contact angles were measured using the static sessile drop method21 at room temperature. One measurement per sample was acquired and three discrete samples were used to get the average contact angle value. The water droplet size of 5 μL was pipetted onto the electrospun scaffolds and temporal images were obtained. To measure the contact angle, a snapshot of a droplet on a scaffold surface was taken 10 s after the droplet deposition. A video contact angle instrument and software (VHX 600E, Keyence, Itasca, IL, USA) were used to capture the video and snapshots to determine the contact angle. By utilizing the software, the baseline at the surface of the scaffold and droplet interaction was drawn. Then, a tangential line from the point of contact and the outer surface of the droplet was drawn. The angle between these two lines was recorded as the contact angle. The effect of blend composition on hydration was studied by water uptake of scaffolds immersed in phosphate-buffered saline (PBS). The net gain in mass provided a value for PBS absorption (%) based on wet mass (Mw) and dry initial mass (Ma) using
| (1) |
Mechanical properties
Tensile specimens were prepared by cutting the scaffolds into rectangular strips (3 mm × 10 mm) for both circumferential and longitudinal directions in accordance with ASTM Standard D882 for tensile testing of thin film plastics. The sample thickness was determined by averaging five values acquired at different locations on each specimen using the contact method on a thermal mechanical analyzer (TMA Q400, TA Instruments).1 A dynamic mechanical analyzer with a tensile fixture (DMA, TA Instruments) was used to determine the tensile properties of the samples (n = 6) in constant force mode. The specimen was clamped to the tensile fixture of the DMA machine vertically and the gauge length of the exposed sample was measured using the electronic digital caliper. The samples (PCL/PGC blends, pure PCL and pure PGC) were tested uniaxially using an 18 N load cell at a ramp of 0.1 N mm−1. Data from each experiment were analyzed using graphic analysis software (TA Universal Data Analysis) and the elastic modulus, percentage elongation to failure and ultimate strength were determined from the generated stress–strain curves.
In vitro degradation studies
The hydrolytic degradation of the PCL/PGC blend and pure PCL and pure PGC was carried out by aging the samples (1 cm × 1 cm, n = 6) with PBS (pH 7.3) immersion22 at 37 °C. Mass loss was measured at 1 week intervals up to 4 weeks. At each interval, samples were removed from the PBS medium and gently wiped with Kim wipes to remove excess liquid. Specimens were then placed under vacuum at room temperature until a constant mass was observed. Mass loss (%) was calculated using Eqn (2), where M1 is the initial mass and M2 the dehydrated mass after in vitro degradation.23
| (2) |
For mass loss calculation, a separate set of samples for each composition and for each time point was prepared and aged. To understand how mechanical properties were affected by in vitro degradation, samples were prepared and were aged under immersion in PBS (pH 7.3) for a period of 24 h, 1 week and 4 weeks after which they were subjected to mechanical testing.23,24
The aged scaffolds for each composition and different aging periods were also evaluated by FTIR and thermal scans (DSC) to assess the chemical bond cleavage and change in crystallinity due to hydrolytic degradation, as described previously. SEM images at the 4 week period were acquired to understand the degradation effect on the electrospun fibers.
RESULTS AND DISCUSSION
Structural, morphological and thermal properties
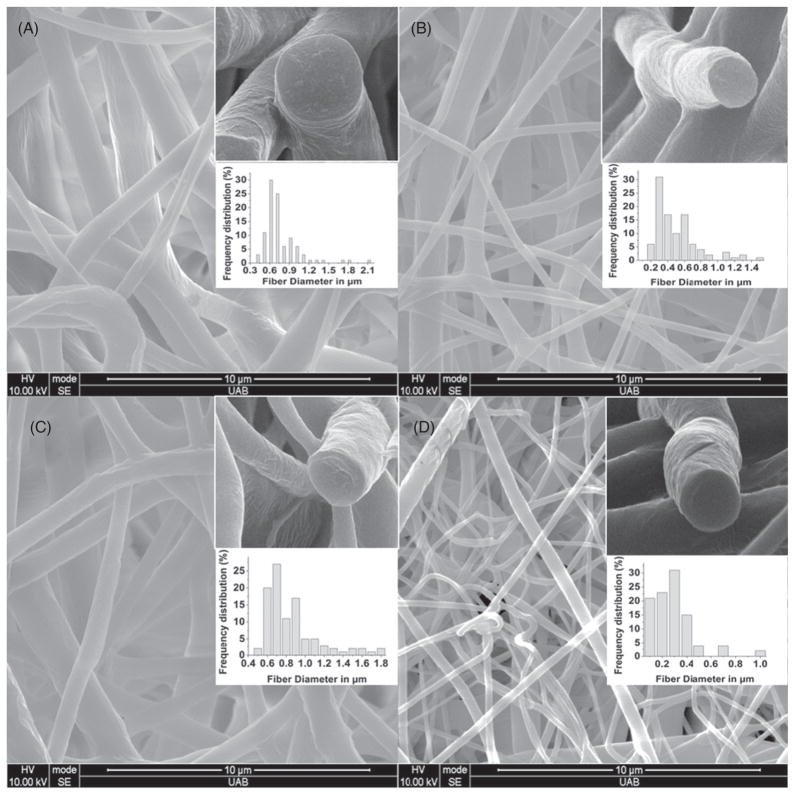
To mimic the native ECM, the tissue scaffold should be fibro-porous and the fiber size should be nano to micro scale.5,25 The SEM images in Fig. 1 show the morphology of the PCL/PGC blends (ratios of 2:1, 3:1 and 4:1) and the pure PCL scaffold. The SEM images confirm fiber size and bead-free fiber formation as well as the fiber orientation. All three PCL/PGC ratios showed a fiber diameter between 0.2 μm and 1 μm with the majority of the fiber diameters being under 800 nm. Pure PCL exhibited a relatively narrow frequency distribution with a fiber size ranging up to 400 nm only. It is evident that the addition of PGC to PCL increased the fiber diameter. However, the fiber diameters are comparable to the upper range of protein fiber sizes. For example, collagen fibers are in the range 50–500 nm in size.25 The porosity for all three ratios calculated from apparent density measurements19 was in the range 70% – 80%. The porosity sequence was pure PGC (71.1% ± 1.3%) < 2:1 PCL/PGC (76.4% ± 0.8%) ≥ 3:1 PCL/PGC (74.7% ± 2.4%) < 4:1 PCL/PGC (78.2% ± 1.8%) < pure PCL (79.5% ± 1.1%). A high porosity with an interconnected pore-network structure would provide a higher surface to volume ratio which could help to transport nutrients and for cell adhesion and proliferation.25
Figure 1.
SEM images (20 000×) illustrate fiber quality and ECM mimicking morphology: (A) 2:1; (B) 3:1; (C) 4:1; (D) pure PCL. The insets represent 80 000× cross-sectional views of the fiber and the frequency distribution of fiber size.
PCL and PGC were blended together to achieve new and more desirable mechanical and degradation properties. However, the final properties greatly depend on the miscibility and the interfacial phases of the polymers.26,27 SEM micrographs were used to understand the phase separation due to immiscibility.28,29 Figure 1 (cross-section SEM insets) indicates that the fiber morphology is not different in blends versus the pure PCL polymer. PGC has a higher crystallinity than PCL due to the presence of the PGA component. In this situation, the PCL/PGC blend fibers may have a co-continuous phase morphology as observed by You et al. in the case of PGA/PCL blended electrospun fibers.30 This co-continuous phase morphology is due to the rapid phase mixing and solidification during the electrospinning process in the case of the PCL homopolymer and PCL segments containing PGC copolymer blends. Bognitzki et al. have also reported a co-continuous phase morphology for PLA/PVP (polyvinylpyrrolidone) blend fibers.30,31 Since PCL and PGC (a copolymer of PCL and PGA) have polymer chain segments of PCL, the PCL segments of the PGC copolymer can easily compatibilize with the PCL polymer, which is clear from the cross-sectional SEM images with no difference in contrast or presence of phase separation due to different phases.
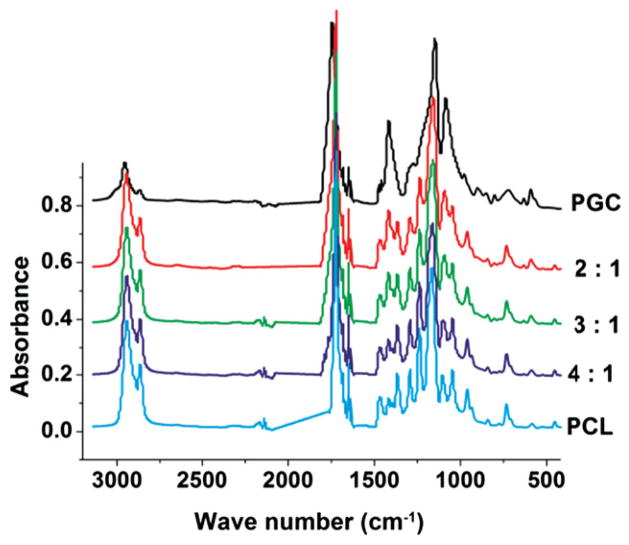
FTIR spectral analysis was conducted to understand the difference in chemical bond vibrational spectra of the 2:1, 3:1 and 4:1 blend ratios compared with pure PCL and pure PGC (Fig. 2). The IR spectrum for pure PCL showed prominent characteristic bands for aliphatic methylene stretching at 2941 cm−1 and 2865 cm−1 and a carbonyl stretching at 1727 cm−1. Additional bands included C–O and C–C backbone stretching due to the amorphous phase at 1157 cm−1 and the crystalline phase at 1293 cm−1. Peaks at 1240 cm−1 and 1170 cm−1 can be assigned to C–O–C stretching and the peak at 1190 cm−1 represents OC–O stretching. Since PGC is made from 75% PGA segments and 25% PCL segments, the typical IR spectrum of PGC exhibited distinct peaks of PGA segments and overlapped partially with peaks corresponding to PCL. The aliphatic C–H stretching peak (2972 cm−1) and carbonyl stretching peak (1743 cm−1) were shifted to the higher energy region in the PGC spectrum compared with those for PCL. Peaks appearing around 1420 cm−1 (COO, C–H deformation), 1229 cm−1 (C–O in ester), 1147 cm−1 (C–O–C in ester) and 1086 cm−1 (C–OH in end group) in the pure PGC spectrum were characteristic of the PGA component.22,32 Bands around 850, 713 and 560 cm−1 for the amorphous region and bands around 972, 901, 806, 627 and 590 cm−1 for the crystalline phase33 also appeared. PCL/PGC blends exhibited characteristic peaks of both PCL and PGC, but with a gradual shift in the peak position towards PCL in the order pure PGC < 2:1 PCL/PGC < 3:1 PCL/PGC < 4:1 PCL/PGC < pure PCL. The shift can clearly be observed in the case of peaks around 1420, 1147 and 1086 cm−1 (Fig. 2). These overlapping peaks of PGC were decreased in intensity due to blending with PCL. The variation of the characteristic peak area due to blending is given in Table 1.
Figure 2.
FTIR spectra of PCL/PGC scaffolds, pure PCL and pure PGC.
Table 1.
Variation of characteristic IR peak area for blends and pure polymers
| Functional group | IR peakposition (cm−1) | Average area under the peak for blends and pure polymers
|
||||
|---|---|---|---|---|---|---|
| PGC | 2:1 PCL/PGC | 3:1 PCL/PGC | 4:1 PCL/PGC | PCL | ||
| COO, C–H | 1420 | 0.2246 | 0.1633 | 0.1543 | 0.1081 | 0.0932 |
| C–O–C | 1147–1157 | 0.4330 | 0.4256 | 0.4102 | 0.3941 | 0.3678 |
| C–OH end | 1086 | 0.3465 | 0.2426 | 0.2080 | 0.1794 | 0.1558 |
| C = O of ester | 1720–1740 | 0.1417 | 0.1238 | 0.1148 | 0.1108 | 0.1121 |
| –CH2– | 2940–2970 | 0.1372 | 0.1880 | 0.1901 | 0.1832 | 0.1933 |
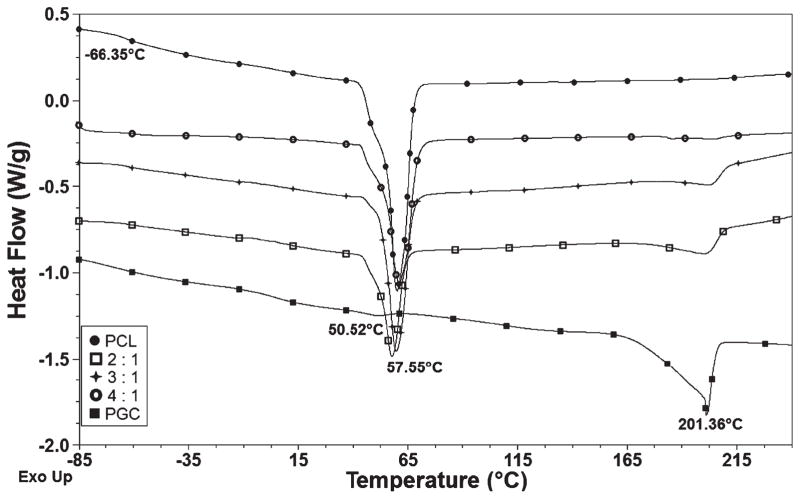
DSC curves are useful for understanding the thermal properties of blend compositions and the miscibility of the blends.34–36 PGC is a copolymer of PGA and PCL which have two distinct glass transition temperatures of around 50 °C and −60 °C, respectively.36 The dominating melting endotherm of PCL around 60 °C overlaps the glass transition temperature of PGC at 50 °C36 in the DSC spectra of the blends. As shown in Fig. 3, the melting temperatures were in the range 55–60 °C for the PCL component and around 200 °C for the PGA component. Further, addition of PGC to PCL showed a decrease in the heat of fusion (ΔHf) (ΔHf of PCL 70.9 J g−1 versus 32.3 J g−1 for the 2:1 blend) resulting in a reduction in crystallinity. A weak interaction between high molecular weight polymers can be thermodynamically unfavorable. This would promote the formation of lower stability co-crystals and result in decreased crystallinity.37 In addition, the crystallinity of the PGC copolymer also decreased, as is evident from the ΔHf of PGC (35.6 J g−1) and that for 2:1 PCL/PGC (5.65 J g−1) due to blending with PCL. Overall, PCL/PGC blends exhibited lower crystallinity than the respective pure polymers.
Figure 3.
DSC curves show the thermal properties of PCL/PGC blends, pure PCL and pure PGC.
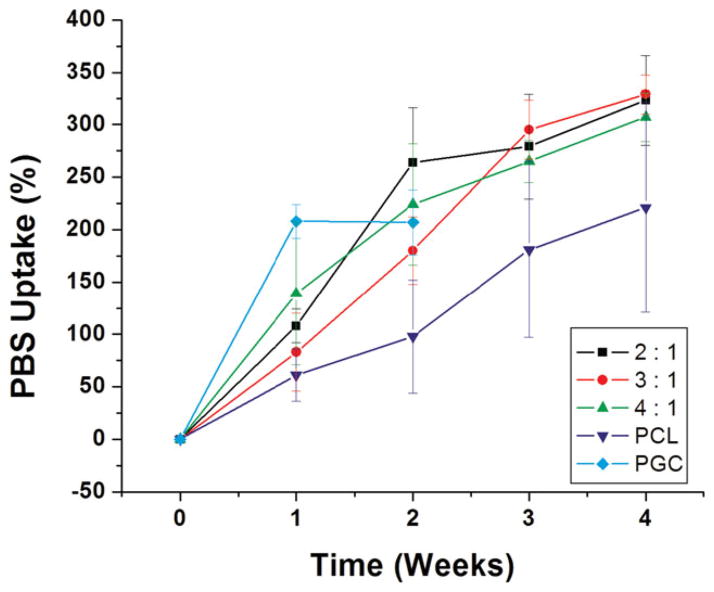
The water contact angle measurement was utilized to further understand the hydrophilic and hydrophobic nature of different blend ratios. The contact angle values for the pure PCL and pure PGC scaffolds were 126° ± 3° and 67° ± 4°, respectively, suggesting that PGC is more hydrophilic than PCL. Aghdam et al. have also reported the hydrophobic nature with a contact angle value of 118° ± 5° for electrospun PCL mat.35 The PCL/PGC (2:1) exhibited a contact angle of 97° ± 3° that was significantly lower than for pure PCL, implying increased hydrophilicity due to addition of the PGC component which is composed of mainly PGA. An increase in hydrophilicity resulting in a decrease in contact angle with the addition of PGA has also been observed by others.35 The contact angle values for PCL/PGC with ratios of 3:1 and 4:1 were 114° ± 2° and 115° ± 4°, respectively. The PBS uptake measurement was used to understand the relative effect of the compositions on hydration. The PBS uptake data (Fig. 4) complemented the contact angle results that pure PCL absorbed the lowest in comparison with the PCL/PGC blends due to its hydrophobic surface.38 The pure PGC scaffold showed maximum uptake (208%) after 1 week immersion in PBS medium. Interestingly, 3:1 PCL/PGC showed a lower value for PBS uptake (90%) than 4:1 PCL/PGC (140%), irrespective of the higher PGC content in the former. This could be attributed to the higher porosity of the 4:1 PCL/PGC scaffold compared with the 3:1 PCL/PGC scaffold. An increase in PBS uptake was noticed each week among all three blends and pure PCL scaffolds but not for the pure PGC scaffold. A mass loss due to degradation compromised the PBS uptake after 1 week in the case of pure PGC. The PCL/PGC blend compositions 2:1 and 3:1 showed PBS uptake after 4 weeks as 323% and 329%, respectively. Overall there was a consistent pattern of increased hydrophilicity of the scaffold with addition of PGC to PCL as observed from contact angle and PBS uptake results, which could impart scaffold degradation as well as cell attachment on it.
Figure 4.
PBS absorption data, for 1 month, for the blends, pure PCL and pure PGC.
Mechanical characterizations
To study the effect of composition on mechanical properties, PCL/PGC blend ratios of 2:1, 3:1 and 4:1 were uniaxially tested for mechanical properties in both circumferential and longitudinal directions and compared with pure PCL and pure PGC. Representative stress–strain curves for the scaffolds are given in Figs 5(A) and 5(B). As expected, the pure PGC scaffold exhibited better mechanical properties than the pure PCL scaffold in both circumferential and longitudinal directions. It is interesting to note that the scaffolds exhibited better mechanical properties in the longitudinal direction compared with the circumferential direction. This anisotropic mechanical behavior can be attributed to the deposition of more fibers in the longitudinal direction than the circumferential direction due to the availability of more surfaces to get attracted to in the case of a long mandrel (25 cm) with a small diameter (4 mm)39. Since the rotation speed is well below the spinning jet speed, randomly coiled fibers collect along the length of the collector as seen in SEM images (Fig. 1), rather than aligning circumferentially to the cylinder.
Figure 5.
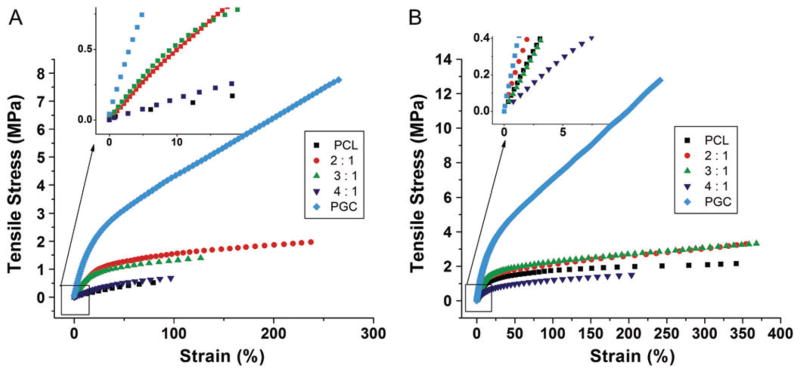
Representative stress–strain curves of scaffolds in (A) the circumferential direction and (B) the longitudinal direction.
In Figs 6(A)–6(C) the mechanical properties of three PGC/PCL blend compositions tested in both circumferential and longitudinal directions (under dry and hydrated wet conditions) are compared with those for pure PCL and PGC scaffolds under similar conditions. A clear trend of increase in tensile strength with increase in mass fraction of PGC in PCL/PGC was noticed in both the longitudinally and circumferentially tested scaffolds. The swelling due to hydration (1 day in water) did not alter the tensile properties significantly in the case of pure PCL and the PCL/PGC blends. But pure PGC scaffolds exhibited a change in properties due to the hydration effect. Among the PCL/PGC blends, the 4:1 ratio showed the lowest tensile strength compared with the 2:1 ratio (1.92 ± 0.06 MPa). The higher tensile strength of the 2:1 scaffold is clearly due to the relatively higher amount of PGC in it. The pure PGC scaffold has the highest tensile strength among all compositions in both dry and hydrated conditions. On the other hand, the pure PCL scaffold showed the lowest value of 0.49 ± 0.01 MPa for tensile strength. The mechanical properties of three different blends for the longitudinal direction under dry and wet conditions are also given in Fig. 6. As stated previously, scaffolds exhibited higher mechanical properties in the longitudinal direction with a similar trend to that observed in the circumferential direction. For instance, the 3:1 scaffold exhibited a tensile strength of 1.53 ± 0.09 MPa in the circumferential direction versus a tensile strength of 3.11 ± 0.14 MPa in the longitudinal direction. We anticipate a greater fiber density along the longitudinal direction in comparison with the circumferential direction which results in increased strength (ca 100%). The PCL/PGC blend with 2:1 composition exhibited a tensile strength of 3.18 ± 0.26 MPa compared with 1.39 ± 0.10 MPa for the 4:1 composition as shown in Fig. 6(A). Hence the sequence of tensile strength is in the order pure PGC > 2:1 PCL/PGC ≥ 3:1 PCL/PGC > 4:1 PCL/PGC > pure PCL. The comparable mechanical properties of the 3:1 PCL/PGC blend and the 2:1 PGC/PCL blend could be attributed the possible increased ‘miscibility’ in the blend with 3:1 ratio as per our recent report on PCL/Maxon blends.36 Overall, the data showed that PCL/PGC blends with 2:1 and 3:1 compositions (in both dry and wet conditions) exhibited tensile strength values comparable with that of human native arteries (1–2 MPa).40–42 The Young’s modulus for the PCL/PGC blends with compositions 2:1, 3:1 and 4:1 were 4.6 ± 0.6, 5.6 ± 1.1 and 1.1 ± 0.3 respectively in the circumferential direction under dry conditions. These results indicated that, by blending more PGC polymer, PCL became stiffer. In the longitudinal direction, the scaffolds with compositions 2:1, 3:1 and 4:1 exhibited a modulus of elasticity of 13.2 ± 2.6 MPa, 12.6 ± 0.6 MPa and 4.4 ± 0.6 MPa, respectively, under dry conditions, as shown in Fig. 6(B). These results showed that the scaffolds were stiffer in the longitudinal direction compared with the circumferential direction. Wet samples (after 1 day hydration) did not affect the modulus of elasticity of the blends. Hence the sequence of the tensile moduli of the scaffolds is in the order pure PCG > 2:1 PCL/PGC ≥ 3:1 PCL/PGC > pure PCL. The moduli of elasticity of the blends 2:1 and 3:1 in the longitudinal direction are comparable with a native artery’s tensile modulus (8–12 MPa).41,43,44 Again, the failure strain (%) was also affected by blend composition. A pure PGC scaffold exhibited a failure strain of ca 230% in the circumferential direction (dry condition) versus a pure PCL scaffold (ca 69%). Incorporating PGC with PCL resulted in both higher failure strain of the scaffold and higher strength and elasticity, as shown in Figs 6(A)–6(C). Mechanical strength and flexibility are paramount mechanical properties for a successful vascular graft since it has to withstand repeated pressures exerted constantly by blood flow.39
Figure 6.

Tensile mechanical properties of scaffolds in the longitudinal and circumferential directions: (A) tensile strength; (B) Young’s modulus; (C) failure strain (%).
In vitro degradation studies
A systematic study was performed to understand the degradation process of the PCL/PGC blend compositions (2:1, 3:1 and 4:1) over a 4 week period by soaking them in PBS (pH 7.3) solution.20–22,36 The effect of hydrolytic degradation on the mechanical properties of the scaffolds is shown in Figs 7(A)–7(C). The pure PGC scaffold (hydrated) decreased in tensile strength from 9.02 MPa to 5.64 MPa (by 37%) in longitudinally cut samples and from 5.52 MPa to 4.41 MPa (by 20%) in circumferentially cut samples within a week. Since the major component of PGC is hydrophilic polyglycolic acid, it degrades due to hydrolysis in an aqueous environment.45 Similarly, the tensile modulus changed from 19.17 MPa to 15.5 MPa (by 20%) in longitudinally cut samples and from 12.47 MPa to 10.7 MPa (by 14%) in circumferentially cut samples in a week. Blending of PCG with hydrophobic PCL stabilized the former and showed no appreciable decrease in strength or modulus. PCL/PGC scaffolds with ratios 2:1, 3:1, 4:1, and pure PCL scaffolds did not show any significant difference in the tensile strength and modulus within 1 week. However, after 4 weeks in PBS solution (pH 7.3), PCL/PGC blends as well as the pure polymer scaffolds changed their mechanical properties, as shown in Figs 7(A) and 7(B). It must be noted that pure PCL and PCL/PGC with a 4:1 ratio showed a substantial increase in their tensile strength and modulus after 4 weeks and the pure PGC scaffold degraded and fractured within 4 weeks. For example, the tensile strength increased from 1.64 MPa to 4.26 MPa and from 1.35 MPa to 3.05 MPa for pure PCL and 4:1 PCL/PGC scaffolds, respectively. After 4 weeks, the tensile modulus increased from 10.38 MPa to 16.5 MP and 5.1 MPa to 20.6 MPa, respectively, for longitudinally cut pure PCL and 4:1 PCL/PGC. These improved properties resulted from segment reorganization and hydrolysis of the amorphous phase of polyglycolide23,45 in PGC as well as stiffening of the elastic PCL due to ‘physical aging’ in the aqueous medium at 37 °C. The amorphous phases of PGA are more likely to be degraded first than the crystalline phases because of the low water penetration to the densely packed crystalline regions.46 As mentioned earlier, it takes about 2 years for PCL to degrade due to its hydrophobic nature. However, after 1 month of aging in the PBS solution, the elastic fibers became stiff. A similar trend could be observed with circumferentially cut samples too. These results are in agreement with the in vitro degradation study of PCL fibers by others.47 Moreover, a drastic decrease in the failure strain was noticed with the present scaffolds with more PGC mass fraction (pure PGC, 2:1 PCL/PGC and 3:1 PCL/PGC) than for scaffolds with more PCL mass fraction (pure PCL and 4:1 PCL/PGC scaffolds), as shown in Fig. 7(C).
Figure 7.

Effect of PBS degradation for 1 month on the mechanical properties of scaffolds in the longitudinal and circumferential directions: (A) tensile strength; (B) Young’s modulus; (C) failure strain (%).
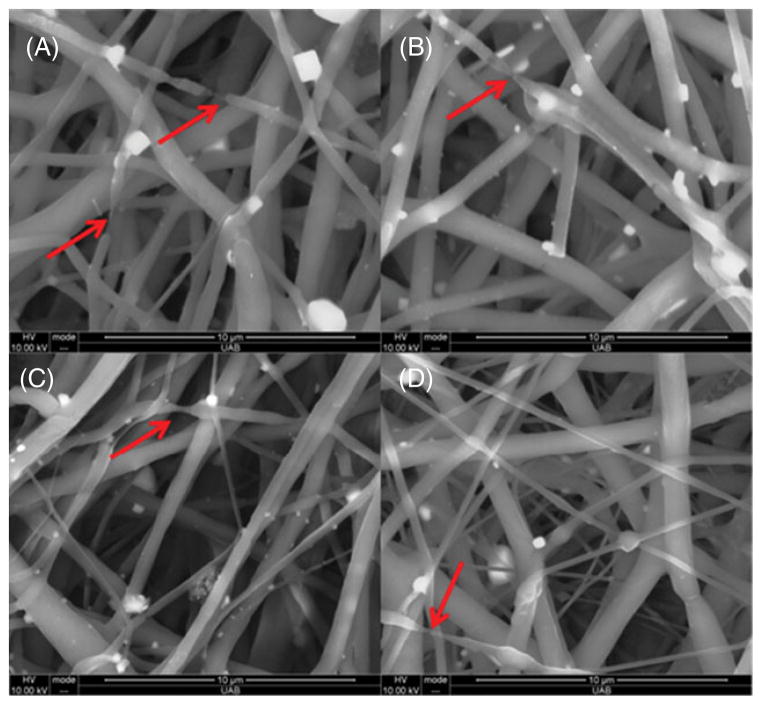
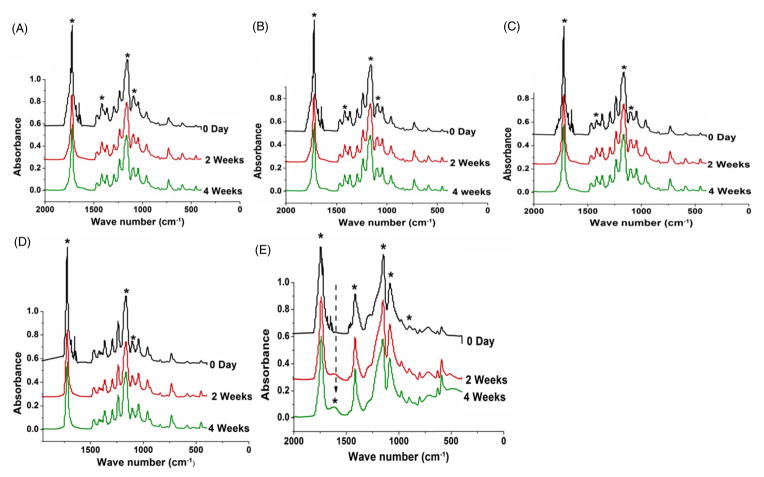
Figures 8(A) and 8(B) showed fiber breaking in the 2:1 and 3:1 blends after 4 weeks of in vitro degradation in PBS. The presence of broken fibers is a clear reason for a decrease in the mechanical strength of the aged scaffolds.22 However, fiber breaking was found to be less in 4:1 PCL/PGC and PCL scaffolds after 1 month of aging due to their hydrophobic nature and longer degradation time, as shown in Figs 8(C) and 8(D), compared with 2:1 blend scaffolds. The hydrolytic degradation of the polyesters can be noticed from the IR spectral change, specifically from ester-bond-related peaks.22 The peaks (marked by an asterisk) at 1720–1740 cm−1 (ester carbonyl peak from PCL and PGC), 1420 cm−1 (COO and C–H from PGC), 1147–1157 cm−1 (ester ether from PCL and PGC) and 1086 cm−1 (C–O–H peak from PGC) showed a decreased intensity after 4 weeks of degradation in the spectra of PCL/PGC blends (Figs 9(A)–9(C)). The pure PCL spectrum did not show a noticeable reduction in intensity of any peaks except the ester carbonyl peak at the end of 1 month (Fig. 9(D)) as reported by Peña et al.48 However, the IR spectrum of the pure PGC scaffold indicated a drastic decrease in the intensities of all vibrational peaks related to ester bonds (Fig. 9(E)). Moreover, peaks corresponding to the amorphous phase of PGA in PGC at around 850 and 713 cm−1 disappeared or decreased in intensity whereas peaks corresponding to the crystalline phase around 972, 901, 806, 627 cm−1 increased in intensity at 4 weeks showing hydrolytic erosion of the amorphous regions in PGC (Fig. 9(E)) as reported earlier.22 The appearance of a new peak around 1680 cm−1 attributed to the C–OH of the acetate end group (indicated by the arrow in Fig. 9(E)) and the broad hydrogen bonded O–H peak at 3400 cm−1 confirmed the polymer chain scission in the pure PGC scaffold. The 4:1 PCL/PGC blend exhibited spectral changes similar to those in pure PCL with very minor changes in peak intensity due to the slow degradation time of PCL. Among the 2:1 and 3:1 PCL/PGC blends, 2:1 PCL/PGC with a relatively higher mass fraction of PGC exhibited decreased intensities of PGC related peaks (Fig. 9(A)).
Figure 8.
SEM images (20 000×) illustrate the fiber quality and ECM mimicking morphology after 4 weeks in PBS solution at 37 °C: (A) 2:1; (B) 3:1; (C) 4:1; (D) pure PCL. The red arrows indicate fiber breakage due to degradation.
Figure 9.
FTIR spectra of PCL/PGC scaffolds after PBS degradation: (A) 2:1; (B) 3:1; (C) 4:1; (D) pure PCL; (E) pure PGC. The asterisks indicate the peaks affected by degradation.
Mass loss (%) data supported the trend in degradation of the blends observed with the mechanical and spectral properties. Compared with 2:1 PCL/PGC and 3:1 PCL/PGC with a mass loss of 4 ± 1.1 (%) and 2.5 ± 0.5 (%), respectively, 4:1 PCL/PGC did not show any significant mass loss after 4 weeks. Among the blends, 2:1 PCL/PGC with the highest mass fraction of PGC has the highest mass loss due to rapid degradation of the PGA component. In other words, the 4:1 PCL/PGC blend with the highest mass fraction of very slowly degrading PCL exhibited an unnoticeable mass loss, as observed in the case of the pure PCL scaffold. It is important to note that the pure PGC degraded drastically by 4 weeks.
The DSC technique was utilized to comprehend the changes in crystallinity and amorphous fractions of all three compositions through changes in enthalpy. The DSC data for blends collected at the second and fourth weeks are tabulated in Table 1. All three blend compositions exhibited an increase in crystallinity over 4 weeks of aging as indicated by the increase in the enthalpy of melting (Table 2). This behavior of PCL/PGC blends might be largely due to the ‘cleavage induced recrystallization’ of semicrystalline polymers20 such as PCL and PGC. This behavior can be correlated to the increase in Young’s modulus from 1 week to 4 weeks observed in Fig. 7(B). The recrystallization of the PCL/PGC blends with relatively higher mass fraction of PCL eventually leads to slower in vitro degradation.36 Again, a significant decrease in the melting temperature of the blends, corresponding to the PGC component at around 201 °C (Fig. 3), was noticed for all blend compositions, as shown Table 2. This decrease in melting temperature could be due to the chain scission of the PGA component. For instance, the PGC melting temperature at 200 °C for the 2:1 PCL/PGC composition broadened after 4 weeks.
Table 2.
DSC results for the effect of degradation over a 4 week period obtained by first scan
| Compositions of blends | Enthalpy ΔHf (J g−1) of the PCL component
|
Tm of the PGA component
|
||||
|---|---|---|---|---|---|---|
| 0 day | 2 weeks | 4 weeks | 0 day | 2 weeks | 4 weeks | |
| 2:1 PCL/PGC | 32.3 | 55.8 | 54.4 | 199.5 | 190 | 183.1 |
| 3:1 PCL/PGC | 49.1 | 64.8 | 57.4 | 199.8 | 192.9 | 189.6 |
| 4:1 PCL/PGC | 57.5 | 65.8 | 65.2 | 204 | 198.3 | 192.3 |
CONCLUSION
We have studied the important mechanical and degradation characteristics of three different blends of PCL and PGC (2:1, 3:1, 4:1) under physiological conditions. The addition of PGC to PCL significantly improved the tensile strength, modulus and failure strain (%) of the scaffolds which are critical parameters for tubular grafts for small diameter blood vessels. SEM images exhibited a co-continuous miscible phase morphology for the electrospun fibers of PCL/PGC blends. PBS uptake data and contact angle measurements indicated that the addition of PGC to PCL resulted in a tissue scaffold that is more hydrophilic than pure PCL. DSC scans confirmed that the addition of PGC to PCL resulted in a decrease in crystallinity. In vitro degradation suggested that incorporation of more durable PCL in PGC imparted hydrolytic stability to the blends for 1 month. PCL/PGC blends (2:1 and 3:1 ratios) were able to maintain their mechanical integrity with tensile strength and Young’s modulus comparable to blood vessels. FTIR spectral analysis showed ester bond scission in the scaffolds, especially in those with relatively higher PGC mass fraction (pure PGC and 2:1 PCL/PGC). The overall results showed 3:1 PCL/PGC to be a judicious blend composition for tubular grafts for vascular tissue engineering. Further studies on burst pressure, suture retention and compliance measurements will be required for the 3:1 PCL/PGC blend for its intended application as a vascular graft.
Acknowledgments
The research reported in this publication was supported by the National Center for Advancing Translational Sciences of the National Institutes of Health under Award Number R41TR001009. The content is solely the responsibility of the authors and does not necessarily represent the official views of the National Institutes of Health. The authors would like to acknowledge UAB Scanning Electron Microscopy facility for the imaging characterization.
References
- 1.Thomas V, Donahoe T, Nyairo E, Dean DR, Vohra YK. Acta Biomater. 2011;7:2070–2079. doi: 10.1016/j.actbio.2011.01.008. [DOI] [PubMed] [Google Scholar]
- 2.Wolfe PS, Sell SA, Bowlin GL. Natural and Synthetic Scaffolds. In: Pallua N, Suscheck CV, editors. Tissue Engineering: From Lab to Clinic. Springer-Verlag; Berlin: 2011. pp. 41–67. [Google Scholar]
- 3.Amass W, Amass A, Tighe B. Polym Int. 1998;47:89–144. [Google Scholar]
- 4.Liu W, Thomopoulos S, Xia Y. Advanced Healthcare Materials. 2012;1:10–25. doi: 10.1002/adhm.201100021. [DOI] [PMC free article] [PubMed] [Google Scholar]
- 5.Sell S, Barnes C, Smith M, McClure M, Madurantakam P, Grant J, et al. Polym Int. 2007;56:1349–1360. [Google Scholar]
- 6.Gunatillake PA, Adhikari R. Eur Cell Mater. 2003;5:1–16. doi: 10.22203/ecm.v005a01. [DOI] [PubMed] [Google Scholar]
- 7.Ravi S, Chaikof EL. Regen Med. 2010;5:107–120. doi: 10.2217/rme.09.77. [DOI] [PMC free article] [PubMed] [Google Scholar]
- 8.Zilla P, Bezuidenhout D, Human P. Biomaterials. 2007;28:5009–5027. doi: 10.1016/j.biomaterials.2007.07.017. [DOI] [PubMed] [Google Scholar]
- 9.Lu T, Li Y, Chen T. Int J Nanomed. 2013;8:337–350. doi: 10.2147/IJN.S38635. [DOI] [PMC free article] [PubMed] [Google Scholar]
- 10.Agarwal S, Wendorff JH, Greiner A. Polymer. 2008;49:5603–5621. [Google Scholar]
- 11.Badylak SF, Freytes DO, Gilbert TW. Acta Biomater. 2009;5:1–13. doi: 10.1016/j.actbio.2008.09.013. [DOI] [PubMed] [Google Scholar]
- 12.Rim NG, Shin CS, Shin H. Biomed Mater. 2013;8:014102. doi: 10.1088/1748-6041/8/1/014102. [DOI] [PubMed] [Google Scholar]
- 13.Song Y, Feijen J, Grijpma D, Poot A. Clin Hemorheol Microcirc. 2011;49:357–374. doi: 10.3233/CH-2011-1486. [DOI] [PubMed] [Google Scholar]
- 14.Chu C. J Appl Polym Sci. 1981;26:1727–1734. [Google Scholar]
- 15.Stitzel J, Liu J, Lee SJ, Komura M, Berry J, Soker S, et al. Biomaterials. 2006;27:1088–1094. doi: 10.1016/j.biomaterials.2005.07.048. [DOI] [PubMed] [Google Scholar]
- 16.Yin A, Zhang K, McClure MJ, Huang C, Wu J, Fang J, et al. J Biomed Mater Res A. 2013;101:1292–1301. doi: 10.1002/jbm.a.34434. [DOI] [PubMed] [Google Scholar]
- 17.McClure M, Sell S, Ayres C, Simpson D, Bowlin G. Biomed Mater. 2009;4:055010. doi: 10.1088/1748-6041/4/5/055010. [DOI] [PubMed] [Google Scholar]
- 18.Bezwada RS, Jamiolkowski DD, Lee I-Y, Agarwal V, Persivale J, Trenka-Benthin S, et al. Biomaterials. 1995;16:1141–1148. doi: 10.1016/0142-9612(95)93577-z. [DOI] [PubMed] [Google Scholar]
- 19.Thomas V, Zhang X, Catledge SA, Vohra YK. Biomed Mater. 2007;2:224–232. doi: 10.1088/1748-6041/2/4/004. [DOI] [PubMed] [Google Scholar]
- 20.Thomas V, Zhang X, Vohra YK. Biotechnol Bioeng. 2009;104:1025–1033. doi: 10.1002/bit.22467. [DOI] [PubMed] [Google Scholar]
- 21.Jayabalan M, Lizymol PP, Thomas V. Polym Int. 2000;49:88–92. [Google Scholar]
- 22.Zhang X, Thomas V, Vohra YK. J Biomed Mater Res B Appl Biomater. 2009;89:135–147. doi: 10.1002/jbm.b.31196. [DOI] [PubMed] [Google Scholar]
- 23.Vieira A, Vieira J, Ferra J, Magalhães F, Guedes R, Marques A. J Mech Behav Biomed Mater. 2011;4:451–460. doi: 10.1016/j.jmbbm.2010.12.006. [DOI] [PubMed] [Google Scholar]
- 24.Zhou X, Cai Q, Yan N, Deng X, Yang X. J Biomed Mater Res A. 2010;95:755–765. doi: 10.1002/jbm.a.32896. [DOI] [PubMed] [Google Scholar]
- 25.Thomas V, Dean DR, Vohra YK. Curr Nanosci. 2006;2:155–177. [Google Scholar]
- 26.Yang J-M, Chen H-L, You J-W, Hwang JC. Polym J. 1997;29:657–662. [Google Scholar]
- 27.Porjazoska A, Karal-Yilmaz O, Kayaman-Apohan N, Cvetkovska M, Baysal BM. Croatica Chem Acta. 2004;77:545–551. [Google Scholar]
- 28.Dell’Erba R, Groeninckx G, Maglio G, Malinconico M, Migliozzi A. Polymer. 2001;42:7831–7840. [Google Scholar]
- 29.Peng M, Li D, Shen L, Chen Y, Zheng Q, Wang H. Langmuir. 2006;22:9368–9374. doi: 10.1021/la061154g. [DOI] [PubMed] [Google Scholar]
- 30.You Y, Youk JH, Lee SW, Min B-M, Lee SJ, Park WH. Mater Lett. 2006;60:757–760. [Google Scholar]
- 31.Bognitzki M, Frese T, Steinhart M, Greiner A, Wendorff JH, Schaper A, et al. Polym Eng Sci. 2001;41:982–989. [Google Scholar]
- 32.Shum AW, Mak AF. Polym Degrad Stabil. 2003;81:141–149. [Google Scholar]
- 33.Chu C, Zhang L, Coyne L. J Appl Polym Sci. 1995;56:1275–1294. [Google Scholar]
- 34.Spearman SS, Rivero IV, Abidi N. J Appl Polym Sci. 2013;128:4040–4046. [Google Scholar]
- 35.Aghdam RM, Najarian S, Shakhesi S, Khanlari S, Shaabani K, Sharifi S. J Appl Polym Sci. 2012;124:123–131. [Google Scholar]
- 36.Schindler C, Williams BL, Patel HN, Thomas V, Dean DR. Polymer. 2013;54:6824–6833. [Google Scholar]
- 37.Dickers KJ, Huatan H, Cameron RE. J Appl Polym Sci. 2003;89:2937–2939. [Google Scholar]
- 38.Chung TW, Yang MG, Liu DZ, Chen WP, Pan CI, Wang SS. J Biomed Mater Res A. 2005;72:213–219. doi: 10.1002/jbm.a.30225. [DOI] [PubMed] [Google Scholar]
- 39.Zhang X, Thomas V, Vohra YK. J Mater Sci Mater Med. 2010;21:541–549. doi: 10.1007/s10856-009-3922-y. [DOI] [PubMed] [Google Scholar]
- 40.Holzapfel GA, Sommer G, Gasser CT, Regitnig P. Am J Physiol Heart Circ Physiol. 2005;289:H2048–H2058. doi: 10.1152/ajpheart.00934.2004. [DOI] [PubMed] [Google Scholar]
- 41.Sell S, McClure MJ, Barnes CP, Knapp DC, Walpoth BH, Simpson DG, et al. Biomed Mater. 2006;1:72–80. doi: 10.1088/1748-6041/1/2/004. [DOI] [PubMed] [Google Scholar]
- 42.Kurane A, Simionescu DT, Vyavahare NR. Biomaterials. 2007;28:2830–2838. doi: 10.1016/j.biomaterials.2007.02.031. [DOI] [PMC free article] [PubMed] [Google Scholar]
- 43.Yamada H, Evans FG. Strength of Biological Materials. Williams & Wilkins; Baltimore, MD: 1970. [Google Scholar]
- 44.Fung Y. Blood flow in arteries. In: Fung YC, editor. Biomechanics. Springer; New York: 1997. pp. 108–205. [Google Scholar]
- 45.Szycher M. High Performance Biomaterials: A Complete Guide to Medical and Pharmceutical Applications. CRC Press; Boca Raton, FL: 1991. [Google Scholar]
- 46.Tsuji H, Mizuno A, Ikada Y. J Appl Polym Sci. 2000;76:947–953. [Google Scholar]
- 47.Bölgen N, Menceloğlu YZ, Acatay K, Vargel I, Pişkin E. J Biomater Sci Polym Ed. 2005;16:1537–1555. doi: 10.1163/156856205774576655. [DOI] [PubMed] [Google Scholar]
- 48.Peña J, Corrales T, Izquierdo-Barba I, Doadrio AL, Vallet-Regí M. Polym Degrad Stabil. 2006;91:1424–1432. [Google Scholar]


