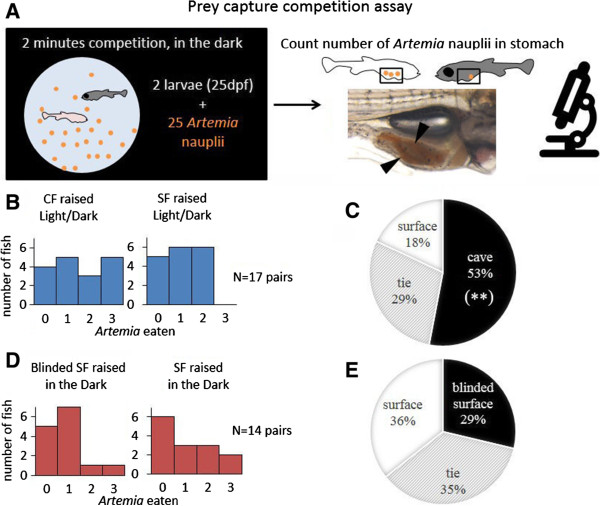
Figure 1.

Prey competition in the dark with pairs of 4 week post-fertilization fish larvae. (A) Diagram of the experimental design. (B, D) Distribution histogram showing the number of Artemia nauplii eaten by each type of fish during the paired competitions. In (B), P = 0.076 and in (C) P = 0.7253 for paired matches comparisons (Wilcoxon paired test). (C, E) Pie charts showing the distribution of ‘winner’ fish, that is, the fish type showing the highest numbers of Artemia larvae in their stomach. Cave fish globally outcompeted surface fish in the prey capture competition (C, P = 0.0097**; Fisher’s exact test), while surface fish with lensectomy performed equally well to surface fish raised in darkness (E, P = 0.7688; Fisher’s exact test).
