Abstract
Movements are a major source of artifacts in functional Near-Infrared Spectroscopy (fNIRS). Several algorithms have been developed for motion artifact correction of fNIRS data, including Principal Component Analysis (PCA), targeted Principal Component Analysis (tPCA), Spline Interpolation (SI), and Wavelet Filtering (WF). WF is based on removing wavelets with coefficients deemed to be outliers based on their standardized scores, and it has proven to be effective on both synthetized and real data. However, when the SNR is high, it can lead to a reduction of signal amplitude. This may occur because standardized scores inherently adapt to the noise level, independently of the shape of the distribution of the wavelet coefficients. Higher-order moments of the wavelet coefficient distribution may provide a more diagnostic index of wavelet distribution abnormality than its variance. Here we introduce a new procedure that relies on eliminating wavelets that contribute to generate a large fourth-moment (i.e., kurtosis) of the coefficient distribution to define “outliers” wavelets (kurtosis-based Wavelet Filtering, kbWF). We tested kbWF by comparing it with other existing procedures, using simulated functional hemodynamic responses added to real resting-state fNIRS recordings. These simulations show that kbWF is highly effective in eliminating transient noise, yielding results with higher SNR than other existing methods over a wide range of signal and noise amplitudes. This is because: (1) the procedure is iterative; and (2) kurtosis is more diagnostic than variance in identifying outliers. However, kbWF does not eliminate slow components of artifacts whose duration is comparable to the total recording time.
Keywords: Functional Near-Infrared Spectroscopy (fNIRS), Motion artifacts, Wavelet filtering, Kurtosis
Introduction
Functional NIRS is a rapidly developing brain imaging technique that allows for the monitoring of tissue oxygenation in-vivo (Villringer & Chance, 1997; Obrig et al., 2000). Oxy- and deoxy-hemoglobin have different absorption spectra in the NIR range (wavelengths between 650 and 900 nm). Water’s low absorption within this same wavelength range makes it possible to measure both the absolute and relative concentration of these substances. The relative low cost, adaptability to different recording environments, and low invasivity of fNIRS make it a widely applicable brain imaging method in many different populations and experimental and clinical conditions (e.g., Boas et al., 2014; Farroni et al. 2014; Fabiani et al., 2014; Fallgatter et al., 1997; Gallagher et al., 2007; Grossmann et al.; 2008, Lloyd-Fox et al., 2010; Mahmoudzadeh et al., 2013; Roche-Labarbe et al., 2008; Watanabe et al., 2000). As for other imaging methods, however, subjects’ movements during the recordings tend to generate significant artifacts in fNIRS data.
When subjects move their heads movement artifacts can occur because this movement can cause a shift or de-coupling between the sources or detectors (optodes) and the scalp, resulting in sudden changes in light intensity. Although a good coupling method between the optical fibers and the scalp can strongly attenuate these effects, it is hard to completely avoid these artifacts, particularly in subjects for whom fMRI may not be applicable, such as patient populations or children. Movement artifacts are characterized by periods of high-frequency noise, which may be followed by a lasting intensity shift, when the coupling of the optode to the scalp is altered permanently. Importantly, therefore, movement artifacts include both high- and low-frequency components, and cannot be easily corrected by frequency filtering. The high intensity, time and spectral features of these artifacts can deeply distort any statistical inferences and functional signal identifications that rely on Gaussian noise distribution (such as least-square methods used in averaging procedures, General Linear Models, etc.). This makes it necessary to develop procedures for removing the effects of movement artifacts before applying the statistical analysis methods.
Discarding all recording periods during which artifacts occur is typically not a viable option. The hemodynamic signal on which fNIRS is based accrues slowly, taking approximately 7 s to reach its maximum. Thus, an appropriate analysis of fNIRS data requires extended periods that are free of artifacts. Further, one of the attractive features of fNIRS is its applicability to a large range of ages and patient groups, and the possibility of monitoring patients at their bedside or in other difficult-to-control conditions (Mahmoudzadeh et al., 2013; Fallgatter et al., 1997; Watanabe et al., 2000). This makes developing optimal motion artifact removal algorithms particularly desirable.
To address this important issue, several investigators have proposed motion correction algorithms for fNIRS. An optimal artifact removal algorithm should be able to identify the movement signal and subtract it from the recorded data while leaving the functional data of interest completely intact. To achieve this result the algorithm needs to comprise two main logical steps: (1) Finding a principled way of decomposing the recorded data into signal and artifact; (2) finding a ‘rule’ to eliminate only the artifact from a given decomposition, without affecting the signal. Both of these steps should rely on known features of the signal and the artifact.
Motion correction methods can be broadly divided into two categories: those that require alteration of the experimental design and those that do not. The first category involves the use of an added input signal, which is highly sensitive to motion artifacts but not to the functional response of interest, such as an accelerometer (e.g., Blasi et al., 2010; Virtanen et al., 2011), or an fNIRS channel not sensitive to brain activity (e.g., Izzetoglu et al., 2010; Robertson et al., 2010; Gagnon et al., 2014). Correlation methods and/or adaptive filtering are then used to decompose the data variance into artifacts and signal. A potential problem with this approach is that it is typically based on the assumption that the movement effects on the channels carrying the brain signal are linearly (or at least monotonically) related to the movement effects on the channels used to monitor the movements. It is not clear, however, that this is always the case. Some movements may generate artifacts in one channel and not another, and the amplitude of the intensity shift is difficult to predict from the amplitude of the movement. Further, this approach may not predict the occurrence of permanent shifts in light intensity after a movement.
In this paper we focus on the second category of movement-correction algorithms, which can be applied to standard datasets without alterations of the recording procedures, and which can therefore avoid some of the issues highlighted above. This category includes Principal Component Analysis (PCA, Zhang et al., 2005), Spline Interpolation (SI, Scholkmann et al., 2010), targeted PCA (tPCA, Yücel et al., 2014), and Wavelet Filtering (WF, Molavi & Guy, 2012). All these techniques are based on identifying large sources of variance in the data, which are defined as artifacts and subtracted out. While these methods vary substantially in how sources of variance are identified, they follow very similar procedures for the subtraction step.
Here we propose a novel algorithm (kurtosis-based wavelet filtering, kbWF) and compare this approach to the other methods within this category. Since kbWF is a modification of the WF method, it is first useful to explain how WF works. WF is based on a Discrete Wavelet Transform (DWT, Akansu & Haddad, 2010) decomposition of each single channel data, and on the analysis of the resulting wavelet coefficients and their variation over time. Specifically, distributions of wavelets coefficients are computed for each frequency, and individual coefficients that are higher than a criterion number of standard deviations away from the average for that particular frequency (corresponding to low-probability of occurrence when a normal distribution can be assumed) are assumed to reveal the presence of an artifact. They are therefore zeroed, and the data are then transformed back into time series with their effects subtracted out. WF has been shown to be highly effective in removing movement artifacts from both synthetized and real data while preserving functional information (Cooper et al., 2012; Brigadoi et al., 2014). In our opinion this is due to two main reasons:
As WF analysis is conducted independently in different channels, and unlike PCA-based methods, it does not assumes that artifacts should show proportional effects at different channels;
A broad range of frequencies over time is considered, enabling correction of both fast and slow frequency artifacts.
Note that the WF method requires establishing only one parameter: the threshold value for wavelet coefficient rejection. Several studies have been performed to establish the optimal threshold (Cooper et al., 2012; Molavi & Guy, 2012; Brigadoi et al., 2014; Yücel et al., 2014). However the “ideal” threshold parameter (which reflects the expected probability for a particular coefficient to be classified as artifactual) should vary as a function of the frequency of artifacts in the data. Since computation of this frequency requires the selection of a specific threshold, there is some circularity in threshold selection, which can only be addressed by using arbitrary fixed values. In practice, the effectiveness of WF in removing only the artifacts without reducing the signal can be strongly affected by the SNR of the original data.
To address this limitation of WF we introduce a new procedure for identifying artifactual wavelet coefficients.
The new algorithm is iterative and based on the idea that artifactual coefficients should be abnormally large, and therefore lead to departures from normality in the distributions of the wavelet coefficients.
Departures from normality can be estimated using higher-order moments of the distribution of the wavelet coefficients, such as kurtosis (Joanes & Gill, 1998) of the DWT decomposition weights (hence the name kurtosis-based Wavelet Filtering, kbWF). Kurtosis is the fourth standardized moment of a distribution, and it is an established method for testing the shape characteristics of a signal when compared to a Gaussian distribution. In fact, as we will demonstrate below, the wavelet coefficients generated by fNIRS signals tend to have sub-Gaussian (kurtosis <3) or Gaussian (kurtosis=3) features (reflecting the absence of outlier values). In contrast, contaminated data tend to have super-Gaussian (kurtosis >3) properties (reflecting the presence of outlier values). Importantly, this occurs by-and-large independently of the data’s SNR, indicating that even large-amplitude fNIRS signals generate wavelet-coefficient distributions with sub-Gaussian or Gaussian properties. Thus, the presence of a large kurtosis in the wavelet-coefficient distribution is a telltale sign of the presence of artifacts in the fNIRS recording. In other words, contamination of a particular channel can be identified by a large kurtosis (i.e., kurtosis > threshold) in a particular wavelet distribution. To eliminate the artifact, the individual coefficients are examined, the most extreme are zeroed out, and the kurtosis is computed again (without considering the zero values). If the kurtosis still exceeds the threshold value, the next most extreme values are set to zero, and a new kurtosis is computed. The procedure is repeated until the kurtosis is below the threshold value. Then the time series is recomputed based on the remaining wavelet coefficients. As for the standard WF method, only one parameter needs to be set (the “threshold” used to discard extreme wavelet coefficients). However, differently from WF, this parameter is expected to be largely independent of SNR conditions, so that the same value can be used for all recording conditions, greatly facilitating the motion correction process.
It has already been shown that using kurtosis (or similar “heavy-tailed” distribution estimators) is an effective procedure for wavelet denoising (Ravier & Amblard, 1998; Achim et al.; 2003; Sharma et al, 2010). However these algorithms were thus far tested within completely different frameworks and for different applications. In the remainder of this paper we will compare the performance of kbWF to that of other motion correction methods to show that it performs reliably over a wide range of SNRs. This characteristic would make the algorithm suitable to be applied to fNIRS data recorded in a variety of conditions, without fine-tuning of parameters. To compare kbWF to other methods we used simulated data. As a signal, we use a synthesized hemodynamic response function (HRF) of varying intensity. As noise, due to the difficulty of generating simulated motion noise with properties similar to real recordings, we used actual recordings from human subjects varying in age between 18 and 78 years, obtained during a resting-state paradigm.
Methods
Resting-state fNIRS data
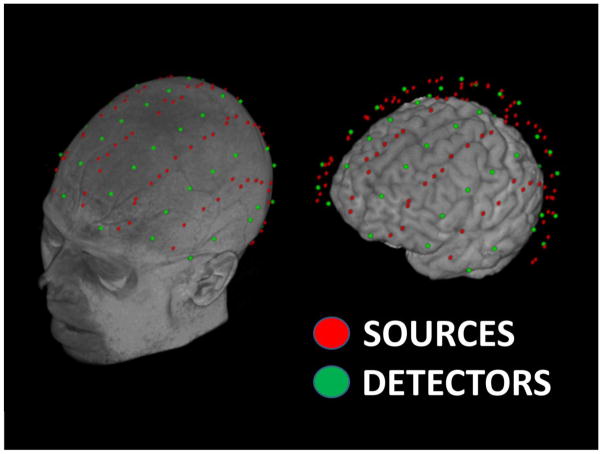
Twenty participants (age range 18–78, average age 42 years, 9 women) signed informed consent as approved by the University of Illinois Institutional Review Board. They performed a resting-state paradigm (e.g., Eggebrecht et al, 2014), in which they were instructed to look at the monitor and to try not to think of anything in particular. Specifically, they underwent eight 5-minutes fNIRS blocks, with slightly different optode montages for each session, allowing for fNIRS data acquisition from the entire scalp surface. Figure 1 shows source and detector locations, rendered onto the T1 MRI image and extracted brain of a representative subject. Importantly, this dataset, because of the involvement of participants of different ages, the use of a large number of scalp locations, and the long overall recording time (more than 30 minutes), included a wide range of motion artifacts.
Figure 1.
Source and detector locations rendered on the T1 MRI image and extracted brain of a representative subject. The optode montages allowed acquisition of fNIRS data from the entire scalp surface.
The fNIRS data were acquired with a multi-channel frequency-domain NIR spectrometer (ISS Imagent™, Champaign, Illinois) equipped with 128 laser diodes (64 emitting light at 690 nm and 64 at 830 nm) and 24 photo-multiplier tubes (PMTs). Time multiplexing was employed, so that each detector picked up light from 16 different sources at different times within a multiplexing cycle. A total of 384 channels were acquired for each block, with source-detector distances varying between 1.5 and 8.0 cm. Channels with low light (DC intensity < 20 A/D counts, average = 85 ± 5 channels per participant) were excluded from further analysis. These channels typically corresponded to long source-detector distances. Data obtained under these conditions are typical of those obtained in most fNIRS experiments, despite the absence of an active cognitive task (Eggebrecht et al., 2014).
Processing stream
A critical assumption of kbWF is that a typical hemodynamic response function (HRF) should generate distributions of wavelet coefficients that have Gaussian or sub-Gaussian properties (i.e., distributions with kurtosis ≤ 3). In order to evaluate the validity of this assumption we synthetized typical HRFs by convolving stimulus design matrices with the canonical HRF (Ye et al., 2009). Further, we were interested in determining whether the kurtosis values varied as a function of the interval between stimuli (10–30 sec), and of different stimulus durations (0–30sec), both variables that may affect the distribution of the wavelet coefficients over time. The total time of simulated recording was fixed to 300 sec (5 minutes). A small amount of Gaussian noise (SD = 0.05 of the maximum HRF value) was added to the simulated HRFs, and a DWT was applied to the data.
A separate simulation was used to estimate the performance of kbWF and to compare it with that of other currently used motion-correction methods. To this end, we combined synthesized HRFs of various amplitudes (to represent “signals”) with actual fNIRS data from resting state conditions (to represent “noise”) using the following analysis steps. First, optical density (OD) was estimated using intensity signals down-sampled to a sampling rate of 10 Hz. A synthetized HRF was added to the OD NIRS signals, with a maximum intensity change ranging between 1% and 5%. These intensity changes are compatible with real recorded changes caused by functional fluctuation of hemoglobin concentrations in the brain at the considered wavelengths (Yücel et al., 2014). HRFs were obtained by convolving the stimulus model with the canonical HRF. For this analysis, the simulated stimulus for each data set consisted of 4 trials with an inter-stimulus interval between 20 and 30 seconds and a stimulus duration of 20 seconds. The HRFs were added to the resting-state OD signals for each channel. To make the analysis stream consistent with that typically used to analyze real data, a high-pass filter was applied to the data with a cut-off frequency of 0.01Hz (IIR 5th order Butterworth filter) to suppress slow drifts. We then applied the kbWF algorithm as well as other artifact correction methods (WF, SI, tPCA, PCA). Finally, signals were convolved with the canonical HRF and compared to the synthetic original HRF by applying the General Linear Model (GLM, Ye et al., 2009) separately for each motion correction method (as well as for uncorrected data). This analysis was repeated for each channel, subject, and HRF amplitude condition. This method allowed us to compute separate metrics for each motion correction method and for each channel, subject, and HRF amplitude, and to compare these metrics with those obtained when the data were not motion-corrected.
Motion Correction algorithms
Kurtosis-based wavelet filtering
The kbWF algorithm is iterative and based on the evaluation of the fourth standardized moment (kurtosis) of the distribution of DWT coefficients for the chosen decomposition level. The kurtosis k is estimated using the following formula for sample kurtosis:
where n is the sample size, X̄i the ith sample and X̄ the sample average.
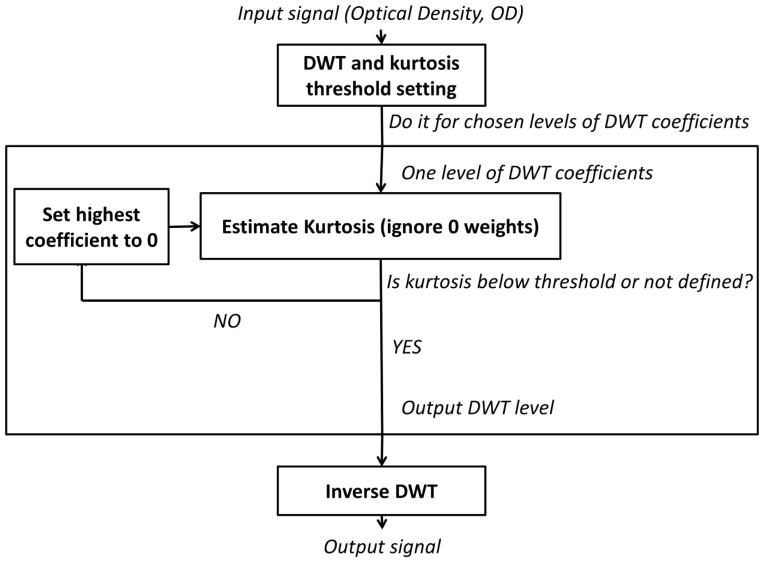
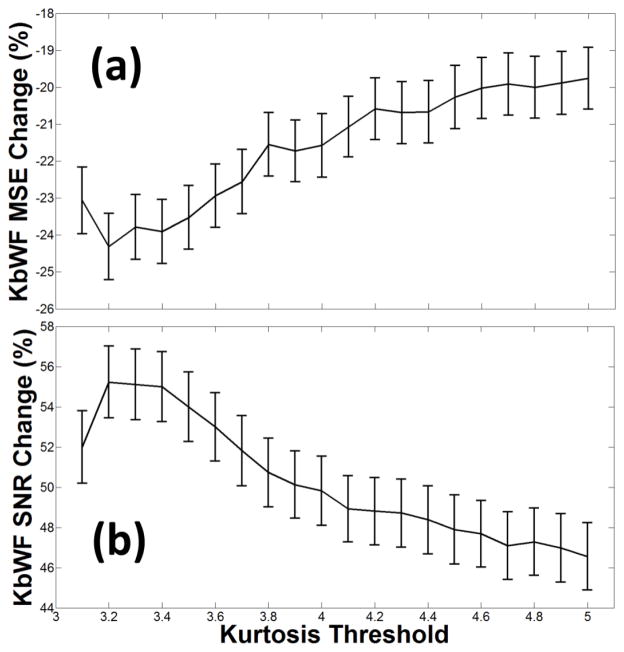
Figure 2 reports the algorithm stream. For each channel the optical density (OD) is estimated for each data point. The DWT is applied to the OD data and a kurtosis threshold for the wavelet coefficient distribution is chosen. We empirically estimated that kurtosis thresholds between 3.1 and 3.5 give similar results (see Results section, Figure 6). Therefore we set the same kurtosis (k = 3.3) for all our analyses. Considering the sampling rate and the total duration of the experiment, data permitted a minimum decomposition level of 3 and a maximum decomposition level of 10. For the chosen decomposition level the procedure estimates the kurtosis value of the coefficient distribution (ignoring zero values). If the kurtosis exceeds the threshold, the highest coefficient (in absolute value) is set to 0. The algorithm iterates until the estimated kurtosis is below the threshold. After scanning through all the different decomposition levels the procedure performs an inverse DWT to estimate the artifact-free time-course. Note that kurtosis cannot be computed when the distribution comprises 4 values or less. Therefore the kbWF algorithm was applied starting from the third wavelet discretization level (yielding 8 coefficient values). In agreement with previous works (Molavi & Guy, 2012), a Daubechies 5 (db5) wavelet was chosen for the DWT. MATLAB’s wavelab 850 toolbox (www-stat.staqndford.edu/-wavelab was used to perform both the DWT and the inverse DWT.
Figure 2.
A schematic depiction of the kurtosis-based Wavelet Filtering (kbWF) algorithm’s processing stream.
Figure 6.
(a) Average MSE changes (%) and related standard errors as a function of kurtosis threshold. (b) Average SNR changes (%) and related standard errors as a function of kurtosis threshold.
Note that kbWF assumes (a) that physiological- and artifact-related signals are additive; (b) that the probability distribution for “real” signals (see first simulation) of the wavelet coefficients is Gaussian or sub-Gaussian (as estimated through kurtosis); and (c) that motion artifacts are large enough to influence the kurtosis of the wavelet coefficient distributions. Motion artifacts smaller than this level are not corrected.
Wavelet procedures based on outlier removal (WF)
This WF method is modeled after the one proposed by Molavi and Guy (2012) and is similar to kbWF, except for the procedures used to decide that an artifact has occurred. For WF, an artifact occurs when the standardized score of particular wavelet coefficient (relative to the distribution of wavelet coefficients for each DWT decomposition level) is greater (in absolute value) than a particular threshold value. Note that, as in Molavi and Guy (2012), the standard deviation of the coefficient distribution is estimated using the absolute median deviation (Hoaglin et al., 1983). The threshold value is set to correspond to a particular probability value α, based on a normal distribution of the wavelet coefficients. Then WF sets the outlier coefficients to zero before computing the inverse DWT to generate the “motion-corrected” data. WF assumes (a) that physiological- and artifact-related signals are additive; (b) that the distribution of the wavelet coefficients is Gaussian; and (c) that the wavelet coefficients corresponding to motion artifacts at a particular decomposition level are larger than those corresponding to the hemodynamic signal.
Because of the need to have a sufficient number of samples to estimate variance reliably, the WF algorithm was applied starting from the third discretization level. Note also that the value used for artifact detection may depend on SNR, and may therefore vary as a function of the data set used. To examine the effects of choosing different threshold values, we used different probability threshold for α = 0.01, 0.05, 0.1, 0.2, and 0.3.
Principal Component Analysis
The HOMER2 NIRS package function hmrMotionCorrectPCA (Huppert et al., 2009) was used to apply the PCA algorithm to our data. This algorithm applied PCA decomposition (Jolliffe, 2005) by orthogonalizing the signal time-courses among all the channels. The uncorrelated principal components obtained are then ordered as a function of the variance of the original data they account for. The algorithm removes the first M components from the signal, so that a pre-specified proportion of the total variance (v) is removed (Zhang et al., 2005). We used two variance thresholds: v=90%, and v =97% (Cooper et al., 2012).
Targeted Principal Component Analysis
tPCA was implemented using HOMER2 NIRS processing package functions (Huppert et al., 2009). This method is similar to the PCA described above, but uses only a selected set of data points that are deemed to contain artifacts, and can also be iterated multiple times. This reduces the risk of eliminating the physiological signal from the data (Yücel et al., 2014). The period classification algorithm requires that multiple parameters be set: if, for any channels, the SD or peak-to-peak amplitudes within a time window t exceed their pre-set thresholds (SDth and AMPth, respectively) the period T is classified as an artifact for all the channels considered. Parameters v (variance to be excluded) and I (number of iterations) need also to be set. We used values previously reported to be effective in most conditions (Cooper et al., 2012, Yücel et al., 2014): SDth=20, AMPth=0.5, t=0.5 s, T=2 s, v=0.97, I=3. Both PCA and tPCA assume that motion artifacts are much larger than “true” fNIRS signals. For PCA no assumption about the frequency of motion artifacts is made. tPCA, in contrast, selects points with high variance, which are inherently high-frequency points. Both assume that motion artifacts extend across a number of recording channels, and in fact assume that they are characterized by a small set of principal components, possessing characteristic amplitude ratios across different channels.
Spline Interpolation
SI interpolates periods classified as motion artifacts, identified separately on each channel, using a cubic spline interpolation (Scholkmann et al., 2010). Periods are classified as artifactual in the same manner as for tPCA, but SI and tPCA differ on how the artifacts are removed. In fact, SI removes artifacts separately for each channel using an independent spline interpolation procedure, while tPCA removes artifacts on all channels together using the same principal component (although giving different weights to different channels). In order to detect periods containing motion artifact we used function hmrMotionArtifactByChannel of the HOMER2 NIRS package (Huppert et al., 2009). Spline interpolation was then performed using function hmrMotionCorrectSpline. The SI algorithm requires settings for the same parameters used by the tPCA described above, in order to identify the artifact periods. In addition, a spline interpolation parameter p needs to be determined. We used values reported to be effective in most cases (Cooper et al., 2012; Yücel et al., 2014): SDth=20, AMPth=0.5, t=0.5 s, T=2 s, p=0.99.
SI does not assume any particular distribution of motion artifacts, but focuses on high-frequency phenomena for their detection. No particular relationship between artifacts across different channels is assumed.
Metrics for algorithm comparison
The General Linear Model (GLM, Ye et al., 2009) was used to compare the outcome of each motion correction method. This approach was preferred to the methods used in previous studies (averaging, e.g., Cooper et al., 2012, Brigadoi et. al., 2013, Yücel et al., 2014) because it provides metrics that are sensitive to the overall SNR of the data, and is an widely used method for the analysis of fMRI and fNIRS data (Friston, 2003; Ye et al., 2009). Two metrics were calculated for each artifact removal algorithm: (1) the mean squared error (MSE) between the HRF and the ODs, and (2) an estimated SNR, computed by dividing the beta value β, obtained by applying the GLM with the HRF as regressor, and the standard deviation of the OD during the resting periods σrest.
Separate MSEs and SNRs were computed for each channel, block, subject, and correction method. For display purposes we also computed the average MSEs and SNRs obtained for each subject and measurement.
Results
Kurtosis characteristics of signal and noise
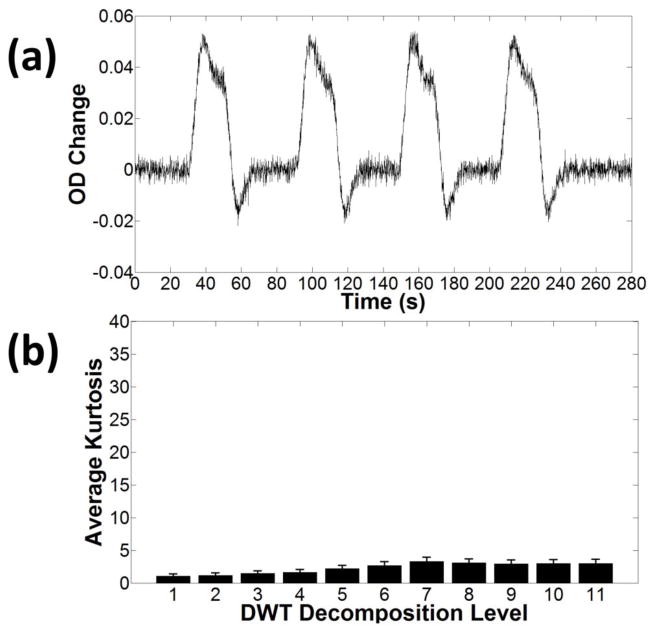
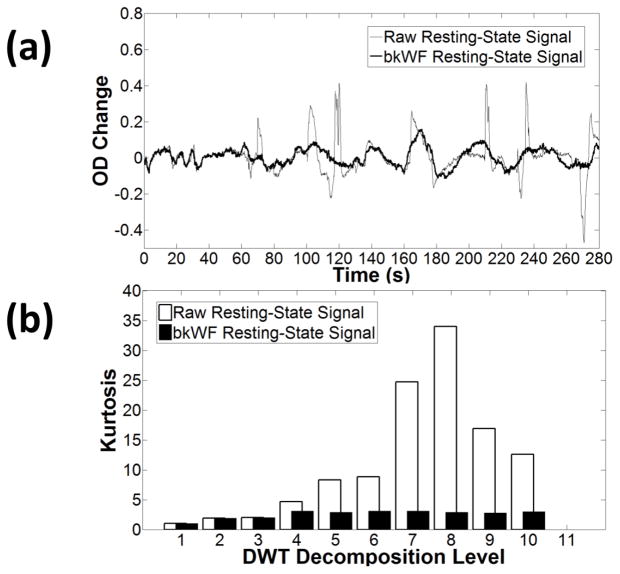
Examples of the kurtosis values of the wavelet coefficient distributions (for each decomposition level of the DWT) derived from signal (synthesized HRFs, to which Gaussian noise was added) and motion noise (actual data from a resting state condition) are reported in Figures 3 and 4, respectively. As expected, the data for the synthesized HRFs show sub-Gaussian (kurtosis<3) or Gaussian (kurtosis~3) distributions of the DWT coefficients for each level of decomposition (Figure 3b), even when a low level of Gaussian noise is added. In contrast, the raw fNIRS data (Figure 4) show markedly super-Gaussian distributions of the wavelet coefficients, with kurtosis ≫ 3. As it could be expected, the kurtosis is greatly reduced when kbWF is applied (figure 4b).
Figure 3.
(a) Example of an HRF obtained by convolving the stimulus-design matrix with the canonical HRF. A small amount of Gaussian noise was added to the data. (b) Average kurtosis and related standard errors for different discretization levels of the DWT. The average was computed between different inter-stimulus intervals (10–30 sec), and different stimulus durations (0–30 sec).
Figure 4.
(a) Example of optical density (OD) changes before and after applying the kbWF algorithm to resting-state fNIRS data. (b) Kurtosis as a function of the level of DWT decomposition before and after applying the kurtosis-based Wavelet Filtering (kbWF) algorithm.
Comparison of kbWF with other motion correction algorithms
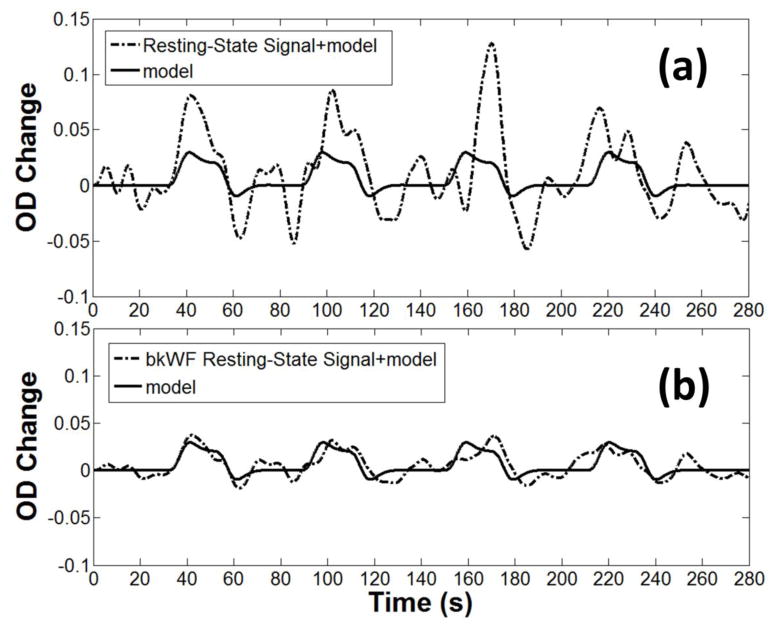
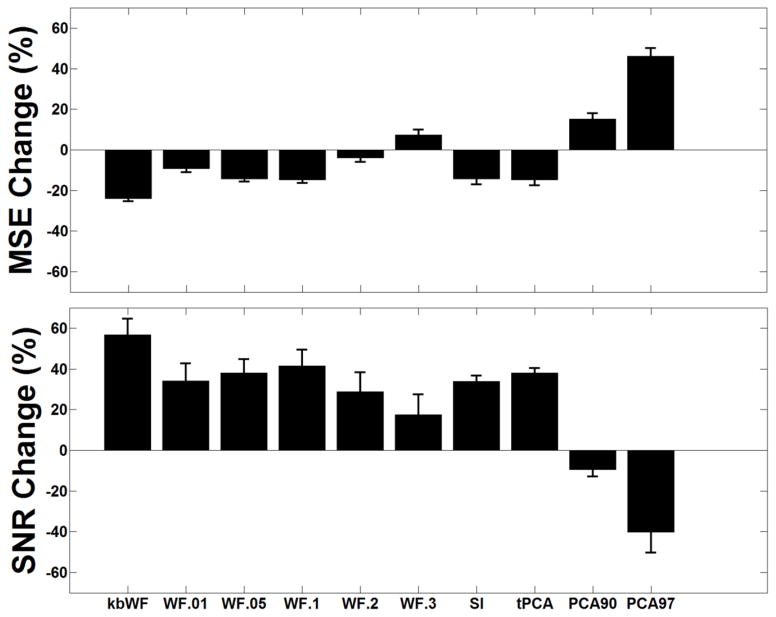
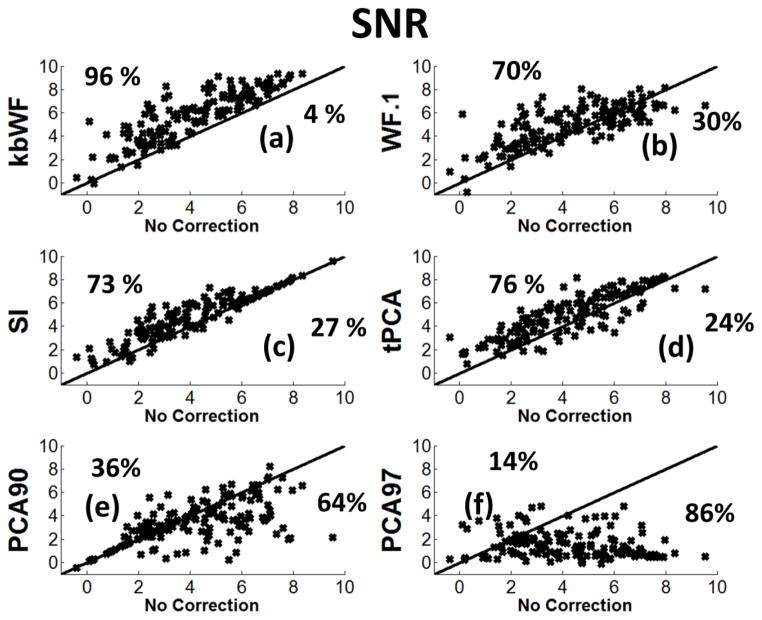
Figure 5 reports an example of the composite waveform obtained by adding the synthesized HRF to the real resting state fNIRS data, before (top, a) and after (bottom, b) the application of the kbWF algorithm (k=3.3). The SNR improvement after correction is clearly evident. We also assessed the extent to which the performance of the kbWF method (measured in terms of change of SNR and MSE) was sensitive to the choice of kurtosis threshold. As shown in Figure 6, a kurtosis threshold of 3.3 produced optimal results. To compare the new procedure with pre-existing algorithms, we computed the MSEs and SNRs for each subject, block, and procedure before and after the application of each algorithm. The results obtained with these metrics are shown in Figure 7, which reports the average changes and their related standard errors (computed across subjects, blocks and channels) compared to the uncorrected data for MSE (top) and SNR (bottom), for the different procedures considered. The kbWF algorithm showed the largest improvements, with an average decrease in MSE of 24% and an average SNR increase of 55%. Separate paired t-tests were used to compare kbWF with each of the other procedures: in all cases, the difference was significant (p < .01). In agreement with previous work, WF performed best when the probability level for zeroing the wavelet coefficients was set to α = 0.1 (MSE decrease = 7%, SNR increased = 42%), but even in this case its performance was significantly worse than that of kbWF. SI and tPCA performed, on average, similarly to each other and not very differently from WF when α was set to .05 or .01. Interestingly, both PCA90 and PCA97 appeared, on average, detrimental, increasing the MSE and decreasing the SNR.
Figure 5.
Example of the composite waveform obtained by adding the synthesized HRF to the actual resting state fNIRS data, before (top, a) and after (bottom, b) application of the kurtosis-based Wavelet Filtering (kbWF) algorithm.
Figure 7.
(a) Average MSE changes (%) and related standard errors for the different algorithms considered. (b) Average SNR changes (%) and related standard errors for the different algorithms considered.
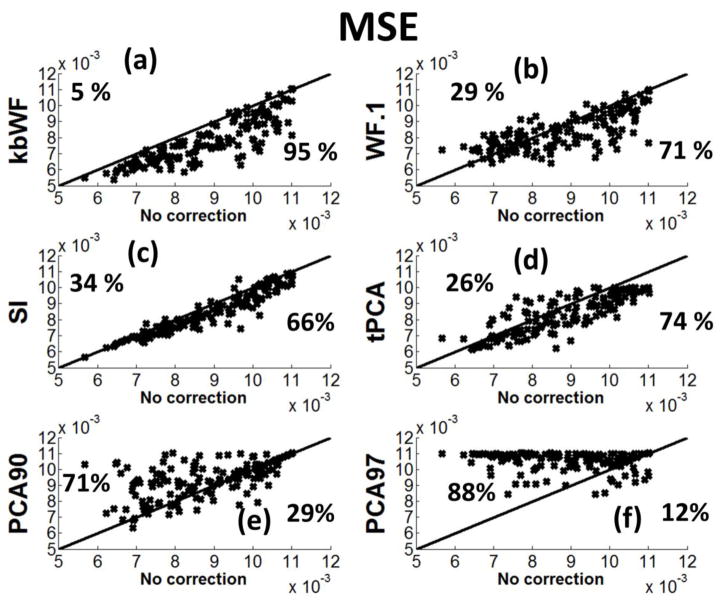
The MSEs for kbWF are reported in Figure 8a, in the form of a scatter plot in which, for each waveform, the MSE before correction is reported along the abscissa and that after correction along the ordinate. Note that points under the main diagonal indicate improvement in MSE after correction, whereas points above the main diagonal indicate worsening in MSE after correction. Note also that in this plot data with high SNR are plotted to the left (low MSE), and data with low SNR are plotted to the right (MSE ≫ 0). In this same figure, we also report similar scatter plots for other motion correction algorithms (Figure 8b–f). These data indicate that application of the kbWF algorithm results in a reduction of MSE in 95% of the cases, and in an increase of MSE in only 5% of the cases (and even in these cases the increase is very small). Importantly, improvements are seen at all levels of uncorrected MSE considered. This indicates that the algorithm performs consistently well, decreasing the MSE for almost all data considered.
Figure 8.
Scatter plots showing the MSE for each subject and data-set recovered via kurtosis-based Wavelet Filtering (kbWF), Wavelet Filtering α=0.1(WF.1), Spline Interpolation (SI), targeted Principal Component Analysis (tPCA), Principal Component Analysis v=90% (PCA90), Principal Component Analysis v=97% (PCA97).
All others motion correction algorithms performed at a lower level, showing improvements in a number of cases varying between 12% (for PCA with a threshold of 97%, PCA97) and 71% (for WF with α=0.1; we also tried others α values with worse results). For most of the other algorithms (with the exception of SI), performance appeared to greatly depend on the MSE of the original waveforms.. In contrast, SI operated similarly at all levels of MSE, but was still less effective than kbWF.
The SNRs for kbWF are reported in Figure 9a. In this figure points above the main diagonal indicate improvement in SNR after correction, whereas points below the main diagonal indicate worsening in SNR after correction. The SNRs reported show results similar to those obtained with the MSE metric, but are of course in the opposite direction, as SNR increases represent improvements in data quality.
Figure 9.
Scatter plots showing the SNR for each subject and data-set recovered via kurtosis-based Wavelet Filtering (kbWF), Wavelet Filtering α=0.1(WF.1), Spline Interpolation (SI), targeted Principal Component Analysis (tPCA), Principal Component Analysis v=90% (PCA90), Principal Component Analysis v=97% (PCA97).
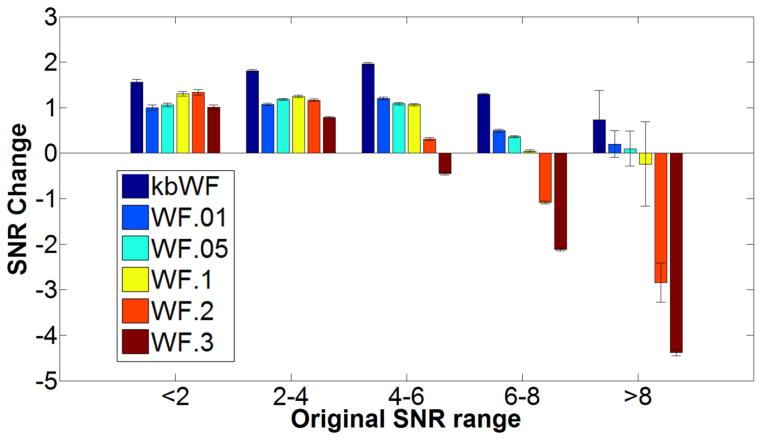
To further examine the performance of kbWF and WF at different α levels, we sorted the waveforms into 5 groups according to their pre-correction SNR. Figure 10 reports the average SNR changes and related standard errors for these DWT-based methods for each of these waveforms groups. This analysis confirmed that kbWF performed well (and typically better than WF methods) across a wide range of SNR levels. WF with high alpha levels (α > .1) produced detrimental results when applied to waveforms with high SNRs, presumably because they led to discarding wavelet coefficients carrying real signal rather than noise.
Figure 10.
Average SNR changes and related standard errors for different levels of original data SNR for the DWT algorithms (kurtosis-based Wavelet Filtering, kbWF and Wavelet Filterings, WFs).
Discussion
Motion artifact correction is a crucial step in fNIRS data analysis. In fact, the high power, timing and spectral characteristics of these artifacts can distort the results of any functional signal identification and statistical analysis that rely on a Gaussian noise distribution (e.g., averaging procedures, General Linear Model, etc.). Several different procedures for motion artifact correction have been proposed in the last few years, in an attempt to identify reliable and effective procedures for motion artifact removal (Blasi et al., 2010; Izzetoglu et al., 2010; Robertson et al., 2010; Scholkmann et al., 2010; Virtanen et al., 2011; Molavi & Guy, 2012; Gagnon et al., 2014; Yücel et al., 2014). In this study, we introduced a new DWT kurtosis based algorithm, kbWF, for removing motion artifacts from hemodynamic optical signals.
Here and in other previous reports a DWT is used for wavelet decomposition. Another form of wavelet decomposition, continuous wavelet transform (CWT), may in principle provide higher frequency resolution than DWT. However, CWT is not appropriate for movement correction applications because it generates redundancy between the various frequencies. This makes the various wavelet coefficient distributions “not-independent” of each other, and therefore makes it very difficult (if not impossible) to determine which specific wavelet needs to be eliminated.
In previous studies, kurtosis-based algorithms have been successfully used for reducing Gaussian noise contamination from transient signals (Ravier & Amblard, 1998, Achim et al., 2003). For example, in a recent study (Sharma et al, 2010), higher order statistics were used to remove spike-like noise from EKG signals. However, due to the spike-like behavior of the EKG signal itself in some sub-bands, threshold parameters had to be adjusted depending on the decomposition level considered. This paper reports the first application of this approach to movement correction in fNIRS data.
For the fNIRS applications presented in this paper, we found that the kbWF algorithm requires setting only one parameter (the kurtosis threshold used for zeroing the artifactual wavelet coefficients). It is important to note that a fixed value of this kurtosis threshold (k = 3.3) appears to work well in all cases considered here. We compared this new procedure with other state-of-the-art algorithms for motion artifact removal: WF, PCA, tPCA, and SI. We tested the procedures by adding synthetic HRFs to real resting state NIRS recordings containing motion artifacts. The results indicated that the performance of kbWF is significantly higher than that of all the other existing methods, and effectively reduces the MSE and increases the SNR of the data (Cooper et al., 2013, Brigadoi et. al, 2014).
Of the other methods, the standard PCA appeared to be the least effective, tending to be very sensitive to the amount of the original noise that contaminates the data. In fact, PCA correction was detrimental even when the signal level in the uncorrected data was large. It is likely that PCA would perform especially poorly in those cases in which the noise and functional responses are temporally correlated. Such conditions, however, were not explored in the current study.
In our data, SI and tPCA showed reasonably high performance (although inferior to kbWF). Both of these procedures, however, require setting a significant set of parameters. In this study we used parameter values that were employed in previous work (Yücel et al., 2014). However, it is difficult to determine whether their performance could have changed significantly with other parameter settings. In any case, the requirement to set a large number of parameters does add difficulties to the application of these methods. A desirable characteristic of SI and tPCA with the settings used in this study is that, in the presence of low levels of noise, these algorithms tend to leave the signal intact. This reflects the fact these algorithms first identify periods were artifacts are present, and then only try to correct these periods and not the rest of the waveform. This is particularly true for SI, probably because SI is based on a channel-by-channel artifact identification.
WF is similar to kbWF, but uses different criteria to determine that a particular wavelet coefficient is artifactual. WF uses a variance-based (second moment) criterion, whereas kbWF uses a kurtosis-based (fourth moment) criterion. Our data indicate that kbWF performs better than WF. WF requires setting a criterion (α) used to decide that a particular wavelet coefficient is artifactual (in z scores). Our analysis show that values between α = .01 and α = .1 work generally well across a wide range of SNR values. Higher values of α do not work well when the SNR in the original data is high, presumably because they lead to discarding some signal together with the noise. However, even using optimal levels of α, WF does not perform as well as kbWF. A possible interpretation of this finding is that a large standardized score is not a sufficient criterion for deeming a particular coefficient as artifactual. This may be particularly true when multiple epochs contain artifacts but the artifact varies in size from epoch to epoch. In this case, the presence of a large artifact may mask the presence of other smaller artifacts (as their standardized scores would be relatively small). To detect these artifacts it would be necessary to use an iterative approach, which would allow for unmasking the smaller artifacts. Unfortunately, variance alone could not be used to effectively terminate the cycles of iterations, with the end result of eliminating the signal together with the noise. With kbWF, however, this problem is circumvented by using a separate criterion (the kurtosis value) rather than variance, to establish that all the important artifacts have been identified and discarded. This criterion works because the hemodynamic signal (as well as random noise) tends to generate wavelet coefficient distributions that have sub-Gaussian or Gaussian behavior. Our kurtosis criterion was selected to correspond to a significant departure from normality of the wavelet distribution. A kurtosis value of 3 indicates that an observed distribution is relatively close to a Gaussian distribution (at least in term of kurtosis). Thus the distribution generated by our simulated HRF is quite close to being Gaussian. Other HRFs may generate slightly different kurtosis values, but values clearly departing from the Gaussian distribution (such as kurtosis>3.3) require extreme conditions, such as situations in which the HRF only occupies a tiny fraction of the recording epoch (e.g., less than 10%). Under these conditions the kurtosis criterion should be adjusted appropriately.
An additional advantage of using the kurtosis (rather than the variance) criterion is that it is fundamentally independent of the SNR of the data, so that the same criterion can be applied to the entire dataset. That said, it is important to consider that there may be conditions under which kbWF could decrease its performance or fail. As for all digital analyses, DWT algorithms are affected by the original sampling frequency. Due to the very slow time course of the hemodynamic signals (< 0.5 Hz), we empirically found that using a sampling frequency between 5 and 50 Hz does not lead to statistically significant changes in the performance of the kbWF algorithm. However we suggest sampling frequencies of at least 10 Hz or higher in order to better describe and identify movement-related components. This range of sampling frequencies can be easily implemented with most modern fNIRS recording systems.
The major limitation of kbWF is in the inability to correct for lasting shifts in light intensity (of durations equal to at least ¼ of the recording period). These shifts would not be detected by kbWF because they would affect the first or second level of DWT, for which kurtosis cannot be computed (because the distribution has an insufficient N; note that a similar problem would also occur for the WF method). This problem can be overcome by applying a high-pass filter to the data (as we did for our dataset). In general, we suggest applying a high-pass filter with a cutoff period a few times (at least 4) shorter than the overall duration of the recording epoch. In other words, longer recording epochs and higher high-pass frequencies are indicated when kbWF or WF are applied. If the recording period is short, or a high-pass filter is not desirable, a method to overcome this problem could be to apply both SI and kbWF to the data. In fact, as reported in our results, the SI method improves the data’s SNR (although not as much as DTW-based methods) in a relative safe fashion. Moreover, SI is known to be an effective procedure for correcting lasting shifts in fiber coupling (Cooper et al., 2012).
Conclusions
Here we introduced a new algorithm for motion artifact removal from fNIRS data, kbWF. The kbWF algorithm is based on calculating the departure from normality of the distribution of wavelet coefficients obtained with each level of DWT decomposition. When this distribution is found to have super-Gaussian properties (identified by a kurtosis > 3.3), the algorithm removes the highest DWT coefficients; the procedure is iterated until a Gaussian-like distribution of the weights is obtained (kurtosis < 3.3) for each decomposition level. We compared kbWF with other existing motion correction methods using simulated data, based on combining synthesized HRFs with actual resting-state fNIRS data containing motion artifacts. These simulations showed that kbWF leads to greater reductions in MSE and increases in SNR than all other procedures we tested, over a wide range of signal and noise levels.
Acknowledgments
This work was supported by grants 5R56MH097973 (Drs. Gratton and Fabiani, PIs). We wish to thank Kathy Low, Courtney Burton, Antoine DeJong, Mark Fletcher, Tania Kong, Chin-Hong Tan and Ben Zimmerman for help with data collection and pre-processing of the fNIRS resting-state data.
Footnotes
Publisher's Disclaimer: This is a PDF file of an unedited manuscript that has been accepted for publication. As a service to our customers we are providing this early version of the manuscript. The manuscript will undergo copyediting, typesetting, and review of the resulting proof before it is published in its final citable form. Please note that during the production process errors may be discovered which could affect the content, and all legal disclaimers that apply to the journal pertain.
References
- Akansu AN, Haddad PR. Multiresolution signal decomposition: transforms, subbands, and wavelets. Academic Press; 2000. [Google Scholar]
- Achim A, Tsakalides P, Bezerianos A. SAR image denoising via Bayesian wavelet shrinkage based on heavy-tailed modeling. Geoscience and Remote Sensing, IEEE Transactions. 2003;41:1773–1784. [Google Scholar]
- Blasi A, Phillips D, Lloyd-Fox S, Koh PH, Elwell CE. Automatic detection of motion artifacts in infant functional optical topography studies. Oxygen Transport to Tissue. 2010;31:279–284. doi: 10.1007/978-1-4419-1241-1_40. [DOI] [PubMed] [Google Scholar]
- Boas DA, Elwell CE, Ferrari M, Taga G. Twenty years of functional near-infrared spectroscopy: introduction for the special issue. NeuroImage. 2014;85:1–5. doi: 10.1016/j.neuroimage.2013.11.033. [DOI] [PubMed] [Google Scholar]
- Brigadoi S, Ceccherini L, Cutini S, Scarpa F, Scatturin P, Selb J, Gagnon L, Boas DA, Cooper RJ. Motion artifacts in functional near-infrared spectroscopy: a comparison of motion correction techniques applied to real cognitive data. Neuroimage. 2014;85:181–191. doi: 10.1016/j.neuroimage.2013.04.082. [DOI] [PMC free article] [PubMed] [Google Scholar]
- Chance B. Time resolved spectroscopic (TRS) and continuous wave spectroscopic (CWS) studies of photon migration in human arms and limbs. Oxygen Transport to Tissue. 1989;11:21–33. doi: 10.1007/978-1-4684-5643-1_3. [DOI] [PubMed] [Google Scholar]
- Cooper RJ, Selb J, Gagnon L, Phillip D, Schytz HW, Iversen HK, Ashina M, Boas DA. A systematic comparison of motion artifact correction techniques for functional near-infrared spectroscopy. Frontiers in neuroscience. 2012;6:147. doi: 10.3389/fnins.2012.00147. [DOI] [PMC free article] [PubMed] [Google Scholar]
- Eggebrecht AT, Silvina LF, Robichaux-Viehoever A, Hassanpou MS, Dehghani H, Snyder AZ, Hershey T, Culver JP. Mapping distributed brain function and networks with diffuse optical tomography. Nature Photonics. 2014;8(6):448–454. doi: 10.1038/nphoton.2014.107. [DOI] [PMC free article] [PubMed] [Google Scholar]
- Fabiani M, Gordon BA, Maclin EL, Pearson M, Brumback CR, Low KA, McAuley E, Sutton BP, Kramer AF, Gratton G. Neurovascular coupling in normal aging: A combined optical, ERP and fMRI study. NeuroImage. 2014;1:592–607. doi: 10.1016/j.neuroimage.2013.04.113. [DOI] [PMC free article] [PubMed] [Google Scholar]
- Fallgatter AJ, Roesler M, Sitzmann A, Heidrich A, Mueller TJ, Strik WK. Loss of functional hemispheric asymmetry in Alzheimer’s dementia assessed with near-infrared spectroscopy. Cognitive Brain Research. 1997;6:67–72. doi: 10.1016/s0926-6410(97)00016-5. [DOI] [PubMed] [Google Scholar]
- Fantini S, Barbieri BB, Gratton E, Franceschini MA, Maier JS, Walker SA. Frequency-domain multichannel optical detector for noninvasive tissue spectroscopy and oximetry. Optical Engineering. 1995;34:32–42. [Google Scholar]
- Farroni T, Chiarelli AM, Lloyd-Fox S, Massaccesi S, Merla A, Di Gangi V, Mattarello T, Faraguna D, Johnson MH. Infant cortex responds to other humans from shortly after birth. Scientific reports. 2013;3:2851. doi: 10.1038/srep02851. [DOI] [PMC free article] [PubMed] [Google Scholar]
- Friston KJ. Neuroscience Databases. Springer; US: 2003. Statistical parametric mapping; pp. 237–250. [Google Scholar]
- Gagnon L, Yücel MA, Boas DA, Cooper RJ. Further improvement in reducing superficial contamination in NIRS using double short separation measurements. Neuroimage. 2014;85:127–135. doi: 10.1016/j.neuroimage.2013.01.073. [DOI] [PMC free article] [PubMed] [Google Scholar]
- Gallagher A, Thériault M, Maclin E, Low K, Gratton G, Fabiani M, Lassonde M. Near-infrared spectroscopy as an alternative to the Wada test for language mapping in children, adults and special populations. Epileptic Disord. 2007;9:241–55. doi: 10.1684/epd.2007.0118. [DOI] [PubMed] [Google Scholar]
- Gratton E, Fantini S, Franceschini MA, Gratton G, Fabiani M. Measurements of scattering and absorption changes in muscle and brain. Philosophical Transactions of the Royal Society of London Series B: Biological Sciences. 1997;352:727–735. doi: 10.1098/rstb.1997.0055. [DOI] [PMC free article] [PubMed] [Google Scholar]
- Grossmann T, Johnson MH, Lloyd-Fox S, Blasi A, Deligianni F, Elwell C, Csibra G. Early cortical specialization for face-to-face communication in human infants. Proceedings of the Royal Society B: Biological Sciences. 2008;275:2803–2811. doi: 10.1098/rspb.2008.0986. [DOI] [PMC free article] [PubMed] [Google Scholar]
- Hoaglin DC, Mosteller F, Tukey JW, editors. Understanding robust and exploratory data analysis. Vol. 3. New York: Wiley; 1983. [Google Scholar]
- Huppert TJ, Diamond SG, Franceschini MA, Boas DA. HomER: a review of time-series analysis methods for near-infrared spectroscopy of the brain. Applied optics. 2009;48:D280–D298. doi: 10.1364/ao.48.00d280. [DOI] [PMC free article] [PubMed] [Google Scholar]
- Joanes DN, Gill CA. Comparing measures of sample skewness and kurtosis. Journal of the Royal Statistical Society: Series D (The Statistician) 1998;47:183–189. [Google Scholar]
- Jolliffe I. Principal component analysis. John Wiley & Sons, Ltd; 2005. [Google Scholar]
- Izzetoglu M, Chitrapu P, Bunce S, Onaral B. Motion artifact cancellation in NIR spectroscopy using discrete Kalman filtering. Biomed Eng Online. 2010;9:16. doi: 10.1186/1475-925X-9-16. [DOI] [PMC free article] [PubMed] [Google Scholar]
- Lloyd-Fox S, Blasi A, Elwell CE. Illuminating the developing brain: the past, present and future of functional near infrared spectroscopy. Neuroscience and Biobehavioral Reviews. 2010;34:269–284. doi: 10.1016/j.neubiorev.2009.07.008. [DOI] [PubMed] [Google Scholar]
- Mahmoudzadeh M, Dehaene-Lambertz G, Fournier M, Kongolo G, Goudjil S, Dubois J, Grebe R, Wallois F. Syllabic discrimination in premature human infants prior to complete formation of cortical layers. Proceedings of the National Academy of Sciences. 2013;110:4846–4851. doi: 10.1073/pnas.1212220110. [DOI] [PMC free article] [PubMed] [Google Scholar]
- Molavi B, Dumont GA. Wavelet-based motion artifact removal for functional near-infrared spectroscopy. Physiological measurement. 2012;33(2):259. doi: 10.1088/0967-3334/33/2/259. [DOI] [PubMed] [Google Scholar]
- Obrig H, Wenzel R, Kohl M, Horst S, Wobst P, Steinbrink J, Thomas F, Villringer A. Near-infrared spectroscopy: does it function in functional activation studies of the adult brain? International Journal of Psychophysiology. 2000;35:125–142. doi: 10.1016/s0167-8760(99)00048-3. [DOI] [PubMed] [Google Scholar]
- Ravier P, Amblard PO. Combining an adapted wavelet transform with 4th order statistics for transient detection. Signal Processing. 1998;70:115–128. [Google Scholar]
- Robertson FC, Douglas TS, Meintjes EM. Motion artifact removal for functional near infrared spectroscopy: a comparison of methods. Biomedical Engineering, IEEE Transactions on. 2010;57:1377–1387. doi: 10.1109/TBME.2009.2038667. [DOI] [PubMed] [Google Scholar]
- Roche-Labarbe N, Zaaimi B, Berquin P, Nehlig A, Grebe R, Wallois F. NIRS-measured oxy-and deoxyhemoglobin changes associated with EEG spike-and-wave discharges in children. Epilepsia. 2008;49:1871–1880. doi: 10.1111/j.1528-1167.2008.01711.x. [DOI] [PubMed] [Google Scholar]
- Sharma LN, Dandapat S, Mahanta A. ECG signal denoising using higher order statistics in Wavelet subbands. Biomedical Signal Processing and Control. 2010;5:214–222. [Google Scholar]
- Scholkmann F, Spichtig S, Muehlemann T, Wolf M. How to detect and reduce movement artifacts in near-infrared imaging using moving standard deviation and spline interpolation. Physiological measurement. 2010;31:649. doi: 10.1088/0967-3334/31/5/004. [DOI] [PubMed] [Google Scholar]
- Villringer A, Chance B. Non-invasive optical spectroscopy and imaging of human brain function. Trends in Neurosciences. 1997;20:435–442. doi: 10.1016/s0166-2236(97)01132-6. [DOI] [PubMed] [Google Scholar]
- Virtanen J, Noponen T, Kotilahti K, Virtanen J, Ilmoniemi RJ. Accelerometer-based method for correcting signal baseline changes caused by motion artifacts in medical near-infrared spectroscopy. Journal of Biomedical Optics. 2011;16:087005–087005. doi: 10.1117/1.3606576. [DOI] [PubMed] [Google Scholar]
- Watanabe E, Maki A, Kawaguchi F, Yamashita Y, Mayanagi Y, Koizumi H. Noninvasive cerebral blood volume measurement during seizures using multichannel near infrared spectroscopic topography. Journal of Biomedical Optics. 2000;5:287–290. doi: 10.1117/1.429998. [DOI] [PubMed] [Google Scholar]
- Ye JC, Tak S, Jang KE, Jung J, Jang J. NIRS-SPM: statistical parametric mapping for near-infrared spectroscopy. Neuroimage. 2009;44:428–447. doi: 10.1016/j.neuroimage.2008.08.036. [DOI] [PubMed] [Google Scholar]
- Yücel MA, Selb J, Cooper RJ, Boas DA. Targeted principle component analysis: A new motion artifact correction approach for near-infrared spectroscopy. Journal of Innovative Optical Health Sciences. 2014;7:1350066. doi: 10.1142/S1793545813500661. [DOI] [PMC free article] [PubMed] [Google Scholar]
- Zhang Y, Franceschini MA, Boas DA, Brooks DH. Eigenvector-based spatial filtering for reduction of physiological interference in diffuse optical imaging. Journal of biomedical optics. 2005;10:011014. doi: 10.1117/1.1852552. [DOI] [PubMed] [Google Scholar]


