Abstract
The Pretransplant Assessment of Mortality (PAM) score was developed in 2006 to predict risk of mortality after allogeneic hematopoietic cell transplantation (HCT). Transplant practices have evolved during the past decade, suggesting the need to reevaluate the performance of the PAM score. We used statistical modeling to analyze and recalibrate mortality based on overall PAM scores, its components, and conditioning regimen in a retrospective cohort of 1549 patients who had HCT from 2003 through 2009. PAM scores correlated with mortality, but the effect size was smaller in the current study than previously. PAM scores also demonstrated a stronger association with mortality in patients who received myeloablative conditioning than in those who received reduced-intensity conditioning. In contrast to the original study, carbon monoxide diffusing capacity, serum alanine aminotransferase and serum creatinine concentrations were no longer significantly associated with 2-year mortality, while patient and donor CMV serology was associated with mortality in the current cohort. Based on our findings, we developed and tested a revised PAM score for clinicians to estimate survival after allogeneic HCT with myeloablative conditioning regimens for patients with hematologic malignancy. Prognostic models such as the PAM score should be updated and recalibrated periodically to accommodate changes in clinical practice.
Keywords: Allogeneic hematopoietic stem cell transplantation, survival, comorbidity, risk assessment
Introduction
Allogeneic hematopoietic cell transplantation (HCT) continues to be associated with high early mortality compared to other treatments for hematologic malignancies. Clinical tools to estimate this risk include the Pretransplant Assessment for Mortality (PAM) score, which uniquely integrates patient age, disease risk, selected transplant variables and certain measures of comorbidity to predict the risk of all-cause mortality at 2 years. Transplant variables in the PAM score include donor relationship, HLA-matching and type of conditioning regimen, while measures of comorbidity include forced expiratory volume (FEV1), carbon monoxide diffusing capacity (DLCO), serum creatinine concentration, and serum alanine aminotransferase concentration [1]. The 50-point scoring system demonstrated a strong ability to predict 2-year mortality risk (Appendix Table A1). Subsequent attempts to validate the PAM score in other studies have had mixed results [2-6].
Transplant practices have evolved during the past decade, including the increased use of nonmyeloablative or reduced-intensity conditioning (RIC) before transplantation. These changes suggest the need to reevaluate the performance of HCT-related prognostic models such as the PAM score. The goal of the current study, therefore, was to determine the extent to which the PAM score and its components continue to predict mortality after HCT, and to assess the performance of the PAM model based on the type of conditioning regimen, which was not well defined in the original study due to the limited numbers of patients treated with RIC regimens.
Methods
Patient cohorts
The current cohort for this study included first-time allogeneic HCT recipients at the Seattle Cancer Care Alliance (SCCA) / Fred Hutchinson Cancer Research Center (FHCRC) from January 1, 2003 through December 31, 2009. All patients were followed until death or the last day of contact as of December 31, 2011. We used the validation cohort from the previous study [1] (1990-2002) for comparison with the current cohort (Table 1). The Institutional Review Board determined that the use of de-identified patient information was exempt from review. To create an external validation cohort, additional data were obtained from the Dana Farber Cancer Institute (DFCI) and Brigham and Women's Hospital for HCT recipients from January 1, 2005 through June 30, 2009, with approval of the DFCI Institutional Review Board.
Table 1. Baseline clinical characteristics of the previous validation and current PAM cohorts.
| Factor | Previous Cohort† | Current Cohort† |
|---|---|---|
| Patient age, years, median (range) | 41.8 (15.0-72.5) | 50.7 (15.1-78.9) |
|
| ||
| Disease risk,* N (%) | ||
| Low | 382 (29) | 237 (15) |
| Intermediate | 358 (27) | 885 (57) |
| High | 574 (44) | 427 (28) |
|
| ||
| Donor type, N (%) | ||
| Related/Matched | 670 (51) | 584 (38) |
| Related/Mismatched | 125 (10) | 79 (5) |
| Unrelated | 519 (39) | 886 (57) |
|
| ||
| Conditioning, N (%) | ||
| Reduced intensity | 72 (5) | 609 (39) |
| Myeloablative, no TBI | 469 (36) | 547 (35) |
| Myeloablative, TBI ≤ 12 Gy | 326 (25) | 253 (16) |
| Myeloablative, TBI > 12 Gy | 497 (34) | 140 (9) |
|
| ||
| Creatinine, mg/dL, median (range) | 0.8 (0.3-5.7) | 0.9 (0.3-9.7) |
|
| ||
| ALT, U/mL, median (range) | 27 (0-908) | 23 (4-349) |
|
| ||
| FEV1, percent of predicted, median (range) | 93.1 (26.4-100) | 92.2 (32.0-100) |
|
| ||
| DLCO, percent of predicted, median (range) | 99.2 (9.7-100) | 80.0 (31.2-100) |
Abbreviations: TBI, total-body irradiation; HCT, hematopoietic cell transplant; ALT, alanine aminotransferase; DLCO, carbon monoxide diffusing capacity
Categorized according to reference 1.
Date range October 1, 1990 through December 31, 2002 for the previous cohort compared with January 1, 2003 through December 31, 2009 for the current cohort.
Clinical variables
Donor type was determined according to HLA compatibility and patient/donor relation. Conditioning regimens were classified as myeloablative or reduced intensity (non-myeloablative). Myeloablative regimens varied, but typically contained high-dose cyclophosphamide with busulfan or 12.0-13.2 Gy TBI, busulfan or treosulfan with fludarabine, or radiolabeled CD45-specific monoclonal antibody with fludarabine and 2 Gy TBI [7]. Conditioning regimens containing radiolabeled antibody were categorized as equivalent to > 12 Gy TBI. Reduced-intensity regimens included 2-3 Gy TBI with or without fludarabine [8]. Pulmonary function testing was performed according to American Thoracic Society guidelines [9-11]. DLCO was adjusted for hemoglobin concentration according to the Dinakara equation [12]. FEV1 and DLCO were expressed as a percentage of predicted values [13, 14] and were capped at 100%, since higher values are not known to have physiological significance with respect to HCT.
Statistical analysis
Cox regression was used to assess the association of PAM score and individual PAM components with 2-year all-cause mortality, with follow-up censored at 2 years. PAM score and its continuous individual components were modeled as continuous variables, both linear and non-linear, where the non-linear modeling was done using a cubic spline with knots at the 5th, 25th, 50th, 75th, and 95th percentiles [15]. A cubic spline provides a flexible way to model continuous associations with outcome and requires minimal assumptions regarding a particular functional form. PAM components were also modeled categorically with the same cut-points used in the original report. PAM scores were categorized into various groups, and survival curves for patients in each group were plotted as Kaplan-Meier estimates.
The associations of PAM and its components with mortality in the current cohort were compared to the associations in the validation cohort from the original PAM study. We used the validation cohort since inclusion of patients from the original development cohort would overestimate the performance of PAM and the association of PAM and its components with outcome. The performance of PAM was re-assessed using a c-statistic (see data supplement). The Akaike information criteria (AIC) were also calculated to assess model fit, where smaller values indicate a better fit.
The interactions of PAM score with conditioning intensity and cohort were assessed by fitting the appropriate term in a Cox regression model, with PAM modeled as a continuous linear variable. A revised PAM score was developed from patients in the current cohort who received myeloablative conditioning for hematologic malignancy. The performance and fit of the revised PAM score was assessed through bootstrapping (see data supplement). The external validation cohort was also used to assess the performance of the revised PAM score. All statistical analyses were performed using SAS.
Results
Cohort characteristics
We identified 1665 patients who received a first allogeneic HCT between January 1, 2003 and December 31, 2009. Data for all 8 PAM components were available for 1549 patients, 940 treated with myeloablative conditioning, and 609 treated with RIC. Table 1 summarizes baseline clinical characteristics of the current cohort and the previous validation cohort. The overall mean PAM score was 23.1 (median 23, range 8-43) in the current cohort, and the distributions of PAM scores were similar for patients who received myeloablative conditioning (mean 23.3, median 24, range 11-43) or RIC (mean 22.9, median 22, range 8-41).
Association of PAM with outcome and performance of PAM in the current cohort vs. previous validation cohort
In the current cohort, increasing PAM score was associated with a higher risk of death. With PAM score modeled as a continuous linear variable, the risk of death from any cause increased by 8% with each one-point increase in PAM score (HR 1.08, 95% CI 1.07-1.10, P<.0001). This result compares to a relative increase of 12% in the previous PAM validation cohort (HR 1.12. 95% CI 1.11-11.14, P<.0001). A statistically significant interaction between score and cohort was observed (P<.0001), indicating that the magnitude of the association of score with outcome differed between the two cohorts. Modeling the PAM score as a cubic spline visually showed that the strength of the association was weaker in the current cohort than in the previous cohort (Figure 1). The c-statistic for PAM was 0.62 (95% CI, 0.60-0.64) for the current cohort, compared with 0.68 (95% CI, 0.67-0.70) in the previous validation cohort.
Figure 1.
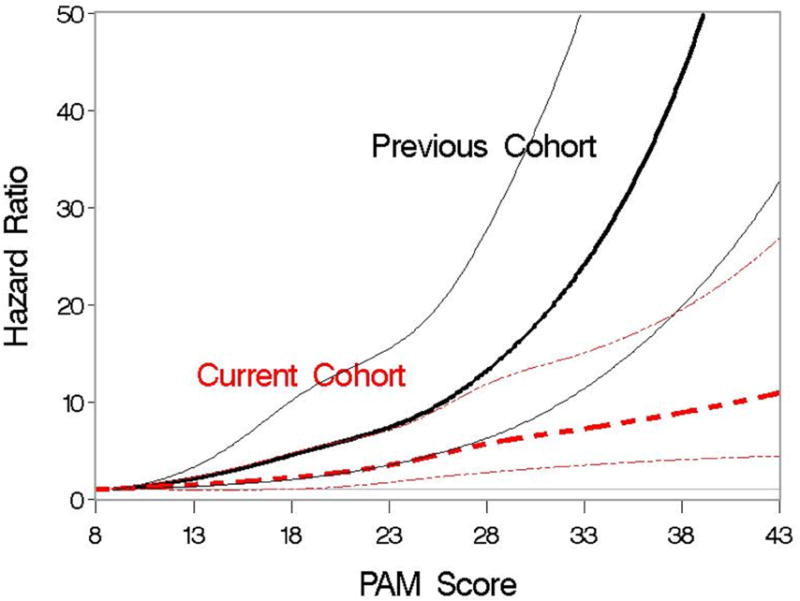
Association of PAM score and the hazard of 2-year mortality when PAM is modeled as a cubic spline. Association is examined separately for patients in the previous validation cohort and for patients in the current cohort. Hazard ratios are indicated by thicker lines; pointwise 95% CI are indicated by thinner lines.
Figure 2 shows the association of PAM with survival to 2 years for the current cohort and the previous validation cohort. Patients with the highest PAM scores in the current cohort demonstrated improved survival compared to those in the previous validation cohort. While increasing PAM score is still clearly associated with decreased survival, the strength of the association in the current cohort is weaker than in the previous validation cohort, and the performance of PAM has diminished.
Figure 2.
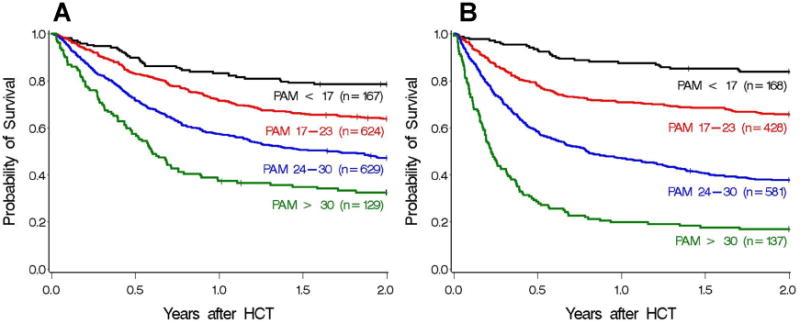
Two-year survival for the current (A) and previous validation (B) cohorts, grouped into 4 separate PAM categorizations based on the original study, where scores were grouped as < 17, 17-23, 24-30, and > 30, with the upper interval of the first 3 windows chosen so that the predicted probabilities of death by 2 years were 25%, 50%, and 75%, respectively, based on data from the original PAM development cohort. Category 1 (black): PAM < 17, category 2 (red): PAM 17-23, category 3 (blue): PAM 24-30, category 4 (green): PAM > 30. Absolute probabilities of survival are 79%, 63%, 47%, and 33% in the current cohort, and 84%, 66%, 38%, and 17% in the previous validation cohort.
Association of PAM with outcome and performance of PAM in the current cohort, myeloablative vs. reduced-intensity conditioning
The proportion of patients who received RIC was higher in the current cohort (39%) than in the original PAM validation cohort (5%). We hypothesized that the strength of association between PAM and risk of mortality would be greater among patients who received myeloablative conditioning as compared to RIC, thereby partially explaining the weaker association between PAM score and outcome in the current study as compared to the original report. For patients who received myeloablative conditioning in the current cohort, the risk of death by 2 years post-transplant increased by 10% for each one-point increase in PAM score (HR 1.10, 95% CI 1.08-1.12, P<.0001). For patients who received RIC, the risk of death by 2 years increased by 5% for each one-point increase in PAM score (HR 1.06, 95% CI 1.03-1.08, P<.0001). These data suggest that the magnitude of association of the PAM score with mortality is larger in the myeloablative group than in the RIC group, with a test of statistical interaction yielding P=.002. Kaplan-Meier survival curves by conditioning regimen for specified PAM groupings are available in Appendix Figure A1. The concordance of PAM with mortality was higher in the myeloablative group than in the RIC group [c=0.64 (95% CI, 0.62-0.67) and c=0.57 (95% CI, 0.54-0.60), respectively].
Association of PAM with outcome and performance of PAM with myeloablative conditioning, current cohort vs. previous validation cohort
Differences in performance of the PAM score and reduction in the magnitude of association with outcome were also seen when the comparison of the current cohort to the previous validation cohort was restricted to patients who received myeloablative conditioning. We observed a 13% increase in 2-year mortality for each one-point increase in PAM score (HR 1.13, 95% CI 1.11-1.14, P<.0001) in the previous validation cohort and 10% (HR 1.10, 95% CI 1.08-1.12, P<.0001) in the current cohort. A test of interaction between the PAM score and cohort yields P=.02, and Appendix Figure A2 shows the association when the PAM score was modeled as a cubic spline. These results indicate that the magnitude of the association of PAM with mortality differed in the two cohorts. Among patients who received myeloablative conditioning, the c-statistic was 0.69 (95% CI, 0.67-0.71) for the previous validation cohort and 0.64 (95% CI, 0.62-0.67) for the current cohort.
Individual PAM variables compared between the previous validation and current cohorts among patients who received myeloablative conditioning
Given the decrease in magnitude of the association of PAM with outcome, we examined the association of each PAM component with outcome after HCT with myeloablative conditioning in both the current cohort and previous validation cohort. The adjusted association of each of the continuous factors with the risk of 2-year mortality is summarized in Figure 3, where the continuous factors not in question were modeled as linear functions for adjustment purposes. In the previous validation cohort, the associations between mortality and all continuous variables were statistically significant. In the current cohort, the associations between 2-year mortality and creatinine (linear P=.76, non-linear vs. linear P=.38, cubic spline P=.40), ALT (linear P=.78, non-linear vs. linear P=.32, cubic spline P=.47), and DLCO (linear P=.20, non-linear vs. linear P=.51, cubic spline P=.42) were not statistically significant. The increased mortality risk associated with age appears to occur later in the current cohort than in the previous cohort. Results in the current cohort show a statistically significant positive association (linear P=.02, non-linear vs. linear P=.03, cubic spline P=.007), but the data suggest that the association is non-linear. The association between FEV1 and outcome was statistically significant in the current cohort (linear P=.006, non-linear vs. linear P=.77, cubic spline P=.009), similar to results in the previous validation cohort. Appendix Table A2 shows the association of the PAM components as originally categorized for both the current cohort and previous validation cohort, where notably both disease risk and type of donor were associated with outcome in the current cohort.
Figure 3.
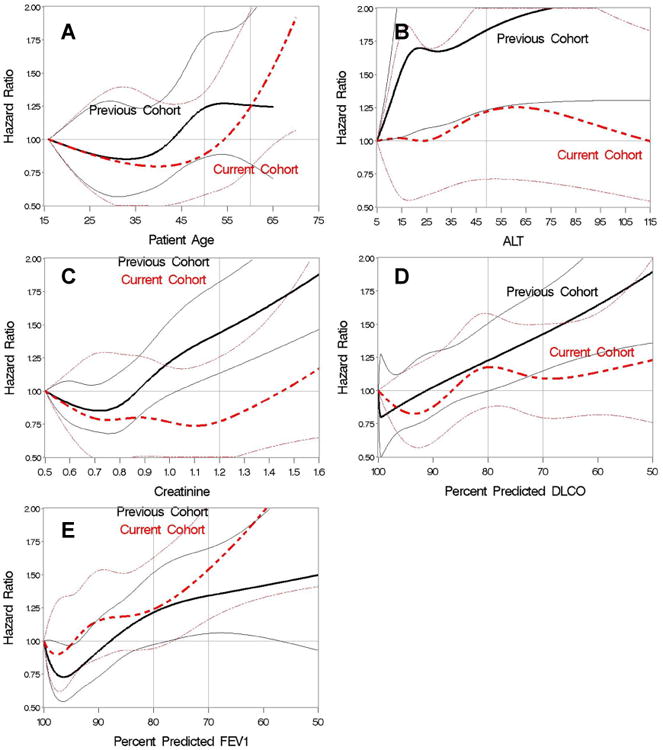
Hazard ratios for 2-year mortality with individual PAM variables modeled as cubic splines in the previous validation (black) and current (red) cohorts for patients who received myeloablative conditioning. (A) patient age; (B) ALT; (C) creatinine; (D) DLCO; (E) FEV1. Hazard ratios are indicated by thicker lines; pointwise 95% CI are indicated by thinner lines.
Development and testing of a revised PAM model
Data from 914 patients in the current cohort who were diagnosed with a hematologic malignancy, received myeloablative conditioning, and had cytogenetic data available were used to develop a revised PAM model, where all factors considered for the original PAM score were re-examined [1]. Whereas the previous PAM model used an older disease risk classification, we reorganized overall risk groups according to a more updated risk index developed by Armand et al. [16] In the original PAM model, unrelated donors were considered as a single group regardless of HLA-matching or stem cell source. In the new model, we stratified unrelated donors using HLA-matching (HR 1.40, P=.007 for 10/10 HLA-matched unrelated donors and HR 2.07, P<.0001 for 9/10 HLA-matched unrelated donors compared to HLA-matched related donors) and separated unrelated cord blood donors as a distinct group (HR 2.19, P=.002). Patient age, donor type, disease risk, FEV1, and patient and donor CMV serology (P=.0005) were included in the revised PAM, with FEV1 modeled as a continuous linear variable. Even though the association with age appeared to be non-linear, a model with age dichotomized provided a better fit to the data as compared to the more complex model with a non-linear function of age. Table 2 summarizes the scores and associations for the categorical and continuous factors for the revised PAM.
Table 2. Factors included in revised PAM model and their association with 2-year mortality.
| Variable | Hazard ratio (95% CI) | P | Score* |
|---|---|---|---|
| Patient age, years | |||
| < 65 | Reference | - | 0 |
| ≥ 65 | 2.13 | .0004 | 7.6 |
|
| |||
| Donor type | Global p<0.0001 | ||
| HLA-matched, related | Reference | - | 0 |
| Unrelated, 10/10§ | 1.40 (1.10-1.79) | .007 | 3.4 |
| Unrelated, ≤9/10§ | 2.07 (1.57-2.47) | <.0001 | 7.3 |
| Unrelated, cord blood | 2.19 (1.35-3.57) | .002 | 7.9 |
| HLA-mismatched, related | 2.00 (1.10-3.64) | .02 | 6.9 |
|
| |||
| Disease risk† | Global p<.0001 | ||
| Low | Reference | - | 0 |
| Intermediate | 1.71 (1.07-2.75) | .03 | 5.4 |
| High | 3.75 (2.30 -6.12) | <.0001 | 13.2 |
| Very High | 5.49 (3.19-9.44) | <.0001 | 17.0 |
|
| |||
| FEV1 | 1.20‡ (1.09-1.28) | <.0001 | 0.181*(100-%FEV1) |
|
| |||
| Patient/Donor CMV | Global p=.0003 | ||
| -/- | Reference | 0 | |
| -/+ | 1.71 (1.20-2.44) | .003 | 5.4 |
| +/- | 1.70 (1.31-2.21) | <.0001 | 5.3 |
| +/+ | 1.41 (1.07-1.86) | .01 | 3.5 |
Abbreviation: CMV, cytomegalovirus
The score for each group of the categorical components was obtained by multiplying the appropriate regression coefficient by 10. For the continuous variable FEV1, the regression coefficient was multiplied by 10 to yield 0.168. Moreover, to ensure that all PAM scores generated were greater than zero, FEV1 was transformed to 100-%FEV1 so that the score for this component is zero when FEV1=100% and positive when FEV1 is less than 100%.
Overall risk groups were determined according to the risk index developed by Armand et al.,[16] which includes disease risk, stage risk, and cytogenetic data for acute myeloid leukemia and myelodysplastic syndromes (MDS). The poor and very poor MDS cytogenetic risk categories defined by Deeg et al. [27] were grouped as high-risk disease, and all other categories were grouped as intermediate risk disease.
Represents the relative change in hazard ratio for each decrease in FEV1 by 10%
HLA-matching includes HLA-A, B, C, DR, and DQ alleles.
A separate cohort of 401 patients from DFCI was used to validate the revised PAM score, using the same selection criteria that were applied in the model-building cohort. Except for CMV (and age, where there were no patients older than 65), each of the revised PAM components was associated with 2-year mortality in the DFCI cohort (Appendix Table A3). Modeling PAM as a continuous linear variable, each increase in PAM by 1 point was associated with an 8% increase in 2-year mortality (HR 1.08; 95% CI, 1.06-1.10, P<.0001). The assumption of linearity was consistent with the data when modeling PAM as a cubic spline (Appendix Figure A3). Figure 4 displays Kaplan-Meier survival curves for the external validation cohort with PAM scores divided into 5 groupings of roughly equal interval lengths.
Figure 4.
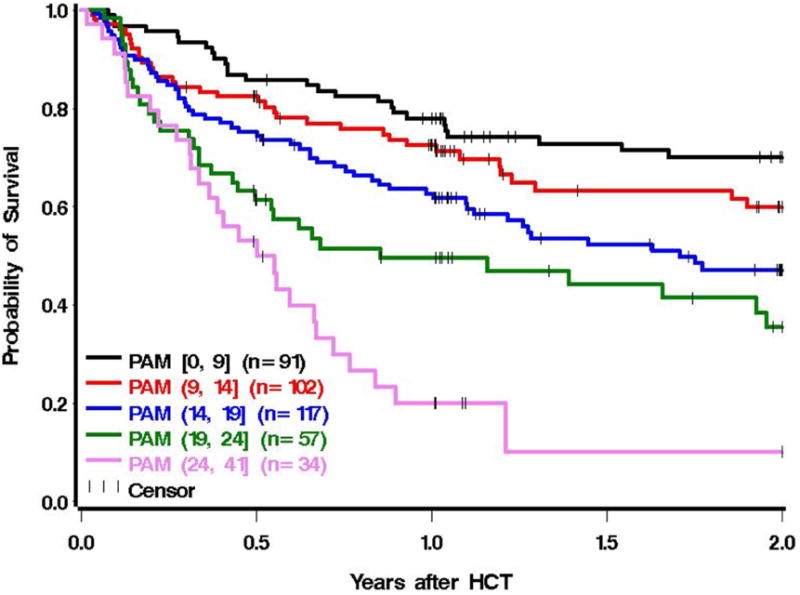
Two-year survival for the external validation cohort (n=401) from the Dana Farber Cancer Institute, grouped into 5 separate PAM categorizations that were divided into intervals of similar length. The stratification of groupings by equal interval lengths is supported by Figure A3, since the association appears relatively linear. Category 1 (black): [PAM 0-9], category 2 (red): PAM (9-14], category 3 (blue): PAM (14-19], category 4 (green): PAM (19-24], category 5 (pink): PAM (24-41].
The bias-corrected AIC for the revised PAM model was smaller compared to the original PAM when applied to the current cohort (5011.5 vs. 5042.3), and the bias-corrected c-statistic using the revised PAM score was 0.65, which is comparable to the value of 0.64 for the previous PAM when applied to the current cohort. The c-statistic for the revised PAM in the external validation cohort was 0.63 (95% CI, 0.60-0.66). These data suggest that the performance of the revised PAM score is similar to the previous PAM score in fitting the data and in predicting 2-year mortality.
Discussion
The PAM score was originally published in 2006 as a simple and effective clinical scoring system and predictor of mortality [1]. Our follow-up analysis of the PAM score shows that the performance of the original PAM score has diminished over time, as has the strength of the association with 2-year mortality. Similar changes are likely to occur with other predictive models [17-20].
Several factors likely contributed to the decreased discriminatory capacity of the PAM score and the loss of associations of ALT, creatinine, and DLCO with mortality. Recent data have demonstrated improved outcomes after HCT over time [21]. In comparing patients who had HCT from 1993-1997 and from 2003-2007, Gooley et al. [21] showed significant reductions in non-relapse mortality, all-cause mortality, liver dysfunction, acute kidney injury, and pulmonary complications through day 100. It is likely that changes in transplant practice, supportive care, and the ability to manage comorbidities have all contributed to improved outcomes after HCT. Abnormalities in ALT, creatinine, and DLCO in the current study cohort of patients who received myeloablative conditioning regimens were relatively mild and do not extend to the range that can be allowed with RIC regimens. Patients with ALT, creatinine, or DLCO abnormalities more severe than observed in this study are very likely to experience higher risks of mortality after HCT with myeloablative conditioning regimens.
In updating the PAM model, we used a recently refined disease risk classification, stratified unrelated donors according to HLA-matching, and analyzed cord blood recipients as a separate group. The differences in hazard ratios assigned to each unrelated donor group now reflect a more accurately weighted contribution to the revised PAM model. The association between CMV status and mortality in the current cohort is consistent with a recently published large multicenter European analysis [22]. The sample size of the validation cohort may have been too small to detect this association, especially since the CMV effect is relatively small. Of note, the hazard ratios for the CMV effect in both the current PAM study and the European study were within the 95% confidence interval around the hazard ratio in the validation cohort.
The PAM score performs less well in patients treated with RIC regimens than in those treated with myeloablative regimens, as indicated by the c-statistic estimates and the statistical models (both cubic spline modeling and categorization of PAM score). Comorbidities that are not included in the PAM score are more likely to occur in patients treated with RIC regimens than in those treated with myeloablative regimens, and the omission of these comorbidities contributes to the relatively poor performance of the PAM score in predicting outcomes after RIC HCT. As expected, older age and comorbidities have lesser effects after RIC HCT as compared to myeloablative regimens. Additionally, differences in outcome according to disease risk groups used in the original PAM report (and duplicated here) were smaller in patients who received RIC as compared to myeloablative conditioning. After RIC, the intermediate- and high-risk groups were 1.34 and 1.61 times more likely to die by 2 years compared to patients in the low-risk group [23]. After myeloablative conditioning, these hazard ratios were 1.97 and 4.61, respectively.
The PAM score and the HCT-CI [24] represent different tools for prognostication after HCT. The PAM score was developed as a simple global prognostic tool that incorporates patient age, selected comorbidities, disease-risk, and donor type to predict overall survival at 2 years. In contrast, the HCT-CI is a comorbidity index designed specifically to capture the burden of multiple organ dysfunctions (n=17 comorbidities) before allogeneic HCT to predict the risk of non-relapse mortality. The HCT-CI was recently modified to incorporate patient age as an additional risk factor for non-relapse mortality [25]. Even though this HCT-CI/age score does not consider disease risk or donor type, its performance in predicting survival is similar to its performance in predicting non-relapse mortality [25]. The PAM and HCT-CI scores should complement each other, since each has components that the other does not have. Previous results have shown that consideration of disease severity led to a statistically significantly improved model when added to a model containing HCT-CI [26]. Similarly, we expect that consideration of certain components of HCT-CI would lead to a statistically significantly improved model when added to PAM. Both HCT-CI and PAM scores, therefore, provide useful information.
Our study has several limitations. While the data clearly showed a change in association between PAM and mortality, it is impossible within the scope of this study to prove the underlying reason for these changes. The cubic spline graphs clearly demonstrate that the relationship between PAM variables and mortality is complex and dynamic as opposed to simple and static, highlighting the potential limitations of categorical modeling. Results from these models could be used to select the most appropriate cutoffs for categorical analyses or, ideally, to develop more sophisticated non-categorical algorithms for estimating survival probabilities. The revised PAM score might not apply to patients with diseases other than hematologic malignancies and does not apply to patients treated with RIC regimens.
In summary, the association between PAM and mortality has changed over time. Its performance and the strength of association with outcome have diminished, and the risk factors for mortality have also changed. PAM provides better prediction for patients treated with myeloablative conditioning regimens than for those treated with RIC regimens. All of the components in the PAM score can be easily ascertained by referring physicians, although the FEV1 is seldom measured before patients arrive at the transplant center, unless they have pulmonary symptoms. If this information is available, then the updated correlation between PAM score and survival after HCT (available at http://cdsweb.fhcrc.org/pam/) may assist clinicians in counseling patients during the initial discussion about the benefits and risks of HCT. The PAM score could also be used in balancing cohorts of patients involved in clinical trials. Our results indicate that prognostic tools should be re-evaluated and refined periodically, especially when clinical practices or patient characteristics change over time.
Supplementary Material
Highlights.
The PAM score predicts survival after allogeneic HCT.
The PAM score has been updated for clincial use.
Prognostic models should be periodically reassessed over time.
Acknowledgments
Supported by Grants CA18029, CA78902, and CA15704 from the National Cancer Institute.
Figure A1.
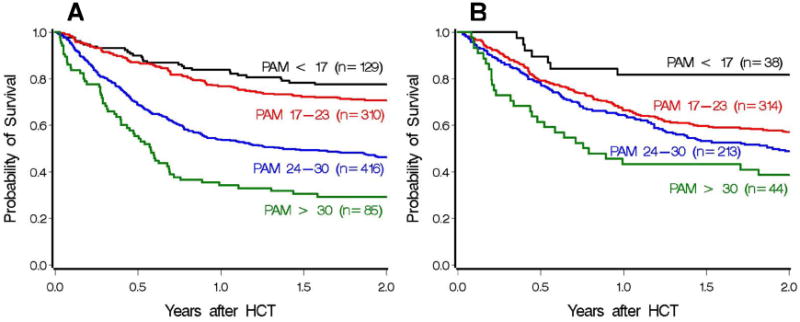
Two-year survival for patients who received myeloablative (A) and reduced-intensity conditioning (B) from the current cohort, grouped into 4 separate PAM categorizations based on the original study. Category 1 (black): PAM < 17, category 2 (red): PAM 17-23, category 3 (blue): PAM 24-30, category 4 (green): PAM > 30.
Figure A2.
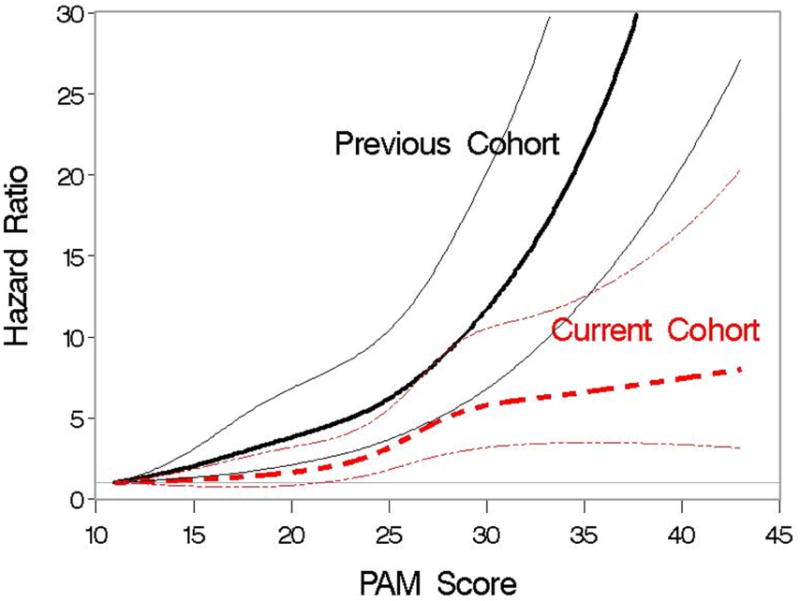
Association of PAM score and the hazard of 2-year mortality when PAM is modeled as a cubic spline. Association is examined separately for patients who received myeloablative conditioning in the previous validation cohort and the current cohort. Hazard ratios are indicated by thicker lines; pointwise 95% CI are indicated by thinner lines.
Figure A3.
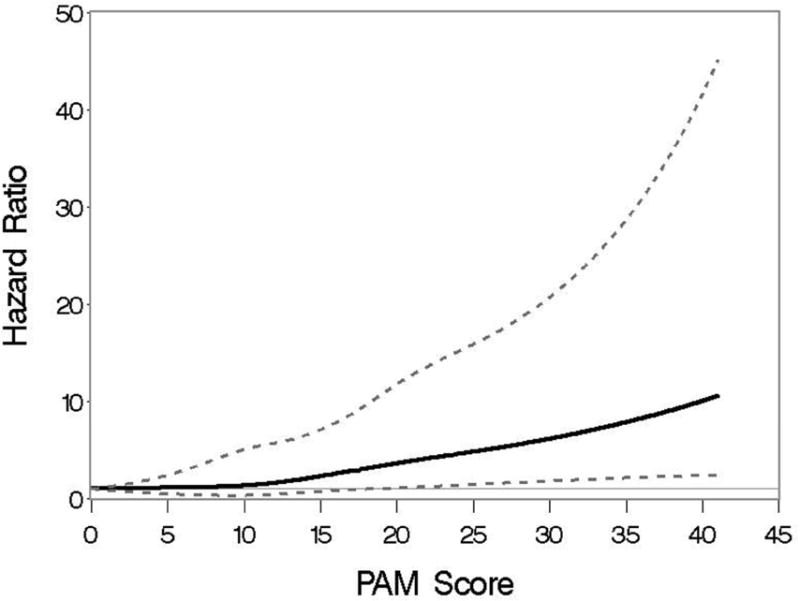
Association of the revised PAM score and the hazard of 2-year mortality when PAM is modeled as a cubic spline, using the external validation cohort from the Dana Farber Cancer Institute. Hazard ratios are indicated by thicker lines; pointwise 95% CI are indicated by thinner lines.
Table A1. Components of the original PAM score.
| Component | Score* |
|---|---|
| Patient age, years | |
| < 50 | 1 |
| 50-60 | 3 |
| >60 | 5 |
|
| |
| Donor type | |
| Matched related | 1 |
| Unrelated | 3 |
| Mismatched | 4 |
|
| |
| Disease risk | |
| Low | 1 |
| Intermediate | 8 |
| High | 12 |
|
| |
| Conditioning regimens | |
| Nonmyeloablative (reduced intensity) | 1 |
| Non-total-body irradiation | 4 |
| Total-body irradiation with ≤ 12 Gy | 8 |
| Total-body irradiation with > 12 Gy | 9 |
|
| |
| Serum creatinine level | |
| ≤ 1.2 mg/dL | 1 |
| > 1.2 mg/dL | 8 |
|
| |
| Serum alanine aminotransferase level | |
| ≤ 49 U/L | 1 |
| > 49 U/L | 2 |
|
| |
| FEV1 | |
| > 80% | 1 |
| 70-80% | 3 |
| < 70% | 6 |
|
| |
| Carbon monoxide diffusing capacity | |
| > 80% | 1 |
| 70-80% | 1 |
| < 70% | 4 |
Total PAM scores ranged from 8-50.
Table A2. Association of original PAM components with hazard of 2-year mortality after HCT with myeloablative conditioning in the current cohort compared to the previous validation cohort.
| Previous Validation Cohort | Current Cohort | |||||
|---|---|---|---|---|---|---|
|
|
||||||
| Component* | N (%) | HR (95% CI) | P | N (%) | HR (95% CI) | P |
| Patient age, years | ||||||
| < 20 | 84 (7) | Reference | 52 (5) | Reference | ||
| 20-30 | 196 (16) | 0.89 (0.63-1.27) | .52 | 126 (13) | 1.24 (0.73-2.09) | .42 |
| 30-40 | 315 (25) | 0.98 (0.70-1.36) | .88 | 160 (17) | 0.85 (0.50-1.43) | .54 |
| 40-50 | 397 (32) | 1.08 (0.78-1.50) | .64 | 234 (24) | 0.97 (0.59-1.61) | .91 |
| 50-60 | 238 (19) | 1.31 (0.93-1.84) | .12 | 279 (29) | 1.21 (0.74-1.97) | .45 |
| >60 | 12 (1) | 0.93 (0.41-2.10) | .86 | 107 (11) | 1.74 (1.03-2.92) | .04 |
|
| ||||||
| Donor | ||||||
| HLA-matched related | 624 (50) | Reference | 385 (40) | Reference | ||
| HLA-mismatched related | 125 (10) | 2.51 (1.97-3.19) | <.0001 | 21 (2) | 2.01 (1.13-3.61) | .02 |
| Unrelated | 493 (40) | 1.59 (1.33-1.89) | <.0001 | 552 (58) | 1.70 (1.37-2.11) | <.0001 |
|
| ||||||
| Disease risk | ||||||
| Low | 377 (30) | Reference | 190 (20) | Reference | ||
| Intermediate | 336 (27) | 2.44 (1.89-3.14) | <.0001 | 559 (58) | 1.91 (1.38-2.65) | .0001 |
| High | 529 (43) | 3.40 (2.69-4.31) | <.0001 | 209 (22) | 4.62 (3.28-6.51) | <.0001 |
|
| ||||||
| Serum creatinine | ||||||
| ≤ 1.2 mg/dL | 1180 (95) | Reference | 886 (92) | Reference | ||
| > 1.2 mg/dL | 62 (5) | 2.33 (1.73-3.14) | <.0001 | 72 (8) | 1.38 (0.97-1.96) | .07 |
|
| ||||||
| Serum ALT | ||||||
| ≤ 49 U/L | 974 (78) | Reference | 805 (84) | Reference | ||
| > 49 U/L | 268 (22) | 1.15 (0.95-1.39) | .14 | 153 (16) | 1.03 (0.79-1.35) | .83 |
|
| ||||||
| FEV1 | ||||||
| > 80% | 1023 (82) | Reference | 795 (83) | Reference | ||
| 70-80% | 141 (11) | 1.25 (0.98-1.59) | .08 | 116 (12) | 1.14 (0.85-1.53) | .38 |
| < 70% | 78 (6) | 1.28 (0.95-1.74) | .11 | 47 (5) | 1.65 (1.10-2.50) | .02 |
|
| ||||||
| DLCO | ||||||
| > 80% | 1026 (83) | Reference | 539 (56) | Reference | ||
| 70-80% | 134 (11) | 1.29 (1.02-1.64) | .03 | 245 (26) | 1.10 (0.87-1.39) | .43 |
| < 70% | 82 (7) | 1.85 (1.39-2.46) | <.0001 | 174 (18) | 1.22 (0.93-1.59) | .15 |
Abbreviations: ALT, alanine aminotransferase; DLCO, carbon monoxide diffusing capacity
PAM components are categorized as in the original report.
Table A3. Association of revised PAM components with 2-year mortality in the external validation cohort of 401 patients from the Dana Farber Cancer Institute.
| Variable | N (%) | Hazard Ratio (95% CI) | P |
|---|---|---|---|
| Patient age, years | |||
| < 65 | 401 (100%) | 1 | - |
| ≥ 65 | 0 (0%) | NA | - |
|
| |||
| Donor type | Global p<.0001 | ||
| HLA-matched, related | 173 (43%) | 1 | - |
| Unrelated, HLA-matched | 174 (43%) | 1.18 (0.83-1.66) | .36 |
| Unrelated, HLA-mismatched | 26 (6%) | 2.86 (1.69-4.83) | <.0001 |
| Unrelated, cord blood | 23 (6%) | 2.76 (1.48-5.15) | .001 |
| HLA-mismatched, related | 5 (1%) | 2.61 (0.94-7.21) | .06 |
|
| |||
| Disease risk | Global p<.0001 | ||
| Low | 34 (8%) | 1 | - |
| Intermediate | 224 (56%) | 1.97 (0.95-4.09) | .07 |
| High | 125 (31%) | 2.81 (1.34-5.88) | .006 |
| Very High | 18 (4%) | 7.08 (2.89-17.30) | <.0001 |
|
| |||
| FEV1* | 401 | 1.13 (1.01-1.25) | .03 |
|
| |||
| Patient/Donor CMV | Global p=.34 | ||
| -/- | 153 (38%) | 1 | - |
| -/+ | 51 (13%) | 1.31 (0.82-2.09) | .26 |
| +/- | 110 (27%) | 1.08 (0.73-1.61) | .70 |
| +/+ | 87 (22%) | 1.39 (0.94-2.07) | .10 |
Abbreviations: CMV, cytomegalovirus
FEV1 modeled as a continuous linear variable. Hazard ratio represents relative change in hazard associated with each decrease in FEV1 by 10%.
Footnotes
Conflict-of-interest disclosure: The authors declare no relevant competing conflicts of interest.
Authorship: Contributions: B.K.C.A., J.W.C., M.L.S., and P.J.M. conceived of and designed the study; P.A., M.F., D.K.M., M.L.S., M.J.B., C.J.G., H.J.D., R.S., F.R.A., and P.J.M. collected and assembled data; B.K.C.A, T.A.G., M.F., D.K.M., M.L.S., M.J.B., and P.J.M. analyzed and interpreted data; B.K.C.A., T.A.G., M.L.S. and P.J.M. wrote the manuscript; M.J.B., H.J.D., R.S., F.R.A., and J.W.C. edited the manuscript; and B.K.C.A, T.A.G, P.A., M.F., D.K.M., M.L.S., M.J.B., C.J.G., H.J.D., R.S., F.R.A., J.W.C. and P.J.M. gave final approval of the manuscript.
Publisher's Disclaimer: This is a PDF file of an unedited manuscript that has been accepted for publication. As a service to our customers we are providing this early version of the manuscript. The manuscript will undergo copyediting, typesetting, and review of the resulting proof before it is published in its final citable form. Please note that during the production process errors may be discovered which could affect the content, and all legal disclaimers that apply to the journal pertain.
References
- 1.Parimon T, Au DH, Martin PJ, Chien JW. A risk score for mortality after allogeneic hematopoietic cell transplantation. Ann Intern Med. 2006;144:407–14. doi: 10.7326/0003-4819-144-6-200603210-00007. [DOI] [PubMed] [Google Scholar]
- 2.Barba P, Piñana JL, Martino R, Valcárcel D, Amorós A, Sureda A, et al. Comparison of two pretransplant predictive models and a flexible HCT-CI using different cut off points to determine low-, intermediate-, and high-risk groups: the flexible HCT-CI Is the best predictor of NRM and OS in a population of patients undergoing allo-RIC. Biol Blood Marrow Transplant. 2010;16:413–20. doi: 10.1016/j.bbmt.2009.11.008. [DOI] [PubMed] [Google Scholar]
- 3.Castagna L, Fürst S, Marchetti N, El Cheikh J, Faucher C, Mohty M, et al. Retrospective analysis of common scoring systems and outcome in patients older than 60 years treated with reduced-intensity conditioning regimen and alloSCT. Bone Marrow Transplant. 2011;46:1000–5. doi: 10.1038/bmt.2010.227. [DOI] [PubMed] [Google Scholar]
- 4.Mori Y, Teshima T, Kamezaki K, Kato K, Takenaka K, Iwasaki H, et al. Validation of pretransplantation assessment of mortality risk score in the outcome of hematopoietic SCT in non-Caucasians. Bone Marrow Transplant. 2012;47:1075–81. doi: 10.1038/bmt.2011.229. [DOI] [PubMed] [Google Scholar]
- 5.Xhaard A, Porcher R, Chien JW, de Latour RP, Robin M, Ribaud P, et al. Impact of comorbidity indexes on non-relapse mortality. Leukemia. 2008;22:2062–9. doi: 10.1038/leu.2008.197. [DOI] [PMC free article] [PubMed] [Google Scholar]
- 6.Labonté L, Iqbal T, Zaidi MA, McDiarmid SA, Huebsch LB, Tay J, et al. Utility of comorbidity assessment in predicting transplantation-related toxicity following autologous hematopoietic stem cell transplantation for multiple myeloma. Biol Blood Marrow Transplant. 2008;14:1039–44. doi: 10.1016/j.bbmt.2008.06.019. [DOI] [PubMed] [Google Scholar]
- 7.Appelbaum F, Forman S, Negrin R, Blume K. Thomas' Hematopoietic Cell Transplantation. 4th. Oxford, England: Wiley-Blackwell Publishing; 2009. [Google Scholar]
- 8.McSweeney PA, Niederwieser D, Shizuru JA, Sandmaier BM, Molina AJ, Maloney DG, et al. Hematopoietic cell transplantation in older patients with hematologic malignancies: replacing high-dose cytotoxic therapy with graft-versus-tumor effects. Blood. 2001;97:3390–400. doi: 10.1182/blood.v97.11.3390. [DOI] [PubMed] [Google Scholar]
- 9.Standardization of Spirometry, 1994 Update. American Thoracic Society. Am J Respir Crit Care Med. 1995;152:1107–36. doi: 10.1164/ajrccm.152.3.7663792. [DOI] [PubMed] [Google Scholar]
- 10.Lung function testing: selection of reference values and interpretative strategies. American Thoracic Society. Am Rev Respir Dis. 1991;144:1202–18. doi: 10.1164/ajrccm/144.5.1202. [DOI] [PubMed] [Google Scholar]
- 11.American Thoracic Society. Single-breath carbon monoxide diffusing capacity (transfer factor). Recommendations for a standard technique--1995 update. Am J Respir Crit Care Med. 1995;152:2185–98. doi: 10.1164/ajrccm.152.6.8520796. [DOI] [PubMed] [Google Scholar]
- 12.Sorror ML. How I assess comorbidities before hematopoietic cell transplantation. Blood. 2013;121:2854–63. doi: 10.1182/blood-2012-09-455063. [DOI] [PMC free article] [PubMed] [Google Scholar]
- 13.Crapo RO, Morris AH, Gardner RM. Reference spirometric values using techniques and equipment that meet ATS recommendations. Am Rev Respir Dis. 1981;123:659–64. doi: 10.1164/arrd.1981.123.6.659. [DOI] [PubMed] [Google Scholar]
- 14.Crapo RO, Morris AH. Standardized single breath normal values for carbon monoxide diffusing capacity. Am Rev Respir Dis. 1981;123:185–9. doi: 10.1164/arrd.1981.123.2.185. [DOI] [PubMed] [Google Scholar]
- 15.Heinzl H, Kaider A. Gaining more flexibility in Cox proportional hazards regression models with cubic spline functions. Comput Methods Programs Biomed. 1997;54:201–8. doi: 10.1016/s0169-2607(97)00043-6. [DOI] [PubMed] [Google Scholar]
- 16.Armand P, Gibson CJ, Cutler C, Ho VT, Koreth J, Alyea EP, et al. A disease risk index for patients undergoing allogeneic stem cell transplantation. Blood. 2012;120:905–13. doi: 10.1182/blood-2012-03-418202. [DOI] [PMC free article] [PubMed] [Google Scholar]
- 17.Greenberg P, Cox C, LeBeau MM, Fenaux P, Morel P, Sanz G, et al. International scoring system for evaluating prognosis in myelodysplastic syndromes. Blood. 1997;89:2079–88. [PubMed] [Google Scholar]
- 18.Sehn LH, Berry B, Chhanabhai M, Fitzgerald C, Gill K, Hoskins P, et al. The revised International Prognostic Index (R-IPI) is a better predictor of outcome than the standard IPI for patients with diffuse large B-cell lymphoma treated with R-CHOP. Blood. 2007;109:1857–61. doi: 10.1182/blood-2006-08-038257. [DOI] [PubMed] [Google Scholar]
- 19.Solal-Céligny P, Roy P, Colombat P, White J, Armitage JO, Arranz-Saez R, et al. Follicular lymphoma international prognostic index. Blood. 2004;104:1258–65. doi: 10.1182/blood-2003-12-4434. [DOI] [PubMed] [Google Scholar]
- 20.Hoster E, Dreyling M, Klapper W, Gisselbrecht C, van Hoof A, Kluin-Nelemans HC, et al. A new prognostic index (MIPI) for patients with advanced-stage mantle cell lymphoma. Blood. 2008;111:558–65. doi: 10.1182/blood-2007-06-095331. [DOI] [PubMed] [Google Scholar]
- 21.Gooley TA, Chien JW, Pergam SA, Hingorani S, Sorror ML, Boeckh M, et al. Reduced mortality after allogeneic hematopoietic-cell transplantation. N Engl J Med. 2010;363:2091–101. doi: 10.1056/NEJMoa1004383. [DOI] [PMC free article] [PubMed] [Google Scholar]
- 22.Ljungman P, Brand R, Hoek J, de la Camara R, Cordonnier C, Einsele H, et al. Donor CMV status influences the outcome of allogeneic stem cell transplantation; a study by the European Group for Blood and Marrow Transplantation. Clin Infect Dis. 2014 doi: 10.1093/cid/ciu364. [DOI] [PubMed] [Google Scholar]
- 23.Storb R, Gyurkocza B, Storer BE, Sorror ML, Blume K, Niederwieser D, et al. Graft-Versus-Host Disease and Graft-Versus-Tumor Effects After Allogeneic Hematopoietic Cell Transplantation. J Clin Oncol. 2013 doi: 10.1200/JCO.2012.45.0247. [DOI] [PMC free article] [PubMed] [Google Scholar]
- 24.Sorror ML, Maris MB, Storb R, Baron F, Sandmaier BM, Maloney DG, et al. Hematopoietic cell transplantation (HCT)-specific comorbidity index: a new tool for risk assessment before allogeneic HCT. Blood. 2005;106:2912–9. doi: 10.1182/blood-2005-05-2004. [DOI] [PMC free article] [PubMed] [Google Scholar]
- 25.Sorror ML, Storb RF, Sandmaier BM, Maziarz RT, Pulsipher MA, Maris MB, et al. Comorbidity-Age Index: A Clinical Measure of Biologic Age Before Allogeneic Hematopoietic Cell Transplantation. J Clin Oncol. 2014 doi: 10.1200/JCO.2013.53.8157. [DOI] [PMC free article] [PubMed] [Google Scholar]
- 26.ElSawy M, Storer BE, Sorror ML. “To Combine or Not to Combine:” Optimizing Risk Assessment before Allogeneic Hematopoietic Cell Transplantation. Biol Blood Marrow Transplant. 2014;20:1455–6. doi: 10.1016/j.bbmt.2014.05.005. [DOI] [PubMed] [Google Scholar]
- 27.Deeg HJ, Scott BL, Fang M, Shulman HM, Gyurkocza B, Myerson D, et al. Five-group cytogenetic risk classification, monosomal karyotype, and outcome after hematopoietic cell transplantation for MDS or acute leukemia evolving from MDS. Blood. 2012;120:1398–408. doi: 10.1182/blood-2012-04-423046. [DOI] [PMC free article] [PubMed] [Google Scholar]
Associated Data
This section collects any data citations, data availability statements, or supplementary materials included in this article.


