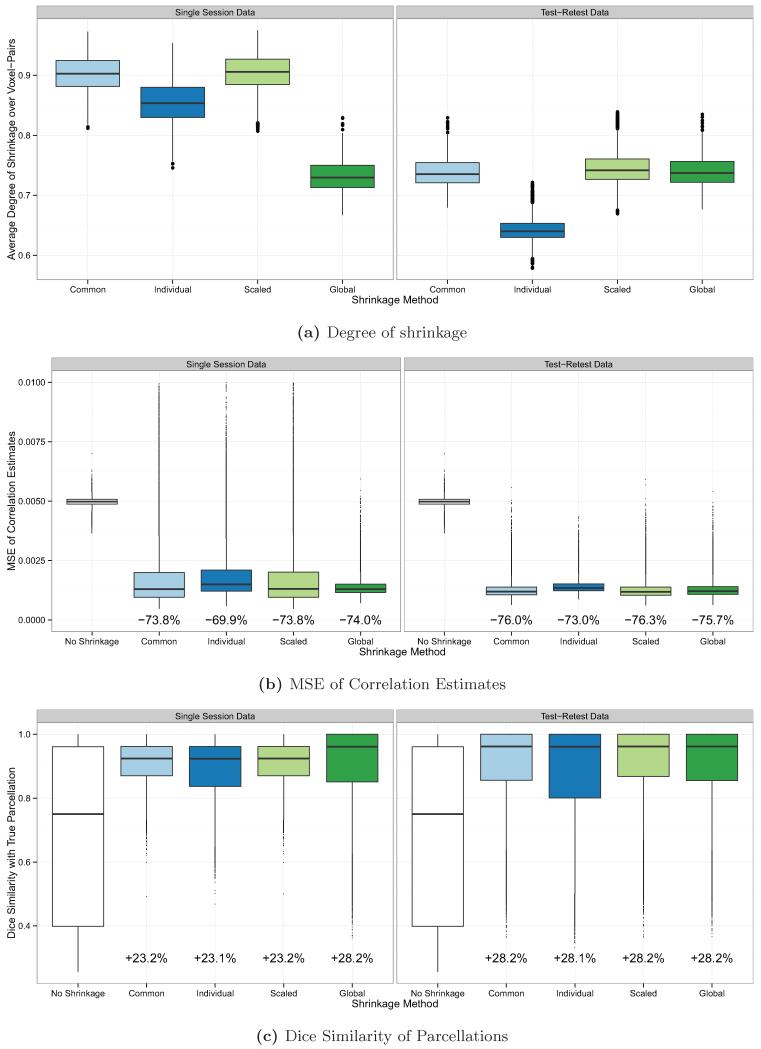
Figure 3.
The degree of shrinkage (a), MSE of correlation estimates (b), and Dice coefficient of similarity of parcellations with the true parcellations (c) under the default simulation parameters of I = 20, T = 200, ρ = 0.05, and , using either single session data (left) or test-retest data (right). The percent decrease in the median MSE of the shrinkage estimates, compared with the MSE of the raw estimates, is reported below each boxplot in (b); the percent increase in the Dice coefficient of the shrinkage-based parcellations, compared with the Dice coefficients of the raw parcellations, is reported below each boxplot in (c).

