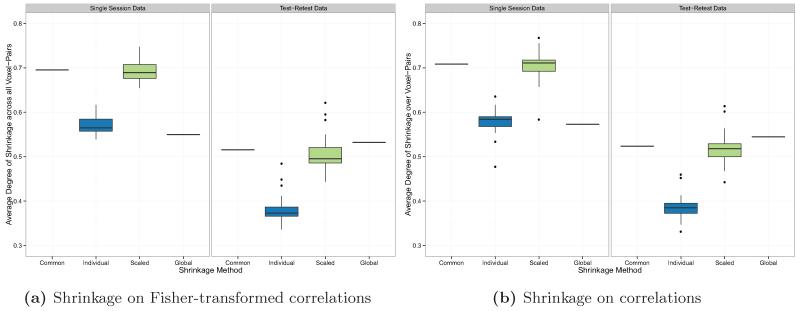
Figure 6.
Degree of shrinkage (percent weighting of the group mean, averaged over all voxel-pairs) by noise variance estimation method and type of dataset (single session or test-retest) used to perform shrinkage. For the “common” and “global” noise variance methods, all subjects have the same shrinkage parameter at each voxel-pair, so the boxplot shows a single value.

