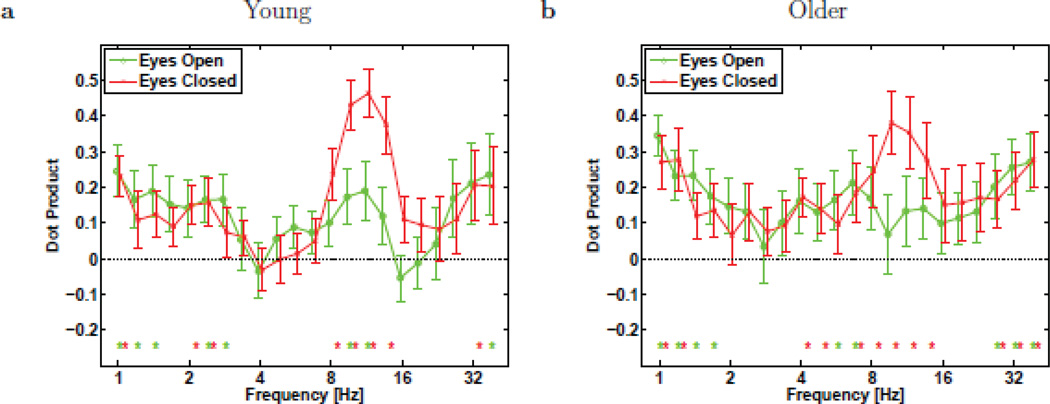
Figure 8.
Mean dot product of topographic patterns (e.g., Figs. 5–7) between the log(power) and BOSC measures, for Young (a) and Older (b) participants, computed separately for eyes-open (o) and eyes-closed (×) conditions. Error bars denote standard error of the mean. Asterisks denote dot product significantly non-zero (p < 0.05, Mann-Whitney U test with df = 15 and 11 for Young and Older groups, respectively).

