Abstract
Goals
Fetal growth depends on placental growth; the fetoplacental weight ratio (FPR) is a common proxy for the balance between fetal and placental growth. Male and female infants are known to have differing vulnerabilities in fetal life, during parturition and in infancy. We hypothesized that these differences may be paralleled by differences in how birth weight (BW) and the fetoplacental weight ratio (FPR) are affected by changes in placental proportions.
Materials and Methods
Placental proportion measures (disk shape, larger and smaller chorionic diameters, chorionic plate area calculated as the area of an ellipse with the 2 given diameters, disk thickness, cord eccentricity and cord length) were available for 24,601 participants in the Collaborative Perinatal Project delivered between>34 - <43 completed weeks. The variables were standardized and entered into multiple automated regression splines (MARS 2.0, Salford Systems, Vista CA) to identify nonlinearities in the relationships of placental growth measures to BW and FPR with results compared for male and female infants.
Results
Changes in chorionic plate growth in female compared to male infants resulted in a greater change in BW and FPR. The positive effects of umbilical cord length on BW reversed at the mean umbilical cord length in females and at +0.08 SD in male infants.
Conclusions
Female infants' BW and FPR are each more responsive to changes in placental chorionic plate growth dimensions than males; this may account for greater female resilience (and greater male vulnerability) to gestational stressors. The effect of umbilical cord length on FPR may be due to longer cords carrying greater fetal vascular resistance. Again male fetuses show a higher “threshold” to the negative effects of longer cords on FPR.
Introduction
Birth weight is a simple measure of birth outcome with enormous implications for perinatal survival. Increasingly, evidence has emerged that the influence of birth weight echoes across the life course and may influence risk of cardiovascular disease (including hypertension], [1-11] heart attack and stroke, [4, 12] diabetes[13-16] and obesity,[17, 18] osteoporosis, [19] breast[20-23] and prostate cancers, [24] and neurodevelopmental[25-31] and neuropsychiatric outcomes including schizophrenia. [32-36] Birth weight, however, is not necessarily the underlying cause but might more accurately be described as a surrogate indicator of conditions occurring in the intrauterine environment. [37-40] The principal determinant of birth weight is the transfer efficiency of placental nutrients and oxygen, a mechanism highly dependent on a well grown placenta. [41-46] Measures that reflect the growth of the placenta, with regard to the transfer of nutrients and oxygen that enable fetal growth, might provide a window onto the underlying mechanism by which birth weight is associated with morbidity and mortality in infants, children, and adults.
We have previously shown that the fetoplacental weight ratio varies with placental proportions, suggesting that differently proportioned placentas have different functional efficiency. [47] We now hypothesize that male and female infants might respond differently to changes in placental proportion in terms of their birth weight and/or fetoplacental weight ratio. Gender differences exist in these associations[48-53] that suggest that male and female fetuses may not have identical responses to intrauterine stressors. Specifically, we hypothesized that male infants' growth might be less responsive to altered placental proportions than female fetal growth. Using data from the National Collaborative Perinatal Project,[54, 55] we tested for subgroup differences in the relationships of placental gross growth dimensions (measures of size, structure and indirectly function) to birth weight in male as compared to female infants. Such differences could help elucidate the pathways that may produce differences by sex/gender in fetal,[56-58] neonatal, [59-62] and, potentially, more distally in child and adult health.[48-53]
Materials and Methods
Subjects were a subset of the National Collaborative Perinatal Project (NCPP). Details of the study have been described elsewhere.[54, 55] Briefly, from 1959 to 1965, women who attended prenatal care at 12 hospitals were invited to participate in the observational, prospective study. At entry, detailed demographic, socioeconomic and behavioral information was collected by in-person interview. A medical history, physical examination and blood sample were also obtained. In the following prenatal visits, women were repeatedly interviewed and physical findings were recorded. During labor and delivery, placental gross morphology was examined and samples were collected for histologic examination. The children were followed for up to seven years of age. Maternal race was self-reported and was, for the purposes of this analysis, recoded into two groups, African-American as compared to all other categories (overwhelmingly Caucasian and Hispanic in this decades-old population). Among 41,970 women delivering their first or only singleton liveborn infant in the cohort, 36,017 (86%) contributed placenta data; those who contributed placental data were essentially identical to those who did not, [63] suggesting that this sample is not biased. The analytic sample was restricted to those with complete data on the necessary placental gross measures (see below), placental weight, birth weight, and known gestational age >= 34 weeks and less than 43 completed weeks (N=24,061, 67%).
Placental gross measures, assessed with a standard protocol [66], included: 1) placental weight; 2) placental shape; 3) the larger and smaller diameters of the chorionic elliptical disc (the middle layer of the placenta between the maternal membrane side and the fetal membrane side; comprises the fetal vasculature); 4) chorionic disk thickness; 5) umbilical cord length. The original coding as well as the recoding and calculated variables used for this analysis are described below.
Predictors (independent variables)
Placental weight was measured in decagrams at delivery and converted to grams.
Chorionic plate area (square cm) was estimated by calculation of the area of an ellipse from the measured (cm) larger diameter and smaller diameters of the chorionic disc.
Chorionic disk thickness at the center of the chorionic disc was recorded in units of 0.1 cm, by piercing the disc with a knitting needle on which millimeter marks were inscribed.
Umbilical cord length was recorded in centimeters as it was measured in the Labor and Delivery Room.
Outcomes (dependent variables)
Birth weight was measured in grams at delivery.
The fetoplacental weight ratio (FPR) was calculated as birth weight divided bythe placental weight.
Statistical analysis
Spline regression[64] and multivariate adaptive splines (MARS [65]) in particular have been identified as methods to efficiently discriminate subgroup differences. [66] MARS is a procedure for fitting adaptive non-linear regression that uses piece-wise linear basis functions to define relationships between a response variable and some set of predictors[49]. Basis functions are defined in pairs by using a knot that defines a change point along the range of a predictor. For example, in our analysis,
bn = max(0,c-plcwt)
bn+1 = max(0,plcwt-c)
where c is the knot and plcwt is one predictor. When fitting a MARS regression splines model, knots are chosen in a forward stepwise manner [68]. At each step, the model selects the knots and basis functions that give the greatest decrease in the residual sum of squares.
MARS spline regression also provides some insight regarding the importance of variables as predictors of the dependent variable. MARS spline regression refits the model after removing all terms involving the variable to be assessed and calculates the reduction in goodness of fit. All variables are then ranked according to their impact on goodness of fit. An optimal MARS spline regression model, in terms of goodness of fit, is the one with the lowest generalized cross-validation (GCV) measure. In our analyses, MARS local solutions, or splines, were generated by a two-stage selection procedure to identify the predictor variables and then estimate their respective knot locations based on a recursive partitioning procedure. [65, 67, 68]As described above, basis functions were then used as the new independent variables of regression estimation models. Knots marked the critical values above and below which the predictors-outcome relationship changes. We set no constraints on spline length, defaults were set to optimize accuracy rather than speed, and maxima set at 20 basis functions per solution and two interactions between variables. The “best solution”, balancing explanatory power and parsimony, was selected by the software defaults. The cut-points, or knots, that define junctions of regions of data with differing local solutions for the placental gross growth dimensions, were compared between the outcomes of birth weight and fetoplacental weight ratio.
We ran two models in subgroups of male and female infants controlling for the race covariate (Caucasian and/or Hispanic v. African-American): 1) regressing birth weight on placental weight and the 5 placental measures (chorionic plate area, umbilical cord length, placental disk thickness, larger placental diameter and smaller placental diameter); 2) regressing fetoplacental weight ratio on the five placental dimensions. R-squares were compared between MARS models and simple linear models. If non-linearities were identified, the analyses were rerun using standardized (z-scored) variables to identify the intervals at which the linear relationship changed. To compare different variables on the same scales, z-scored values are presented in bivariate plots.
Results
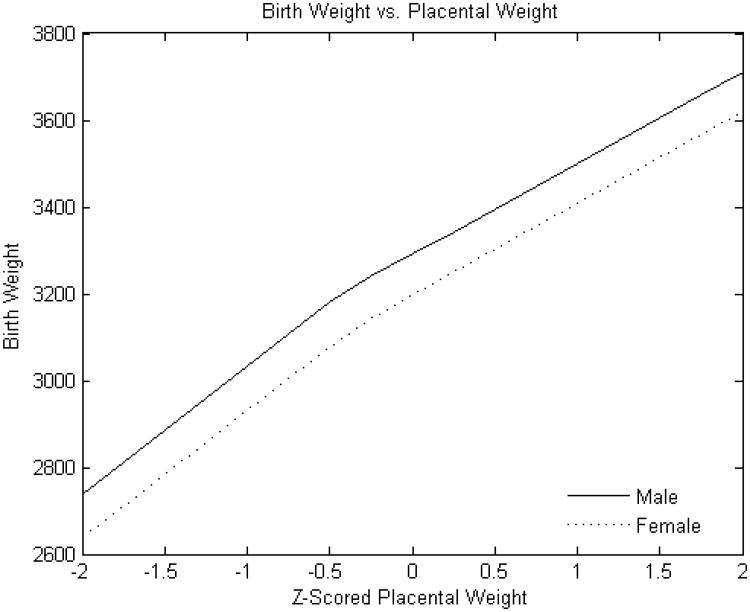
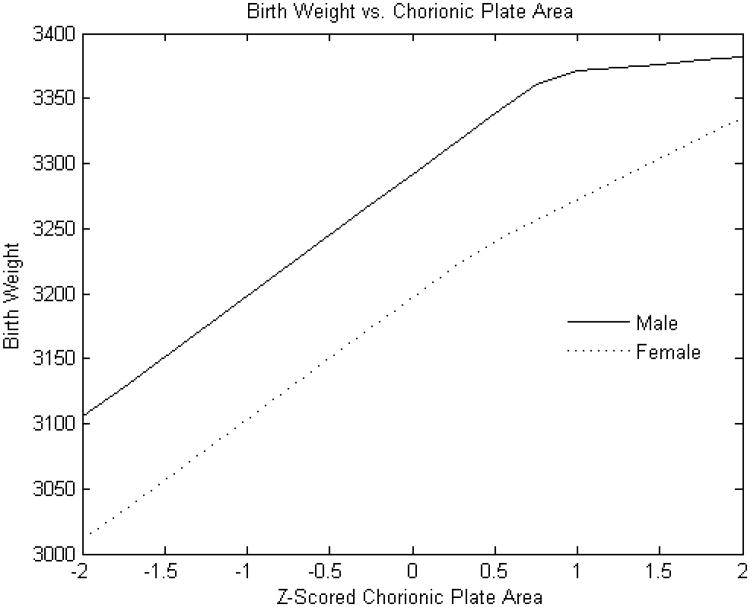
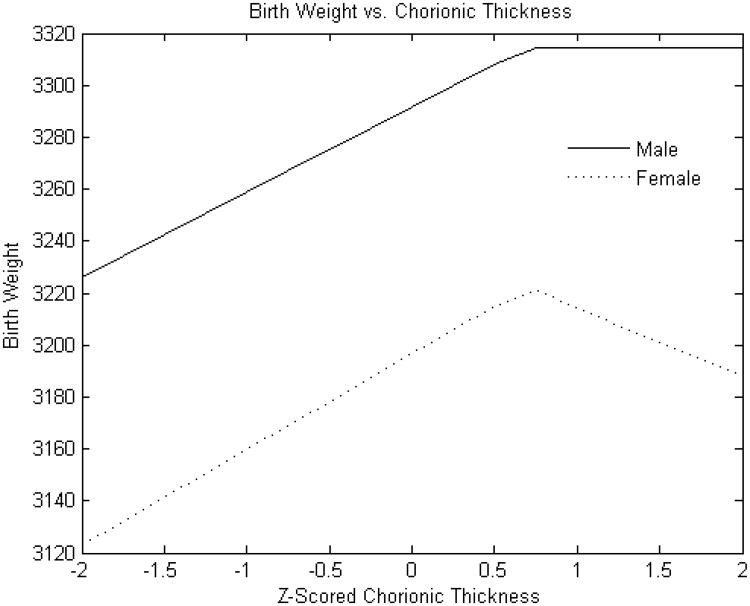
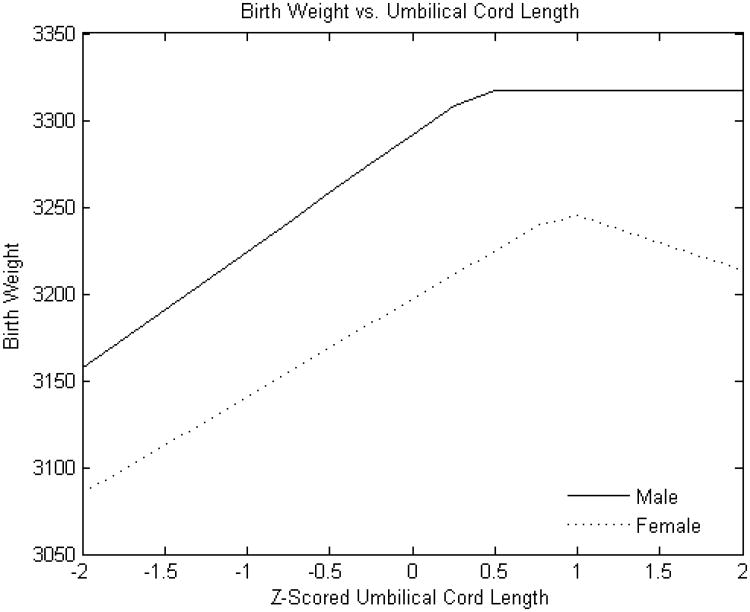
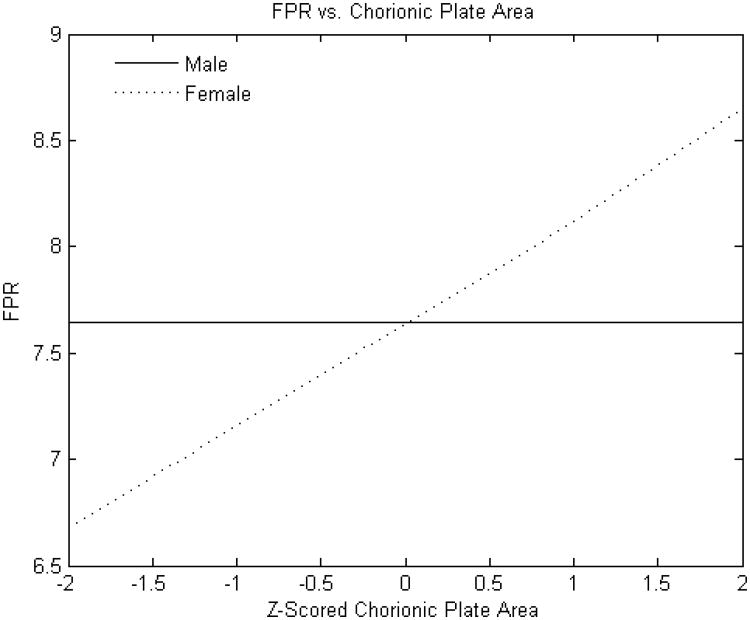
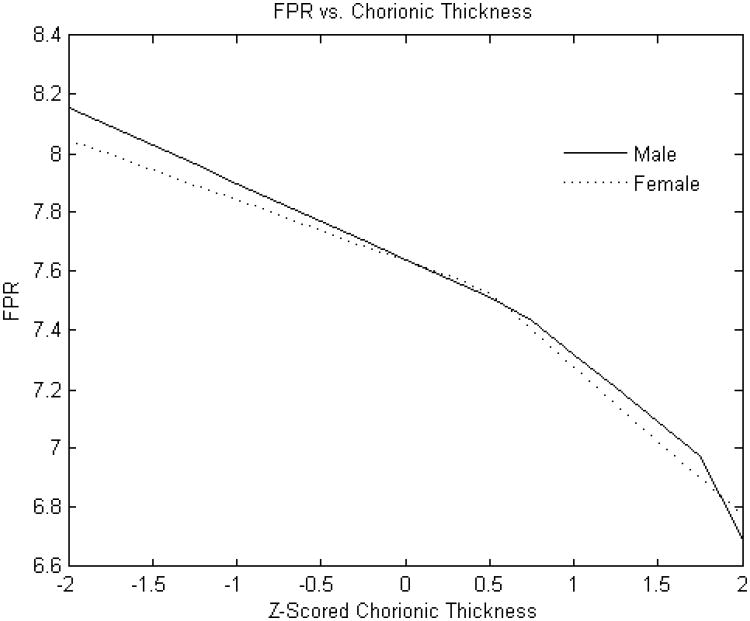
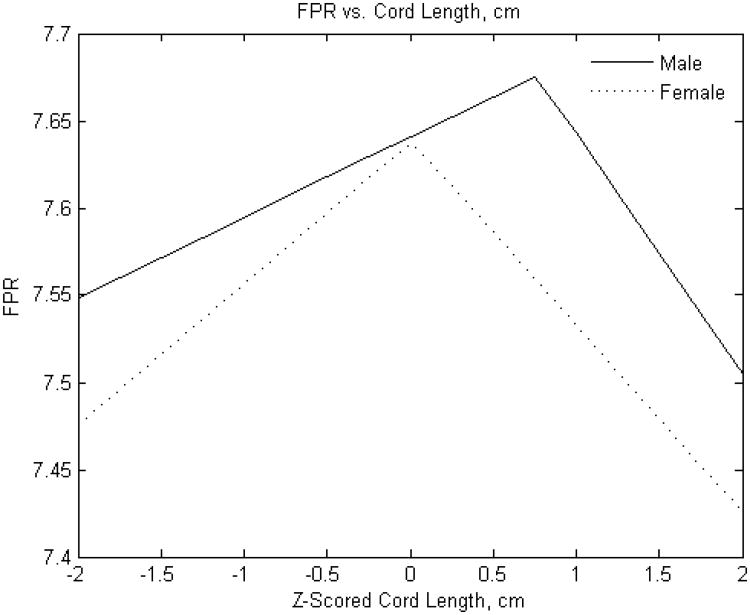
Characteristics of the study sample are presented in Table 1. MARS analyses of the relationships of the placental gross growth measures with birth weight and feto-placental weight ratio were performed stratifying on infant sex. All presented results are adjusted for all other placental measures and thus are independent of one another. We present the results visually through a series of figures (Figures 1, 2A, 3A, 4A, birth weight outcome; Figures 2B, 3B, 4B, fetoplacental ratio outcome) that illustrate the male-female differences more clearly than tables. The complete set of data (including cut-points and slopes) can be found in the Appendix (Tables A1 and A2).
Figure 1. Standardized placental weight versus birth weight.
Y-axis: Birth weight (grams)
X-axis: Standardized (z-scored) placental weight
Figure 2A. Standardized chorionic plate area (square cm) versus birth weight.
Y-axis: Birth weight (grams)
X-axis: Standardized (z-scored) chorionic plate area (square cm)
Figure 3A. Standardized chorionic plate thickness (cm) versus birth weight.
Y-axis: Birth weight (grams)
X-axis: Standardized (z-scored) chorionic plate thickness (cm)
Figure 4A. Standardized umbilical cord length (cm) versus birth weight (g).
Y-axis: Birth weight (grams)
X-axis: Standardized (z-scored) umbilical cord length (cm)
Figure 2B. Standardized chorionic plate area (square cm) versus fetoplacental weight ratio.
Y-axis: Fetoplacental weight ratio
X-axis: Standardized (z-scored) chorionic plate area (square cm)
Figure 3B. Standardized chorionic plate thickness (cm) versus fetoplacental weight ratio.
Y-axis: Fetoplacental weight ratio
X-axis: Standardized (z-scored) chorionic plate thickness (cm)
Figure 4B. Standardized umbilical cord length (cm) versus fetoplacental weight ratio.
Y-axis: Fetoplacental weight ratio
X-axis: Standardized (z-scored) umbilical cord length (cm)
Birth Weight
As expected, male infants were larger than females (mean 3251± 497 g v. 3134 ± 482 g, p<0.0001. The relationship of placental weight to birth weight (Figure 1) was similar between sexes with the exception of an additional knot with reduced slope at higher placental weight ranges in male infants. However, the relations of the other placental parameters to birth weight showed several differences between male and female infants. The birth weight effect of estimated chorionic plate area was strongly positive throughout the variable range in female infants; ; there was also a strong association for male infants but this effect was present only up to the z score of 1 (approximately one standard deviation above the mean) (Figure 2A). Chorionic disk thickness (Figure 3A) differed in its relationship to birth weight in male as compared to female infants with a strong positive relationship in both at lower ranges but negative statistically significant effects at higher values in females with no corresponding significant effects in males. Umbilical cord length (Figure 4A) also differed in its relationship to birth weight in males as compared to female infants in a manner similar to what was seen for chorionic disk thickness. Umbilical cord length had both positive and negative effects on the fetoplacental weight ratios in both sexes, but the inflection point was found at approximately the mean (0.011 SD) in female infants, and at 0.76 SD in male infants. There was a strong and statistically significant positive relationship in both sexes at lower ranges, but the negative effects at longer cords were seen for only females.
Fetoplacental Weight Ratio (FPR)
The FPR was, on average, greater for male compared with female infants (7.58± 1.29 v. 7.39 ±1.26, p<0.0001). The point estimates of effects of selected placental predictors on the FPR were also different in male as compared to female infants. (Placental weight was not examined as predictor for this outcome given that it is a component of the FPR). As with birth weight, the effect of the chorionic plate area on FPR was very different between male and female infants. The FPR of male infants was independent of the chorionic plate area, but was monotonically positive in female infants (Figure 2B). In additional analyses (not shown), we found that the effects of larger and smaller chorionic plate diameters intersected at the mean values; in essence, the more elliptical the placenta, the less the FPR in female infants. In contrast to our findings for birth weight, effects of chorionic disk thickness and umbilical cord length did not appear to differ between male and female infants. The effects of chorionic disk thickness (Figure 3B) on FPR ratio were negative over the majority of the variable range for both male and female infants. The effects of umbilical cord length on FPR also did not differ substantially between male and female infants and had a similar inflection point at which the direction of the effect shifted from increases in cord lengths positively associated with the FPR to a negative association with longer cords (Figure 4B).
Finally we tested the robustness of these findings to race/ethnicity, in the following ways. First, when race was added as a covariate, all significant relationships were retained and all point-estimates of effect remained within 10-15% of their estimates unadjusted for race. Second, product terms were created to test for interactions between race and the placental variables selected by MARS in spline regression as having significant independent effects. No significant interaction between ethnicity and placental variables were identified. We also compared figures created for each subgroup (e.g. female African-American vs. female White and/or Hispanic) and found no detectable changes in the results.
Discussion
Spine regression analysis identified potentially important differences in the relationships between placental gross growth measures and the FPR in male as compared to female infants. As expected, male infants were larger than females, and their FPR was on average, also greater. We discovered, however, that the FPR for males changes less in relation to expansion of the chorionic plate, a dimension that reflects the uterine surface area (and by extension the number of uteroplacental arteries available to supply the placenta). Considering birth weight as the outcome, we found birth weights for female infants to be more responsive to changes in chorionic disk thickness and umbilical cord length in addition to variation in the chorionic plate area that were consistent with those on FPR. We speculate that this may reflect that male fetal growth is driven by extra-placental effects such as hormones including testosterone and thus is less responsive to changes in placental growth than females. In population terms, this could be a partial explanation for the apparent greater vulnerability of male infants to gestational complications; that is, their underlying “developmental program” does not permit adjustments and accommodations to changes in the intrauterine environment to the same degree as that of female infants.
Regardless of sex differences in points of inflection or linearity of associations, these results can be also used to address important aspects of the biological relationship between fetal and placental growth. Are the relationships of placental growth measures to birth weight and fetoplacental weight ratio linear? Our data indicate that the placental growth variables have linear relationships to birth weight and the fetoplacental weight ratio over a large portion of their range for both males and females. However, for analyses of other populations such as diabetic or macrosomic infants (which might have greater proportions of larger placentas with extreme measurement values) or preterm infants (which might have more extremely small placental measure values), non-linear analytic methods may be necessary to describe these relationships.
The fetoplacental weight ratio, the ratio of birth weight to placental weight, is considered to reflect the physiologic balance between these two interdependent but potentially competing growth trajectories. The placenta is the single greatest oxygen consumer in utero; in times of deprivation, the placenta can metabolize fetally derived glucose, potentially to fetal detriment. If the fetal growth outstrips the placenta, the fetus may face the stresses of parturition with reduced functional reserves. If the different dimensions of placental growth (e.g., the lateral expansion within the uterine lining measured as larger and smaller placental diameters and disk thickness) have similar effects on birth weight and placental weight across variable ranges, the fetoplacental weight ratio will not change. A greater effect on birth weight than placental weight will increase the fetoplacental weight ratio. Conversely, if placental weight increases with a steeper slope than birth weight (placental growth enhanced to a greater extent than fetal growth), the fetoplacental weight ratio will fall. If any placental gross growth dimensions, or even distinct ranges of any variables, showed such relationships, they would be potential markers of fetuses with distinctive intrauterine environments (fetal-growth promoting>placental growth promoting, “balanced”, and placental-growth promoting>fetal growth promoting). Either of the “unbalanced” relationships could be hypothesized to mark stressful fetal-placental physiologic states. It is hard to think of a biologically plausible “healthy” reason why a placenta should be getting larger while the fetus it is supplying does not. In general, maximal fetal growth would be considered a biologically “good outcome”, the baby with a fetoplacental weight ratio of 10:1 would be expected to have a different intrauterine cardiovascular and endocrine “experience” (to name two examples) than a baby with a normal fetoplacental weight ratio of 7.5±1.1, or a baby with a fetoplacental weight ratio of 5:1.
Consistent with our previous work in this data set that showed that, for a given placental weight, the thicker the placenta, the smaller the birth weight, [69] when the placental weight is distributed laterally, so that the placenta “covers” more uterine surface area, and thus can be fed by potentially a larger number of uteroplacental vessels, we speculate that the placenta is more efficient (in terms of making birth weight) than a “cupcake” placenta, covering a smaller surface area (and potentially containing longer or more numerous fetal stem vessels, creating a different, possibly greater, placental vascular resistance and rendering the placenta less efficient.
While the National Collaborative Perinatal Project (NCPP) was conducted several decades ago, there is little reason to expect that secular trends would change our findings. The measurements of the placental dimensions, placental weight, and birth weight were conducted at the time of the data collection and the methods of measurement have not appreciably changed. Furthermore, misclassification of infant sex would be rare and random if it occurred. The very large sample size of the NCPP with its wealth of information is advantageous with regard to modeling of complex statistical parameters as we have done here. Very few large scale cohort studies have placental measures available for such a large and unbiased proportion of the sample. Placentas are often available only for cases with adverse outcomes, greatly impeding our ability to examine hypotheses such as those studied here.
Significantly, our data suggest that two identically shaped placentas may pose a different stress to the male as compared to the female fetus that depends on the relationship of his/her placental dimensions within the (sex-specific) distribution (e.g. at particular z-scores of placental parameters). This may have important implications for understanding sex differences in the incidence of childhood and adult disorders with fetal origins, a hypothesis that is under current investigation.
Supplementary Material
Acknowledgments
This study was supported by a Young Investigator Award from the National Alliance for Research on Schizophrenia and Depression, Great Neck, NY (Dr Salafia); grants (1 K23 MH067857-01) Mid Career Development Award from the National Institutes of Mental Health (Dr. Salafia). Additional support was provided by a grant from Placental Analytics LLC.
References
- 1.Adair L, Dahly D. Developmental determinants of blood pressure in adults. Annu Rev Nutr. 25:2005. 407–434. doi: 10.1146/annurev.nutr.25.050304.092538. [DOI] [PubMed] [Google Scholar]
- 2.Barker DJ, Bull AR, Osmond C, Simmonds SJ. Fetal and placental size and risk of hypertension in adult life. BMJ. 1990;301(6746):259–262. doi: 10.1136/bmj.301.6746.259. see comment. [DOI] [PMC free article] [PubMed] [Google Scholar]
- 3.Barker DJ, Godfrey KM, Osmond C, Bull A. The relation of fetal length, ponderal index and head circumference to blood pressure and the risk of hypertension in adult life. Paediatr Perinat Epidemiol. 1992;6(1):35–44. doi: 10.1111/j.1365-3016.1992.tb00741.x. [DOI] [PubMed] [Google Scholar]
- 4.Barker DJ, Martyn CN. The maternal and fetal origins of cardiovascular disease. J Epidemiol Community Health. 1992;46(1):8–11. doi: 10.1136/jech.46.1.8. [DOI] [PMC free article] [PubMed] [Google Scholar]
- 5.Campbell DM, Hall MH, Barker DJ, Cross J, Shiell AW, Godfrey KM. Diet in pregnancy and the offspring's blood pressure 40 years later. Br J Obstet Gynaecol. 1996;103(3):273–280. doi: 10.1111/j.1471-0528.1996.tb09718.x. [DOI] [PubMed] [Google Scholar]
- 6.Law CM, Barker DJ, Bull AR, Osmond C. Maternal and fetal influences on blood pressure. Arch Dis Child. 1991;66(11):1291–1295. doi: 10.1136/adc.66.11.1291. [DOI] [PMC free article] [PubMed] [Google Scholar]
- 7.Moore K, Persaud T. The Developing Human: Clinically Oriented Embryology. Philadelphia: W.B. Saunders; 1993. The Placenta and fetal membranes; pp. 113–140. [Google Scholar]
- 8.Taylor SJ, Whincup PH, Cook DG, Papacosta O, Walker M. Size at birth and blood pressure: cross sectional study in 8-11 year old children. BMJ. 1997;314(7079):475–480. doi: 10.1136/bmj.314.7079.475. see comment. [DOI] [PMC free article] [PubMed] [Google Scholar]
- 9.Thame M, Osmond C, Wilks RJ, Bennett FI, McFarlane-Anderson N, Forrester TE. Blood pressure is related to placental volume and birth weight. Hypertension. 2000;35(2):662–667. doi: 10.1161/01.hyp.35.2.662. [DOI] [PubMed] [Google Scholar]
- 10.Wentzel P, Welsh N, Eriksson UJ. Developmental damage, increased lipid peroxidation, diminished cyclooxygenase-2 gene expression, and lowered prostaglandin E2 levels in rat embryos exposed to a diabetic environment. Diabetes. 1999;48(4):813–820. doi: 10.2337/diabetes.48.4.813. [DOI] [PubMed] [Google Scholar]
- 11.Whincup P, Cook D, Papacosta O, Walker M. Birth weight and blood pressure: cross sectional and longitudinal relations in childhood. BMJ. 1995;311(7008):773–776. doi: 10.1136/bmj.311.7008.773. [DOI] [PMC free article] [PubMed] [Google Scholar]
- 12.Tanis B, Kapiteijn K, Hage R, Rosendaal F, Helmerhorst F. Dutch women with a low birth weight have an increased risk of myocardial infarction later in life: a case control study. Reprod Health. 2005;2(1) doi: 10.1186/1742-4755-2-1. [DOI] [PMC free article] [PubMed] [Google Scholar]
- 13.Barker DJ. The fetal origins of type 2 diabetes mellitus. Ann Intern Med. 1999;130(4 Pt 1):322–324. doi: 10.7326/0003-4819-130-4-199902160-00019. comment. [DOI] [PubMed] [Google Scholar]
- 14.Forsen T, Eriksson J, Tuomilehto J, Reunanen A, Osmond C, Barker D. The fetal and childhood growth of persons who develop type 2 diabetes. Ann Intern Med. 2000;133(3):176–182. doi: 10.7326/0003-4819-133-3-200008010-00008. [DOI] [PubMed] [Google Scholar]
- 15.Levitt NS, Lambert EV. The foetal origins of the metabolic syndrome--a South African perspective. Cardiovasc J S Afr. 2002;13(4):179–180. [PubMed] [Google Scholar]
- 16.Phipps K, Barker DJ, Hales CN, Fall CH, Osmond C, Clark PM. Fetal growth and impaired glucose tolerance in men and women. Diabetologia. 1993;36(3):225–228. doi: 10.1007/BF00399954. see comment. [DOI] [PubMed] [Google Scholar]
- 17.Gluckman PD, Hanson MA, Morton SM, Pinal CS. Life-long echoes--a critical analysis of the developmental origins of adult disease model. Biol Neonate. 2005;87(2):127–139. doi: 10.1159/000082311. [DOI] [PubMed] [Google Scholar]
- 18.Vickers MH, Breier BH, Cutfield WS, Hofman PL, Gluckman PD. Fetal origins of hyperphagia, obesity, and hypertension and postnatal amplification by hypercaloric nutrition. American Journal of Physiology - Endocrinology & Metabolism. 2000;279(1):E83–87. doi: 10.1152/ajpendo.2000.279.1.E83. [DOI] [PubMed] [Google Scholar]
- 19.Cooper C, Javaid K, Westlake S, Harvey N, Dennison E. Developmental origins of osteoporotic fracture: the role of maternal vitamin D insufficiency. J Nutr. 2005;135(11):2728S–2734S. doi: 10.1093/jn/135.11.2728S. [DOI] [PubMed] [Google Scholar]
- 20.Jasienska G, Ziomkiewicz A, Lipson SF, Thune I, Ellison PT. High ponderal index at birth predicts high estradiol levels in adult women. Am J Human Biol. 2006;18(1):133–140. doi: 10.1002/ajhb.20462. [DOI] [PubMed] [Google Scholar]
- 21.Lagiou P, Hsieh C, T D, Xu B, Wuu J, et al. Birthweight differences between USA and China and their relevance to breast cancer aetiology. Int J Epidemiology. 2003;32:193–198. doi: 10.1093/ije/dyg047. [DOI] [PubMed] [Google Scholar]
- 22.Lagiou P, Lagiou A, Samoli E, Hsieh CC, Adami HO, Trichopoulos D. Diet during pregnancy and levels of maternal pregnancy hormones in relation to the risk of breast cancer in the offspring. Eur J Cancer Prev. 2006;15(1):20–26. doi: 10.1097/01.cej.0000186639.12249.c7. [DOI] [PubMed] [Google Scholar]
- 23.Lagiou P, Samoli E, Lagiou A, Hsieh C, Adami H, Trichopoulos D. Maternal height, pregnancy estriol and birth weight in reference to breast cancer risk in Boston and Shanghai. Int J Cancer. 2005;117(3):494–498. doi: 10.1002/ijc.21198. [DOI] [PubMed] [Google Scholar]
- 24.Nilsen TI, Romundstad PR, Troisi R, Vatten LJ. Birth size and subsequent risk for prostate cancer: a prospective population-based study in Norway. Int J Cancer. 2005;113(6):1002–1004. doi: 10.1002/ijc.20674. [DOI] [PubMed] [Google Scholar]
- 25.Hintz SR, Kendrick DE, Vohr BR, Kenneth Poole W, Higgins RD. For The Nichd Neonatal Research N: Gender differences in neurodevelopmental outcomes among extremely preterm, extremely-low-birthweight infants. Acta Paediatr. 2006;95(10):1239–1248. doi: 10.1080/08035250600599727. [DOI] [PubMed] [Google Scholar]
- 26.Jelliffe-Pawlowski LL, Hansen RL. Neurodevelopmental outcome at 8 months and 4 years among infants born full-term small-for-gestational-age. Journal of Perinatology. 2004;24(8):505–514. doi: 10.1038/sj.jp.7211111. [DOI] [PubMed] [Google Scholar]
- 27.Lahti J, Raikkonen K, Kajantie E, Heinonen K, Pesonen AK, Jarvenpaa AL, Strandberg T. Small body size at birth and behavioural symptoms of ADHD in children aged five to six years. J Child Psychol Psychiatry. 2006;47(11):1167–1174. doi: 10.1111/j.1469-7610.2006.01661.x. [DOI] [PubMed] [Google Scholar]
- 28.Pallotto EK, Kilbride HW. Perinatal outcome and later implications of intrauterine growth restriction. Clin Obstet Gynecol. 2006;49(2):257–269. doi: 10.1097/00003081-200606000-00008. [DOI] [PubMed] [Google Scholar]
- 29.Sampath V, Bowen J, Gibson F. Risk factors for adverse neurodevelopment in extremely low birth weight infants with normal neonatal cranial ultrasound. J Perinatol. 2005;25(3):210–215. doi: 10.1038/sj.jp.7211228. [DOI] [PubMed] [Google Scholar]
- 30.Seidman LJ, Buka SL, Goldstein JM, Horton NJ, Rieder RO, Tsuang MT. The relationship of prenatal and perinatal complications to cognitive functioning at age 7 in the New England Cohorts of the National Collaborative Perinatal Project. Schizophr Bull. 2000;26(2):309–321. doi: 10.1093/oxfordjournals.schbul.a033455. [DOI] [PubMed] [Google Scholar]
- 31.van Wassenaer A. Neurodevelopmental consequences of being born SGA. Pediatr Endocrinol Rev. 2005;2(3):372–377. [PubMed] [Google Scholar]
- 32.Cannon TD, Rosso IM, Hollister JM, Bearden CE, Sanchez LE, Hadley T. A prospective cohort study of genetic and perinatal influences in the etiology of schizophrenia. Schizophr Bull. 2000;26(2):351–366. doi: 10.1093/oxfordjournals.schbul.a033458. [DOI] [PubMed] [Google Scholar]
- 33.Eaton WW, Mortensen PB, Thomsen PH, Frydenberg M. Obstetric complications and risk for severe psychopathology in childhood. J Autism Dev Disord. 2001;31(3):279–285. doi: 10.1023/a:1010743203048. [DOI] [PubMed] [Google Scholar]
- 34.Gunnell D, Harrison G, Whitley E, Lewis G, Tynelius P, Rasmussen F. The association of fetal and childhood growth with risk of schizophrenia. Cohort study of 720,000 Swedish men and women. Schizophr Res. 2005;79(2-3):315–322. doi: 10.1016/j.schres.2005.07.022. [DOI] [PubMed] [Google Scholar]
- 35.Nilsson E, Stalberg G, Lichtenstein P, Cnattingius S, Olausson PO, Hultman CM. Fetal growth restriction and schizophrenia: a Swedish twin study. Twin Res Hum Genet. 2005;8(4):402–408. doi: 10.1375/1832427054936727. [DOI] [PubMed] [Google Scholar]
- 36.Willinger U, Heiden AM, Meszaros K, Formann AK, Aschauer HN. Neurodevelopmental schizophrenia: obstetric complications, birth weight, premorbid social withdrawal and learning disabilities. Neuropsychobiology. 2001;43(3):163–169. doi: 10.1159/000054885. [DOI] [PubMed] [Google Scholar]
- 37.Godfrey KM. Maternal regulation of fetal development and health in adult life. Eur J Obstet Gynecol Reprod Biol. 1998;78(2):141–150. doi: 10.1016/s0301-2115(98)00060-8. [DOI] [PubMed] [Google Scholar]
- 38.Jarvis S, Glinianaia SV, Blair E. Cerebral palsy and intrauterine growth. Clin Perinatol. 2006;33(2):285–300. doi: 10.1016/j.clp.2006.03.009. [DOI] [PubMed] [Google Scholar]
- 39.Luyckx VA, Brenner BM. Low birth weight, nephron number, and kidney disease. Kidney Int Suppl. 2005;(97):S68–77. doi: 10.1111/j.1523-1755.2005.09712.x. [DOI] [PubMed] [Google Scholar]
- 40.Sloboda DM, Challis JR, Moss TJ, Newnham JP. Synthetic glucocorticoids: antenatal administration and long-term implications. Curr Pharm Des. 2005;11(11):1459–1472. doi: 10.2174/1381612053507873. [DOI] [PubMed] [Google Scholar]
- 41.Cross JC. Placental function in development and disease. Reprod Fertil Dev. 2006;18(1-2):71–76. doi: 10.1071/rd05121. [DOI] [PubMed] [Google Scholar]
- 42.Fowden AL, Ward JW, Wooding FP, Forhead AJ, Constancia M. Programming placental nutrient transport capacity. J Physiol (Lond) 2006;572(Pt 1):5–15. doi: 10.1113/jphysiol.2005.104141. [DOI] [PMC free article] [PubMed] [Google Scholar]
- 43.Jansson T, Powell TL. IFPA 2005 Award in Placentology Lecture. Human placental transport in altered fetal growth: does the placenta function as a nutrient sensor? -- a review. Placenta. 2006;27(A):S91–97. doi: 10.1016/j.placenta.2005.11.010. [DOI] [PubMed] [Google Scholar]
- 44.Murphy VE, Smith R, Giles WB, Clifton VL. Endocrine regulation of human fetal growth: the role of the mother, placenta, and fetus. Endocr Rev. 2006;27(2):141–169. doi: 10.1210/er.2005-0011. [DOI] [PubMed] [Google Scholar]
- 45.Myatt L, Cui X. Oxidative stress in the placenta. Histochem Cell Biol. 2004;122(4):369–382. doi: 10.1007/s00418-004-0677-x. [DOI] [PubMed] [Google Scholar]
- 46.Sibley CP, Turner MA, Cetin I, Ayuk P, Boyd CA, D'Souza SW, Glazier JD, Greenwood SL, Jansson T, Powell T. Placental phenotypes of intrauterine growth. Pediatr Res. 2005;58(5):827–832. doi: 10.1203/01.PDR.0000181381.82856.23. [DOI] [PubMed] [Google Scholar]
- 47.Salafia CM, Zhang J, Miller RK, Charles AK, Shrout P, Sun W. Placental growth patterns affect birth weight for given placental weight. Birth Defects Res A Clin Mol Teratol. 2007;79(4):281–288. doi: 10.1002/bdra.20345. [DOI] [PubMed] [Google Scholar]
- 48.Boezen HM, Jansen DF, Postma DS. Sex and gender differences in lung development and their clinical significance. Clin Chest Med. 2004;25(2):237–245. doi: 10.1016/j.ccm.2004.01.012. [DOI] [PubMed] [Google Scholar]
- 49.Friedlander Y, Paltiel O, Deutsch L, Knaanie A, Massalha S, Tiram E, Harlap S. Birthweight and relationship with infant, child and adult mortality in the Jerusalem perinatal study. Paediatr Perinat Epidemiol. 2003;17(4):398–406. doi: 10.1046/j.1365-3016.2003.00522.x. [DOI] [PubMed] [Google Scholar]
- 50.Hoppe BL, Hermann DD. Sex differences in the causes and natural history of heart failure. Curr Cardiol Rep. 2003;5(3):193–199. doi: 10.1007/s11886-003-0048-6. [DOI] [PubMed] [Google Scholar]
- 51.Mustard CA, Etches J. Gender differences in socioeconomic inequality in mortality. J Epidemiol Community Health. 2003;57(12):974–980. doi: 10.1136/jech.57.12.974. [DOI] [PMC free article] [PubMed] [Google Scholar]
- 52.Newman AB, Brach JS. Gender gap in longevity and disability in older persons. Epidemiol Rev. 2001;23(2):343–350. doi: 10.1093/oxfordjournals.epirev.a000810. [DOI] [PubMed] [Google Scholar]
- 53.Wilkin TJ, Murphy MJ. The gender insulin hypothesis: why girls are born lighter than boys, and the implications for insulin resistance. Int J Obes (Lond) 2006;30(7):1056–1061. doi: 10.1038/sj.ijo.0803317. see comment. [DOI] [PubMed] [Google Scholar]
- 54.Kuh D, Hardy R. Life course approach to adult health. New York: Oxford; 2002. A life course approach to women's health. [Google Scholar]
- 55.Niswander KR, Gordon M. The women and their pregnancies. Washington, DC; USDHEW,PHS,NIH: 1972. [Google Scholar]
- 56.Clifton VL. Sexually dimorphic effects of maternal asthma during pregnancy on placental glucocorticoid metabolism and fetal growth. Cell Tissue Res. 2005;322(1):63–71. doi: 10.1007/s00441-005-1117-5. [DOI] [PubMed] [Google Scholar]
- 57.Hutchison JB, Beyer C, Hutchison RE, Wozniak A. Sex differences in the regulation of embryonic brain aromatase. J Steroid Biochem Mol Biol. 1997;61(3-6):315–322. doi: 10.1016/s0960-0760(97)80029-5. [DOI] [PubMed] [Google Scholar]
- 58.Torday JS, Nielsen HC. The sex difference in fetal lung surfactant production. Exp Lung Res. 1987;12(1):1–19. doi: 10.3109/01902148709068811. [DOI] [PubMed] [Google Scholar]
- 59.Mage DT, Donner EM. The fifty percent male excess of infant respiratory mortality. Acta Paediatr. 2004;93(9):1210–1215. see comment. [PubMed] [Google Scholar]
- 60.Mage DT, Donner M. A genetic basis for the sudden infant death syndrome sex ratio. Med Hypotheses. 1997;48(2):137–142. doi: 10.1016/s0306-9877(97)90280-2. [DOI] [PubMed] [Google Scholar]
- 61.Mage DT, Donner M. Female resistance to hypoxia: does it explain the sex difference in mortality rates? J Womens Health (Larchmt) 2006;15(6):786–794. doi: 10.1089/jwh.2006.15.786. [DOI] [PubMed] [Google Scholar]
- 62.Yang K, Julan L, Rubio F, Sharma A, Guan H. Cadmium reduces 11 beta-hydroxysteroid dehydrogenase type 2 activity and expression in human placental trophoblast cells. Am J Physiol Endocrinol Metab. 2006;290(1):E135–E142. doi: 10.1152/ajpendo.00356.2005. [DOI] [PubMed] [Google Scholar]
- 63.Salafia CM, Zhang J, Miller RK, Charles AK, Shrout P, Sun W. Placental growth patterns affect birth weight for given placental weight. Birth Defects Res Part A Clin Mol Teratol. 2007;79(4):281–288. doi: 10.1002/bdra.20345. [DOI] [PubMed] [Google Scholar]
- 64.Gilboa SM, Correa A, Alverson CJ. Use of spline regression in an analysis of maternal prepregnancy body mass index and adverse birth outcomes: does it tell us more than we already know? Ann Epidemiol. 2008;18(3):196–205. doi: 10.1016/j.annepidem.2007.09.005. [DOI] [PubMed] [Google Scholar]
- 65.Friedman JH, Roosen CB. An introduction to multivariate adaptive regression splines. Stat Methods Med Res. 1995;4(3):197–217. doi: 10.1177/096228029500400303. [DOI] [PubMed] [Google Scholar]
- 66.York TP, Eaves LJ, van den Oord EJ. Multivariate adaptive regression splines: a powerful method for detecting disease-risk relationship differences among subgroups. Stat Med. 2006;25(8):1355–1367. doi: 10.1002/sim.2292. [DOI] [PubMed] [Google Scholar]
- 67.De Veaux R, Psichogios D, Ungar L. A comparison of two nonparametric estimation schemes: MARS and neural networks. Computers and Chemical Engineering. 1993;17(8):818–837. [Google Scholar]
- 68.Hastie T, Tibshirani R, Freidman J. The Elements of Statistical Learning, Datamining, Inference, and Prediction. New York: Springer; 2001. [Google Scholar]
- 69.Salafia CM, Zhang J, Charles AK, Bresnahan M, Shrout P, Sun W, Maas EM. Placental characteristics and birthweight. Paediatric and Perinatal Epidemiology. 2008;22(3):229–239. doi: 10.1111/j.1365-3016.2008.00935.x. [DOI] [PubMed] [Google Scholar]
Associated Data
This section collects any data citations, data availability statements, or supplementary materials included in this article.


