
Figure 2.
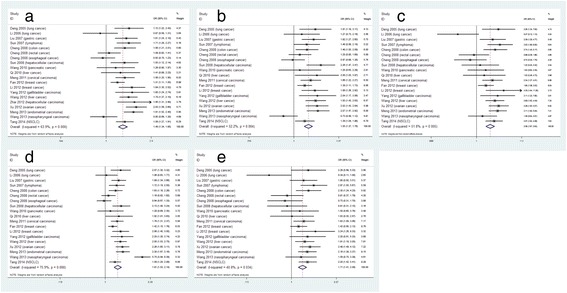
The pooled Ors and 95%CIs for the relationship between LAPTM4B polymorphism and cancer susceptibility. The forest plot for relationship between LAPTM4B polymorphism and cancer susceptibility for *2 vs *1 (a), *1/2 vs *1/1 (b), *2/2 vs *1/1 (c), *1/2 + *2/2 vs *1/1 (d), *2/2 vs *1/2 + *1/1 (e).