Abstract
Time-of-flight secondary ion mass spectrometry (ToF-SIMS) is an important technique for studying chemical composition of micrometer scale objects due to its high spatial resolution imaging capabilities and chemical specificity. In this work we focus on the application of ToF-SIMS to gain insight into the chemistry of micrometer size liposomes as a potential model for neurotransmitter vesicles. Two models of giant liposomes were analyzed: histamine and aqueous two phase system (ATPS)-containing liposomes. Characterization of the internal structure of single fixed liposomes was done both with the Bi3+ and C60+ ion sources. The depth profiling capability of ToF-SIMS was used to investigate the liposome interior.
Keywords: liposome, aqueous two phase system, histamine, ToF-SIMS, depth profile analysis, imaging
Introduction
Liposomes are phospholipid bilayer vesicles, which resemble cellular organelles. Due to their biodegradable and biocompatible nature, they have found applications in a wide range of fields such as drug delivery, gene therapy, cosmetics and food technology.[1–3]
ToF-SIMS is a prominent analytical technique to study the chemistry in a vast spectrum of biological samples such as tissues,[4–6] cells,[7,8] sub-cellular compartments,[9] as well as organisms,[10,11] pharmacological systems,[12] drug delivery,[13] and metabolite pathways.[14] The capability for three-dimensional imaging of organics is achieved by employing cluster ion sources such as C60[15] and gas cluster ion beams.[16–18]
In this paper, we have investigated the interior of liposomes as a model system for carriers of variety of chemicals.[1–3, 19] Two separate systems have been employed: (1) histamine encapsulating liposomes[19,20] representing one compartment and (2) liposomes containing an aqueous two phase system (ATPS) composed of dextran and poly (ethylene glycol)[21] as a two compartment liposome model. Mass spectrometric imaging and depth profiling was done with single beam C60+ on a J105 – 3D Chemical Imager[7] and in dual beam mode using C603+ for etching and Bi3+ for analysis on a TOF.SIMS V instrument. The former instrument allowed us to analyze the histamine peak relative to silicon, whereas the latter one allowed us to acquire high spatial resolution images of lipid membrane and poly (ethylene glycol) in the liposome model.
Experimental
Materials
1.2-dipalmytoil-sn-glycero-3-phosphocholine (DPPC), cholesterol (ovine wool), L-α-phosphatidylcholine (Soy PC), 1.2-dipalmitoyl-sn-glycero-3-phospho-(1′-rac-glycerol) (sodium salt) (DPPG) and Avanti Mini-Extruder were purchased from Avanti Polar Lipids, Alabama. Histamine dihydrochloride, poly (ethylene glycol) (PEG, MW 8000), dextran (from Leuconostoc spp. MW 450000-600000) were obtained from Sigma-Aldrich, Sweden. Whatman nucleopore track-etched polycarbonate membranes, pore size 5 μm and Thermo Scientific Slide-A-Lyzer Dialysis Cassettes (10K MWCO) were purchased from Fisher Scientific, Sweden.
Sample preparation
One compartment liposome model (histamine-containing giant liposomes)[19] A chloroform solution of lipids containing a 9:1 molar ratio of DPPC to cholesterol, total lipid at 12.3 mg/mL, was vacuum desiccated for 2 h. The lipid cake was rehydrated with 5 mL 0.5 M histamine dihydrochloride solution for 30 min at room temperature. Liposomes were then exposed to five freeze-thaw cycles in a freezer (−80 °C) and warm water bath. The liposomal suspension was extruded over the polycarbonate membrane 21 times at 70°C. Excess histamine dihydrochloride was excluded by dialysis with MQ water for 2 h. The liposome suspension was then diluted 2-fold with MQ water, placed onto a clean silicon wafer and dried under atmospheric pressure at room temperature. The liposomes were visualized under transmitted light using differential interference contrast (DIC) microscopy with an Olympus IX-71 microscope showing they had diameters between 3 and 5μm.
Two-compartment liposome model (ATPS-containing giant liposomes)[21] were prepared by mixing Soy PC and DPPG at molar ratio 9:1 (5 mg/mL; total lipids). The lipid mixture was evaporated for 3 h under vacuum before hydration for 12 h at 40°C with 2 mL 4 % PEG/4 % dextran. The liposome suspension was phase separated at 4 °C and liposomes were collected through the PEG-enriched phase from the interface of two phase separated polymers (Fig. 3(b)). Liposome size was determined visually (10–30 μm in diameter). Sample freezing and freeze-fracturing was done as previously described.[22]
Figure 3.
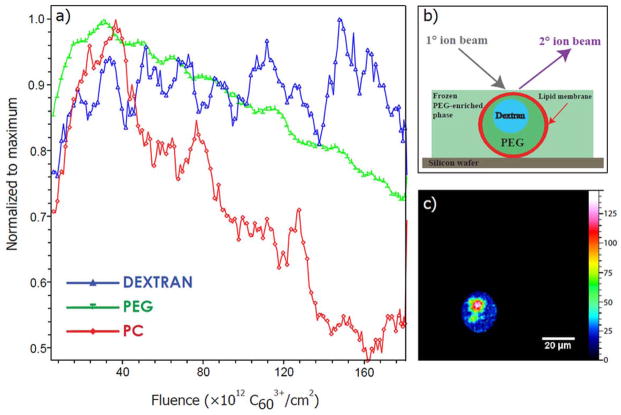
Depth profile of two-compartment liposome model across the ATPS containing giant liposome. a) ToF-SIMS sputter depth profile acquired with the TOF.SIMS V. Acquisition time: 97.16 s; fluence: 3.33 × 10¹³ Bi3+/cm2; FoV (Bi3+): 105 × 105 μm2; FoV (C603+): 200 × 200 μm2. b) Schematic of liposome embedded in frozen PEG-enriched phase. c) Depth profile was reconstructed from the specific region of interest.
TOF-SIMS analysis
ToF-SIMS analysis was performed on a TOF.SIMS V instrument (ION-TOF GmbH, Germany) and a J105 - 3D Chemical Imager (Ionoptika Ltd, UK).
TOF.SIMS V analysis
A Binq+ LMIG was employed for imaging and a C60q+ ion source for sample sputtering. Data were recorded in positive ion mode with extraction voltage 2000 V and charge compensation was performed by flooding with low energy electrons. Spectra were acquired using Bi3+ primary ions (25 keV) in burst alignment imaging mode[23] with a 100 ns primary ion beam pulse width. Depth profile analysis was done in burst alignment mode[23] with Bi3+ primary ions (pulsed current measurement with current value of 0.25 pA) for imaging and C603+i n d.c. mode (30 keV, current 0.2 nA) for sputtering.
J105 - 3D Chemical Imager analysis
A 40 keV C60+ primary ion beam in the positive ion mode was used. The instrument employs a quasi-continuous primary ion beam to produce a stream of secondary ions. The secondary ions are compressed using a linear buncher to produce a tight packet of ions at the entrance to a quadratic field reflectron. The mass resolution is dependent on the tuning of the buncher and not the ion formation process. An extraction voltage of 1000 V, over an extraction gap of approximately 7 mm, was used. Electron flooding was not employed.
Results and discussion
In order to establish the most suitable methodology for mass spectrometric imaging of the liposomal interior, two different samples were prepared and analyzed by ToF-SIMS.
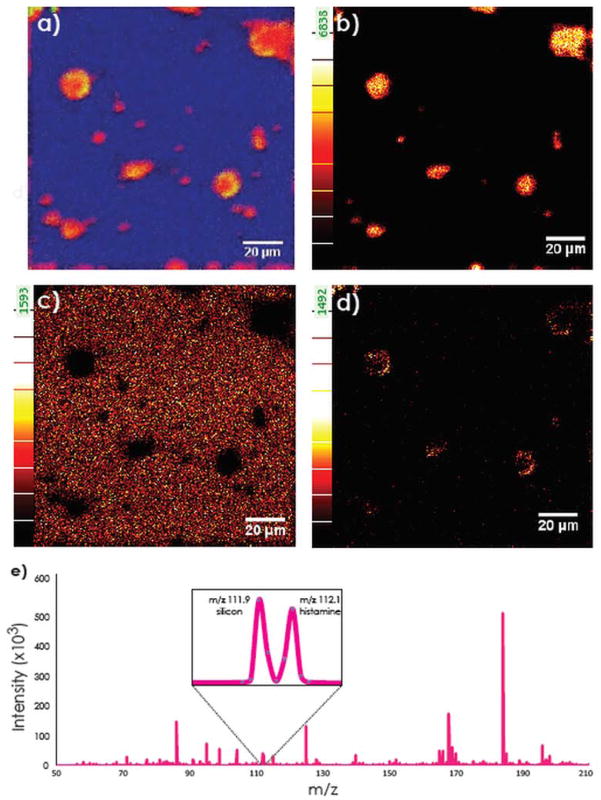
Histamine-encapsulated giant liposomes were designed as our first liposome model to allow imaging of the chemical messenger, histamine, inside an individual liposome with the J105. For experimental simplicity, we have studied dry liposomes at room temperature. Figures 1(a–d) represent molecular chemical maps of dry liposomes acquired by analyzing whole liposomes. A series of images (layers) were acquired with the spectral dose density of 2.42 × 10¹³ ions-cm−2/layer. The total dose density to completely remove the liposome was 1.21 × 10¹⁴ ions-cm−2 (5 layers). The lipid head group, phosphatidylcholine (PC) with m/z 184, is observed showing the lipid membrane and the histamine fragment with m/z 112.1 inside the liposome which is shown clearly as a color overlay (Fig. 1(a)). This evidence suggests that it is possible to image liposomal content. A typical mass spectrum for the dry histamine-filled liposomes is reported in Fig. 1(e). At the nominal mass m/z 112 there are two different peaks which, when imaged, localize at two different locations (Fig. 1(c,d)). From the calculation of exact masses, the inorganic peak m/z 111.9 is assigned to the silicon (Fig. 1(c)), which is present as the substrate around the liposomes, whereas the peak at m/z 112.1 is localized in the liposomes and represents the histamine fragment (Fig. 1(d)). Thus, the mass spectrum with two well-resolved masses 0.2 amu apart, allows us to state that we are able to image this type of sample with good mass and spatial resolution.
Figure 1.
One compartment liposome model (histamine-containing giant liposomes) imaged with a J105 -3D Chemical Imager. Data shown are from the second layer of analysis after the first image acquisition removed the surface of the sample exposing the liposome interior. Acquisition time: 22 min/layer; pixel resolution of 500 nm/pixel, analysis area: 130 × 130 μm2; 256 × 256 pixel images were acquired with a primary ion dose density of 2.42 × 10¹³ ions-cm−2/layer. a) An overlay of PC (m/z 184.1, red), silicon (m/z 111.9, blue) and histamine (m/z 112.1, green). b) Ion image of PC at m/z 184.1. c) Ion image of silicon at m/z 111.9. d) Ion image of histamine at m/z 112.1. e) Mass spectrum from image showing the two peaks at m/z 112.
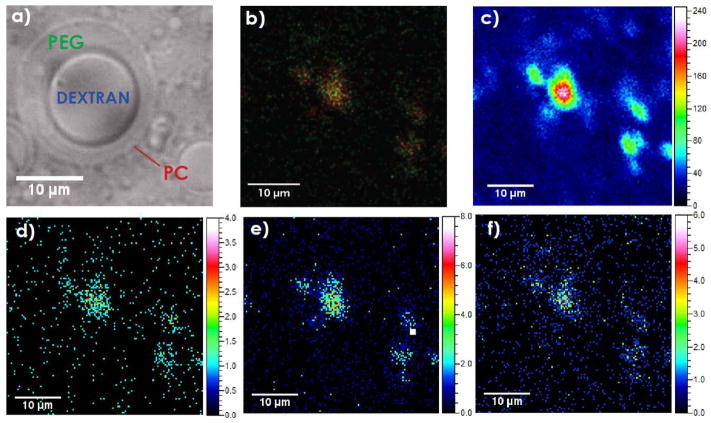
We next introduced a more complex two compartment liposomal sample containing an internal morphology. For this purpose, liposomes containing an ATPS made of PEG and dextran polymers have been used. Figure 2(a) shows the DIC image of such a liposome where polymer phases are distinguishable. The dextran-rich phase located in the center of the liposome appears to project out of the image plane due to higher concentration of optically active dextran. Further, the sample was freeze-fractured to provide a frozen-hydrated state in order to avoid redistribution of the lipid membrane and other components.[24] The mass spectrometric images were acquired with the TOF.SIMS V with accumulated dose density of 3.21 × 10¹³ Bi3+/cm2. Based on ToF-SIMS analysis of polymer standards, it was determined that the most abundant fragments for PEG were fragments with m/z 45 and m/z 87 while the most intense dextran fragment was m/z 127. The assigned fragments for PC were m/z 86 and 184. The ion images of the PC and PEG fragments are shown in figures 2(d–f) and a color overlay of m/z 86 and 87 fragments in figure 2(b). A morphological pattern similar to that shown in a DIC microscopic image of a similar ATPS containing liposome (Fig. 2(a)) is also observed in the ion images (Fig. 2(b–f)). Both PC ion fragments (m/z 86 and 184) originate from the lipid membrane. In biological systems, only fragment m/z 224.1 is specific for PC and is distinguishable from sphingomyelin.[4] In our model system the assigned fragments for PC, m/z 86 and m/z 184, were used to determine lipid membrane, as in the liposome preparation we do not employ sphingomyelin, and we are interested in the liposomal content. To apply SIMS imaging to probe the membranes of neurotransmitter vesicles, only fragment m/z 224.1 is truly specific for PC. Signal originating from PEG with m/z 87 is more intense in the central part of the imaged feature (Fig. 2 (f) and SI1 (supporting information)) suggesting that PEG was localized in a specific portion of the liposome interior. Comparison to the total ion signal indicates that this localization is due to chemical changes and not the morphology of the vesicle. Furthermore, the freeze-fractured frozen-hydrated ATPS liposome was depth profiled using the TOF.SIMS V where analysis was performed using Bi3+ and for etching were used C603+ ions. Several characteristic fragments were monitored while sputtering through the sample (dextran m/z 127, PEG m/z 45 and PC m/z 184). Figure 3 shows the depth profiling data across the entire liposome and a few features are noteworthy. Considering the accumulated etch dose density of 1.87 ×10¹⁴ ions-cm−2, sample nature, and C603+ organic depth profiling data obtained by Shard et al.,[25] it is estimated that the erosion depth was approximately 350 nm. According to the previously reported studies, the lipid bilayer thickness is approximated to be 5 nm.[26,27] Our depth profiling data (Fig. 3(a)) shows that PEG signal has the highest intensity in the beginning of profile acquisition showing that liposomes were embedded in the PEG-enriched environment. Further, a sharp rise in the signal for the PC fragment at m/z 184 showed the location of the lipid membrane and a rise in the m/z 45 peak was related to the PEG phase within liposome, continued etching then revealed the dextran core. These data suggest that the etching occurred in the fraction of liposomal volume where the dextran core is close to the lipid membrane (Fig. 2(a) and 3(b)). Thus, depth profiling allowed us to probe into a liposome and to determine the lateral morphology of the liposome interior with chemical specificity.
Figure 2.
Two compartment liposome model (ATPS-containing giant liposome) imaged with a) DIC, and b)–f) the TOF.SIMS V. Acquisition time: 360.45 s; FoV: 42 × 42 μm2, pixel resolution: 195 nm/pixel. Detail: b) An overlay of PC (m/z 86, red) and PEG (m/z 87, green). c) Total ion image. d) Ion image of PC at m/z 184. e) Ion image of PC at m/z 86. f) Ion image of PEG at m/z 87. All images are binned (4 pixels).
Conclusion
We have shown that the ToF-SIMS technique is capable of generating 2D images and depth profiles of the inner morphology of micrometer-sized liposomes allowing us to determine the microcompartmentation. Acquisition of 2D images of one compartment liposome model demonstrate that we can laterally probe the interior composition of the liposome, whereas the experiments to depth profile the more complex two compartment liposomes show that we can distinguish internal morphology. Therefore we suggest the application of ToF-SIMS for imaging the compartments inside liposomal models and our future work will focus on imaging the distribution patterns of neurotransmitters in and laterally across cellular vesicles with ToF-SIMS.
Supplementary Material
Acknowledgments
This research was funded by the Joint Chalmers-GU Centre for Bioanalytical Chemistry, the Swedish Research Council (VR), European Research Council (ECR), Wallenberg Foundation, and the USA National Institutes of Health (NIH). The SIMS experiments were conducted at the National Centre for Imaging Mass Spectrometry (NCIMS). The authors kindly acknowledge Masoumeh Dowlatshahipour for providing a help in sample preparation.
References
- 1.Mozafari MR. Methods Mol Biol. 2010;605:29. doi: 10.1007/978-1-60327-360-2_2. [DOI] [PubMed] [Google Scholar]
- 2.Moscho A, Orwar O, Chiu DT, Modi BP, Zare RN. Proc Natl Acad Sci U S A. 1996;93:11443. doi: 10.1073/pnas.93.21.11443. [DOI] [PMC free article] [PubMed] [Google Scholar]
- 3.Lian T, Ho RJY. J Pharm Sci. 2001;90:667. doi: 10.1002/jps.1023. [DOI] [PubMed] [Google Scholar]
- 4.Tahallah N, Brunelle A, De La Porte S, Laprévote O. J Lipid Res. 2008;49:438. doi: 10.1194/jlr.M700421-JLR200. [DOI] [PMC free article] [PubMed] [Google Scholar]
- 5.Ayciriex S, Touboul D, Brunelle A, Laprevote O. Clin Lipidol. 2011;6:437. [Google Scholar]
- 6.Debois D, Brunelle A, Laprevote O. Int J Mass Spectrom. 2007;260:115. [Google Scholar]
- 7.Fletcher JS, Vickerman JC. Anal Chem. 2013;85:610. doi: 10.1021/ac303088m. [DOI] [PubMed] [Google Scholar]
- 8.Monroe EB, Jurchen JC, Lee J, Rubakhin SS, Sweedler JV. J Am Chem Soc. 2005;127:12152. doi: 10.1021/ja051223y. [DOI] [PubMed] [Google Scholar]
- 9.Rabbani S, Fletcher JS, Lockyer NP, Vickerman JC. Surf Interface Anal. 2011;43:380. [Google Scholar]
- 10.Ostrowski SG, Van Bell CT, Winograd N, Ewing AG. Science. 2004;305:71. doi: 10.1126/science.1099791. [DOI] [PMC free article] [PubMed] [Google Scholar]
- 11.Kurczy ME, Piehowski PD, Van Bell CT, Heien ML, Winograd N, Ewing AG. Proc Natl Acad Sci U S A. 2010;107:2751. doi: 10.1073/pnas.0908101107. [DOI] [PMC free article] [PubMed] [Google Scholar]
- 12.Dollery CT. Clin Pharmacol Ther (N Y, NY, U S) 2013;93:263. doi: 10.1038/clpt.2012.240. [DOI] [PubMed] [Google Scholar]
- 13.Fragu P, Kahn E. Microsc Res Tech. 1997;36:296. doi: 10.1002/(SICI)1097-0029(19970215)36:4<296::AID-JEMT7>3.0.CO;2-K. [DOI] [PubMed] [Google Scholar]
- 14.Malmberg P, Jennische E, Nilsson D, Nygren H. Anal Bioanal Chem. 2011;399:2711. doi: 10.1007/s00216-010-4155-0. [DOI] [PubMed] [Google Scholar]
- 15.Weibel D, Wong S, Lockyer N, Blenkinsopp P, Hill R, Vickerman JC. Anal Chem. 2003;75:1754. doi: 10.1021/ac026338o. [DOI] [PubMed] [Google Scholar]
- 16.Yamamoto Y, Ichiki K, Ninomiya S, Seki T, Aoki T, Matsuo J. In: Ion Implantation Technology 2010. Matsuo J, Kase M, Aoki T, Seki T, editors. Amer Inst Physics; New York: 2010. pp. 298–301. [Google Scholar]
- 17.Aoki T, Matsuo J, Takaoka G. Nucl Instrum Methods Phys Res B. 2003;202:278. [Google Scholar]
- 18.Lee JLS, Ninomiya S, Matsuo J, Gilmore IS, Seah MP, Shard AG. Anal Chem. 2010;82:98. doi: 10.1021/ac901045q. [DOI] [PubMed] [Google Scholar]
- 19.Omiatek DM, Santillo MF, Heien ML, Ewing AG. Anal Chem. 2009;81:2294. doi: 10.1021/ac802466g. [DOI] [PMC free article] [PubMed] [Google Scholar]
- 20.Gunnarsson A, Kollmer F, Sohn S, Hook F, Sjovall P. Anal Chem. 2010;82:2426. doi: 10.1021/ac902744u. [DOI] [PubMed] [Google Scholar]
- 21.Long MS, Jones CD, Helfrich MR, Mangeney-Slavin LK, Keating CD. Proc Natl Acad Sci U S A. 2005;102:5920. doi: 10.1073/pnas.0409333102. [DOI] [PMC free article] [PubMed] [Google Scholar]
- 22.Lanekoff I, Kurczy ME, Hill R, Fletcher JS, Vickerman JC, Winograd N, Sjovall P, Ewing AG. Anal Chem. 2010;82:6652. doi: 10.1021/ac101243b. [DOI] [PMC free article] [PubMed] [Google Scholar]
- 23.Sodhi RNS. Analyst (Cambridge, U K )sw. 2004;129:483. doi: 10.1039/b402607c. [DOI] [PubMed] [Google Scholar]
- 24.Fletcher JS, Rabbani S, Henderson A, Lockyer NP, Vickerman JC. Rapid Commun Mass Spectrom. 2011;25:925. doi: 10.1002/rcm.4944. [DOI] [PubMed] [Google Scholar]
- 25.Shard AG, Green FM, Brewer PJ, Seah MP, Gilmore IS. J Phys Chem B. 2008;112:2596. doi: 10.1021/jp077325n. [DOI] [PubMed] [Google Scholar]
- 26.Hotani H, Nomura F, Suzuki Y. Curr Opin Colloid Interface Sci. 1999;4:358. [Google Scholar]
- 27.Nasedkin A, Davidsson J, Kumpugdee-Vollrath M. J Synchrotron Radiat. 2013;20:721. doi: 10.1107/S0909049513020074. [DOI] [PubMed] [Google Scholar]
Associated Data
This section collects any data citations, data availability statements, or supplementary materials included in this article.


