

Abstract
Species in the genus Plasmodium cause malaria in humans and infect a variety of mammals and other vertebrates. Currently, estimated ages for several mammalian Plasmodium parasites differ by as much as one order of magnitude, an inaccuracy that frustrates reliable estimation of evolutionary rates of disease-related traits. We developed a novel statistical approach to dating the relative age of evolutionary lineages, based on Total Least Squares regression. We validated this lineage dating approach by applying it to the genus Drosophila. Using data from the Drosophila 12 Genomes project, our approach accurately reconstructs the age of well-established Drosophila clades, including the speciation event that led to the subgenera Drosophila and Sophophora, and age of the melanogaster species subgroup. We applied this approach to hundreds of loci from seven mammalian Plasmodium species. We demonstrate the existence of a molecular clock specific to individual Plasmodium proteins, and estimate the relative age of mammalian-infecting Plasmodium. These analyses indicate that: 1) the split between the human parasite Plasmodium vivax and P. knowlesi, from Old World monkeys, occurred 6.1 times earlier than that between P. falciparum and P. reichenowi, parasites of humans and chimpanzees, respectively; and 2) mammalian Plasmodium parasites originated 22 times earlier than the split between P. falciparum and P. reichenowi. Calibrating the absolute divergence times for Plasmodium with eukaryotic substitution rates, we show that the split between P. falciparum and P. reichenowi occurred 3.0–5.5 Ma, and that mammalian Plasmodium parasites originated over 64 Ma. Our results indicate that mammalian-infecting Plasmodium evolved contemporaneously with their hosts, with little evidence for parasite host-switching on an evolutionary scale, and provide a solid timeframe within which to place the evolution of new Plasmodium species.
Keywords: Plasmodium, molecular clock, speciation dates, total least squares, regression, malaria, Drosophila
Introduction
Malaria remains a leading cause of morbidity and mortality from infectious disease (Honey 2009), with over 200 million new cases and more than half a million deaths annually, despite increased efforts to control and eradicate the disease (World Health Organization 2009). The age of Plasmodium species informs our understanding of malaria transmission and, in particular, the likelihood of zoonosis. However, the timing of the divergence of these species from their close relatives remains highly controversial (Hayakawa et al. 2008; Rich et al. 2009; Hughes and Verra 2010; Ricklefs and Outlaw 2010; Tanabe et al. 2010; Silva et al. 2011). Estimates of the age of the split between Plasmodium falciparum and P. reichenowi (the latter a chimpanzee parasite) range from 5 to 7 Ma (Escalante et al. 1995; Hughes and Verra 2010; Silva et al. 2011), the estimated age of the split between their mammalian hosts (Steiper and Young 2006; Yang and Rannala 2006; Hobolth et al. 2007), to as recently as 10,000 years ago (Rich et al. 2009). The divergence between P. vivax and the Old World monkey parasite P. knowlesi has been estimated to date from 20 to 30 Ma (Escalante et al. 1995; Silva et al. 2011) to as recently as 2–3 Ma (Escalante et al. 1998). Likewise, the origin of the Plasmodium clade that parasitizes mammals, originally believed to date back ≥100 My (Escalante and Ayala 1995; Escalante et al. 1995), has also been placed within the last 13 My (Ricklefs and Outlaw 2010). The corresponding studies obtained their age estimates by converting genetic polymorphism or divergence into time, on the specific assumption of the coevolution of a host–parasite species pair, or of a substitution rate. They shared a major weakness in relying on a small number of loci, whose polymorphism and divergence might not be representative of the entire genome. The availability of complete or high quality (HQ) draft genomes from several mammalian malaria parasites overcomes this weakness. These species include the primate parasites P. falciparum, P. vivax, P. reichenowi, and P. knowlesi (Gardner et al. 2002; Jeffares et al. 2007; Carlton et al. 2008; Pain et al. 2008), and the three rodent parasites P. yoelii, P. chabaudi, and P. berghei (Carlton et al. 2002; Hall et al. 2005).
Here, our aim is to use genome-wide protein sequence divergence estimates to establish relative ages for specific speciation events occurring in the history of mammalian Plasmodium. Our basic premise is that if Plasmodium nuclear proteins evolve according to individual molecular clocks (Zuckerkandl and Pauling 1965; Kimura 1968), then sequence divergence in different proteins is correlated across independent Plasmodium lineages and, consequently, the regression slope of the divergence between the proteins in two lineages reflects the relative age of those lineages (fig. 1). We use Plasmodium genome sequences and the respective genome annotations to derive groups of orthologous single-copy genes across the seven species described above, and to obtain reliable estimates of divergence between protein sequences. In our statistical model, the clock for each protein has a specific rate, faster or slower, depending on the protein’s functional and structural constraints (Bromham and Penny 2003). To investigate the existence of a molecular clock in Plasmodium, the model derives regressions and -statistics from the data, to quantify the relative rate of evolution of different proteins and determine whether the relative rates remain constant across lineages.
Fig. 1.

Estimation of relative divergence times between lineages. (a) Example of three independent lineages for which amino acid divergences can be compared: lineage between taxa 1 and 7, lineage between taxa 3 and 4, and lineage between taxa 5 and 6; most recent common ancestor (MRCA) of each taxon pair at nodes I, II, and III, respectively. (b) Hypothetical relationship between protein sequence divergence (dAA) observed in lineages with MRCA at nodes I and II, in the presence of a protein molecular clock. Each point represents a protein present in all four taxa, with the x and y coordinates representing the amino acid divergence between taxa 1 and 7 and between taxa 3 and 4, respectively. The slope of the regression equals the ratio of the age of node I to the age of node II. (c) Hypothetical relationship between amino acid divergence observed in lineages I and II if the relative rate of protein evolution is not constant across lineages. The success of our approach relies on the existence of a protein-specific molecular clock, in which fast-evolving proteins in one lineage evolve rapidly in all other lineages and, similarly, slowly evolving proteins change comparatively little in all lineages.
We demonstrate that the evolution of proteins encoded by single-copy genes in Plasmodium conforms remarkably well to a simple molecular clock model, permitting us to establish relative ages for speciation events among mammalian Plasmodium species accordingly. Finally, we convert relative ages to absolute divergence times using a range of evolution rates observed in other eukaryotic taxa.
Results
Amino Acid Divergences
We obtained estimates of amino acid sequence divergence, dAA, between five pairs of species (fig. 2), and the data are summarized in table 1. For each species pair, several hundreds to a few thousand proteins were compared. The size of the data set for each species pair mostly depended on the degree of completion of the published genome assemblies (Materials and Methods). Hence, comparisons between species with nearly closed genome assemblies, such as P. vivax and P. knowlesi, resulted in larger data sets than comparisons involving draft genomes, in particular those with low sequence coverage, such as P. reichenowi. For each species pair the range of amino acid sequence divergence spanned several orders of magnitude, as would be expected for a diverse set of proteins exposed to a wide variety of selective constraints imposed by both structure and function. If Plasmodium proteins evolve according to a protein molecular clock, then the most conserved proteins in one lineage will also be conserved in other lineages and, conversely, rapidly evolving proteins will diverge rapidly in all lineages.
Fig. 2.
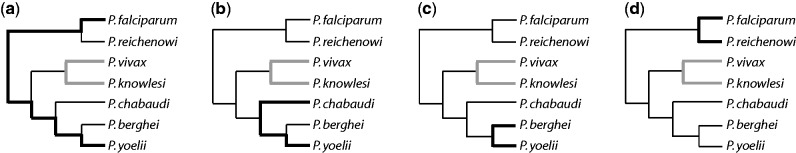
Four lineage comparisons. Amino acid sequence divergence between P. vivax and P. knowlesi (thick gray) was compared with that observed for four other Plasmodium species pairs (thick black): (a) P. falciparum and P. yoelii; (b) P. yoelii and P. chabaudi; (c) P. yoelii and P. berghei; (d) P. falciparum and P. reichenowi. The species pair Pv–Pk is monophyletic relative to the other taxa. Therefore, the lineage defined by the tree-path from Pv to Pk is independent from those defined by any pairwise combination of the other species.
Table 1.
Protein Sequence Divergence Estimates.
| Pairwise Comparisons | Ga | Median dAA (Minimum–Maximum) |
|---|---|---|
| P. vivax–P. knowlesi | 2,820 | 0.179 (0.00001–2.62) |
| P. falciparum–P. reichenowi | 445 | 0.017 (0.00001–0.23) |
| P. yoelii–P. berghei | 761 | 0.053 (0.00001–4.04) |
| P. yoelii–P. chabaudi | 420 | 0.100 (0.00001–3.90) |
| P. falciparum–P. yoelii | 1,560 | 0.461 (0.00001–3.46) |
aNumber of single-copy protein-coding genes in each pairwise comparison that satisfy the conditions that define HQ data sets (Materials and Methods).
The Molecular Clock Model
To test the existence of protein-specific molecular clocks, we use the following model: let and be any four malarial species. Consider only species pairs and that lie on nonoverlapping tree-paths (i.e., separate branches) of the corresponding phylogenetic tree (fig. 1). The model assumes that each gene common to the four malarial species has its own characteristic rate of amino acid substitution , so that given the evolutionary time for divergence between the species and , the amino acid sequence distance between the species and within the gene (specified below) satisfies
| (1) |
that is, the amino acid sequence distance for a protein between two species is proportional to the species’ divergence time and the amino acid substitution rate of the protein. Because similar considerations apply to and ,
| (2) |
Denote the final ratio by a quantity reflecting the divergence time between in units of the divergence time between . If our premise that a molecular clock exists is true, protein divergence in the two species pairs should be correlated, that is,
| (3) |
Accordingly, we compared the divergence in proteins encoded by single-copy genes between P. vivax and P. knowlesi to protein divergence in four other Plasmodium species pairs (fig. 2; supplementary table S1, Supplementary Material online). Our pairwise approach overcomes problems posed by large differences in nucleotide composition between Plasmodium genomes and by incomplete genomes in some species. In particular, P. vivax and P. knowlesi have relatively high genomic GC content (>37% GC) compared with all other species in this study (<23% GC). Moreover, while species with completed genomes (e.g., P. vivax, P. knowlesi, or P. falciparum) have the full complement of greater than 5,000 protein-coding genes available, species with draft genomes (e.g., P. reichenowi) have only a small fraction (Materials and Methods). A pairwise approach allows individual data sets to include genes not shared by all species in our study. The divergence between species pairs was compared using total least squares (TLS) regressions. TLS has an important advantage over Least Squares in that it takes into account the error associated with all regression variables, so it downweights points with large uncertainties in their x or y coordinates (Materials and Methods).
The model described above provides an excellent fit to the data. An -statistic gave the fraction of the variation between lineages explained by pairwise correlations. The four data sets yielded values of from 47% to 83% (fig 3; Materials and Methods). The difference in magnitude of between the four analyses depended largely on the divergence between the species pairs shown on the x axis (note that the species pair in the y axis is the same for all analyses). In particular, larger median values of dAA of the species pair on the x axis corresponded to larger R2 values for the correlation (table 1 and fig. 3). At least three phenomena (and possibly all three together) explain these results. First, the stochastic variation in dAA is relatively large for closely related species (being by rule of thumb roughly proportional to the square root of dAA). Second, speciation events are often associated with population bottlenecks (Nei 1987; Hughes 2008), which lead to relatively high frequency of slightly deleterious substitutions. Finally, our methods detect most genes at small evolutionary distances, even those that are becoming pseudogenes, or evolving under diversifying selection, in one of the species. As genes accumulate indels, missense, and nonsense mutations our “HQ” data sets (Materials and Methods) fail to capture them.
Fig. 3.

Relationship of amino acid sequence divergence between independent Plasmodium lineages. In each plot, each point represents a protein present in the four taxa compared. The TLS regression fit (solid line) and 95% confidence intervals (dotted lines) are shown; the slope of the line, α, equals the ratio between the divergence time of each of four species pairs represented in the x axis relative to that of P. vivax–P. knowlesi (fig. 2). Sequence divergence between P. vivax and P. knowlesi is compared with that between (a) P. falciparum and P. yoelii ( = 1018; α = 0.285 ± 0.0027; R2 = 0.83); (b) P. yoelii and P. chabaudi ( = 280; α = 1.37 ± 0.035; R2 = 0.73); (c) P. yoelii and P. berghei ( = 497; α = 2.64 ± 0.047; R2 = 0.66); (d) P. falciparum and P. reichenowi ( = 280; α = 6.13 ± 0.163; R2 = 0.47). Proteins with a slow or a fast clock are located near and far from the origin, respectively.
The large values conclusively show that the relative rate of evolution of single-copy genes has remained remarkably constant across independent Plasmodium lineages, a necessary condition for the existence of protein-specific molecular clocks. Our pairwise approach does not test whether the overall rate of evolution is unvarying between lineages, the other requirement of a protein-specific clock. However, similar values of dN/dS, the ratio of nonsynonymous to synonymous substitution rates, in different Plasmodium lineages strongly suggests a constant evolution rate across the genus (Silva et al. 2011). Remarkably, the protein-specific clock applies over a wide range in evolutionary rates (fig. 3), a result crucial for phylogenetic studies across a range of divergence times (Bromham and Penny 2003). For each protein, the regression residual measures the protein’s conformity to a clock (supplementary table S1, Supplementary Material online).
Many Plasmodium genes evolving under strong diversifying selection will be absent from our data sets, because they will not satisfy the stringent homology criteria of our HQ data sets. In fact, of a set of 43 P. faciparum genes expected to evolve under positive selection (Weedall et al. 2008) only seven are captured in at least one of our four comparisons (supplementary table S2, Supplementary Material online). As expected for genes evolving under diversifying selection, dAA for these genes is relatively high, with all values above the 50th percentile. The regression residual values associated with these genes are also relatively high (none is among the lowest 25th percentile), suggesting that patterns of positive selection are not necessarily constant across lineages, as previously observed (Weedall et al. 2008).
Relative and Absolute Divergence Times
The slope of TLS regressions for the P. vivax and P. knowlesi pair with the four other species pairs specifies the relative ages of the corresponding four splits (fig. 3 and table 2). The age of the split between P. vivax and P. knowlesi is approximately 30% (or 0.285) of the age of the split between P. falciparum and P. yoelii, and it was approximately 1.4, 2.6, and 6.1 times older than the split between P. yoelii–P. berghei, P. berghei–P. chabaudi, and P. falciparum–P. reichenowi, respectively. The most recent common ancestor of these seven mammalian parasites is represented by the node that gave rise to the lineages leading to P. falciparum and to P. yoelii (Silva et al. 2011; fig. 2). Accordingly, our results indicate that the sampled mammalian Plasmodium parasites had a common origin about 22 times earlier than the split between the youngest species pair in this data set, P. falciparum and P. reichenowi.
Table 2.
Divergence Times of Mammalian Plasmodium Parasites.
| Four-Way Comparisons | Ga | Divergence of Pv–Pk Relative to Other Species Pairsb (95% CI) | Age of Divergence of Each Species Pair, Calibrated with Two Eukaryotic Substitution Rates (My) |
|
|---|---|---|---|---|
| Invertebrate Rate | Metazoan Rate | |||
| P. vivax–P. knowlesi | 18.3c | 34.0c | ||
| P. falciparum–P. reichenowi | 280 | 6.13 (5.84–6.42) | 3.0 (2.9–3.1) | 5.5 (5.3–5.8) |
| P. yoelii–P. berghei | 497 | 2.64 (2.54–2.73) | 6.9 (6.7–7.2) | 12.9 (12.5–13.4) |
| P. yoelii–P. chabaudi | 260 | 1.37 (1.30–1.44) | 13.4 (12.7–14.1) | 24.8 (23.6–26.2) |
| P. falciparum–P. yoelii | 1,018 | 0.285 (0.280–0.290) | 64.2 (63.1–65.4) | 119.3 (117.2–121.4) |
aNumber of single-copy protein-coding genes available for all four species in a comparison.
bRelative age of the most recent common ancestor (MRCA) of P. vivax and P. knowlesi (Pv–Pk), in relation to the age of the MRCA of other species pairs, obtained from the slope, α, of the TLS regression; the 95% confidence intervals (CI) were obtained by bootstrap (Materials and Methods).
cThe absolute age of the MRCA of P. vivax and P. knowlesi was obtained by calibrating the median value of dS (0.55 ± 0.0063; first quartile dS = 0.39; third quartile dS = 0.81) between the two species, obtained from 3,324 single-copy protein-coding genes (Carlton et al. 2008), with the average rate of evolution of synonymous sites in Drosophila (1.5 × 10⁻⁸/site/year; Li 1997) and in metazoans (8.1 × 10⁻⁹/site/year; Lynch and Conery 2000).
The absolute age of the split between P. vivax and P. knowlesi can be estimated by calibrating nucleotide divergence in synonymous sites between the two species (median dS = 0.55 ± 0.0063; [Carlton et al. 2008]) with the rate of synonymous substitution per site per year in metazoans, approximately 8.1 × 10⁻⁹ (Lynch and Conery 2000), and in invertebrates, approximately 1.5 × 10⁻⁸ (Li 1997; table 2). Accordingly, the split between P. vivax and P. knowlesi occurred an estimated 18–34 Ma, depending on the calibration rate used. The age of the split between P. vivax and P. knowlesi then yielded absolute ages of the split between remaining species pairs (table 2). According to these estimates, the age of the split between P. falciparum and its sister species P. reichenowi was about 3.0–5.5 Ma, rodent parasites diversified 13–25 Ma, and the sampled mammalian Plasmodium parasites had a common origin at least 64 Ma.
We applied this novel approach to dating divergence times to two other taxonomic groups with extensive genomics resources, in particular placental mammals (Douzery et al. 2014) and Drosophila (Drosophila 12 Genomes Consortium et al. 2007). Interestingly, the assumption that proteins evolve according to a simple molecular clock is not valid in the mammalian data set, and our method cannot be used (supplementary methods S1, Supplementary Material online). However, Drosophila proteins, much like those in Plasmodium, conform very nicely to a linear molecular clock model (supplementary methods S1, Supplementary Material online). The divergence times we obtained for different Drosophila clades using our TLS regression approach are remarkably similar to fossil and molecular data estimates (Throckmorton 1975; Grimaldi 1987, 1988; Obbard et al. 2012).
Plasmodium Evolution in the Context of Host Divergence Times
The two age estimates obtained for each Plasmodium speciation event differ considerably (table 2), because the two eukaryotic evolution rates used to calibrate dS (Pv–Pk) differ almost 2-fold. However, our results are quite informative in that they establish an age range within which the true speciation events are likely to fall (Escalante et al. 1998; Rich et al. 2009; Hughes and Verra 2010; Liu et al. 2010; Ricklefs and Outlaw 2010; Prugnolle et al. 2011; Silva et al. 2011; Valkiunas et al. 2011).
The age of the split between P. falciparum and P. reichenowi is about 3.0–5.5 Ma. These species are each other’s closest relatives, and because they were first identified in humans and chimpanzees, respectively, much of the discussion about their origin has been framed in terms of coevolution with their hosts versus the acquisition of P. falciparum by humans from chimps at a relatively recent time, postdating the split of the two host species (Escalante et al. 1998; Rich et al. 2009; Hughes and Verra 2010; Ricklefs and Outlaw 2010; Silva et al. 2011). Recently, it has been proposed that P. falciparum is a zoonotic parasite from gorillas (Liu et al. 2010). Although this scenario remains to be validated (Prugnolle et al. 2011; Silva et al. 2011; Valkiunas et al. 2011), it is certainly plausible, and both alternatives need to be discussed. The age range for the divergence of the two parasite species overlaps the estimated divergence time between human and chimpanzee (Hobolth et al. 2007), and is congruent with the cospeciation of these Plasmodium species with their hosts (Escalante et al. 1995; Hughes and Verra 2010). However, a parasite split postdating the human–chimpanzee split, with the parasite switching hosts before the origin of anatomically modern humans, possibly in the late Pliocene (Martin et al. 2005), is also compatible with the results. If indeed P. falciparum is primarily a parasite of gorillas (Liu et al. 2010), its split from P. reichenowi would have postdated that of the hosts, which occurred greater than 8 Ma (Raaum et al. 2005; Steiper and Young 2006; Yang and Rannala 2006). The corresponding sequences indicate, however, that the split between P. falciparum and P. reichenowi could not have occurred within the last 10,000 years (Rich et al. 2009), because a split so recent entails a rate of synonymous substitution in Plasmodium two orders of magnitude higher than any observed in eukaryotes. We also investigated the possibility that sequencing errors in the draft genome assembly of P. reichenowi inflated amino acid divergence relative to P. falciparum. We obtained all P. reichenowi sequences available in GenBank, and compared them to those in our preliminary annotation of the draft genome assembly (Materials and Methods). Of the 97 P. reichenowi protein sequences available, 41 had significant matches to 19 of the 698 P. reichenowi protein data set in our preliminary annotation (supplementary table S3, Supplementary Material online). These 19 unique protein sequences are nearly identical to the sequences inferred from the genome assembly (sequence identity: median = 100%; average = 98.9%). Of the four out of 19 proteins for which sequence identity was less than 99% when compared with the draft genome, one is a hypothetical protein, and two others are homologous to P. falciparum antigens, and are therefore expected to have a high degree of amino acid sequence polymorphism. Therefore, although the draft genome assembly of P. reichenowi probably contains sequencing errors, the protein sample available suggests that the errors could not be sufficiently frequent to alter the estimates of divergence between P. falciparum and P. reichenowi noticeably.
Previous estimates of the age of the split between P. vivax and P. knowlesi, which placed the speciation event within the past 7 My (Escalante et al. 1998, 2005; Jongwutiwes et al. 2005; Hayakawa et al. 2008), all used mitochondrial sequences. However, the mitochondrial genome in Plasmodium has properties that lead to systematic underestimation of sequence divergence (see below), and is therefore unsuitable for dating. Our estimates, based on thousands of nuclear genes, place this split much earlier in time, between 18 and 34 Ma. Interestingly, the estimates overlap with the split of their respective hosts, apes (Hominoidea), and Old World monkeys (Cercopithecidae), about 24–38 Ma (Steiper and Young 2009; fig. 4). Most significantly, recent studies strongly suggest that in fact P. vivax originated in Africa, and that its closest taxa are parasites of chimpanzees and gorillas (Liu et al. 2014).
Fig. 4.

Origin of Plasmodium lineages and of their mammalian hosts. Plasmodium divergence estimates (vertical lines, connected by horizontal bar) as in table 1. Mammalian divergence times (rectangles): primates versus rodents approximately 91 My (75–101 My) (Murphy and Eizirik 2009); apes (Hominoidea) versus Old World monkeys (Cercopithecidae) approximately 29.6 My (24–38 My) (Steiper and Young 2009); Muridae approximately 15 My (Steppan et al. 2004); humans versus chimpanzee approximately 4.1–6.4 My; and chimpanzees versus gorilla approximately 8.3–8.6 My (Steiper and Young 2006; Yang and Rannala 2006; Hobolth et al. 2007). Plasmodium parasites are largely contemporaneous with their mammalian hosts. In particular, Plasmodium mammalian parasites (defined by the MRCA of Pf–Py) originated over 60 Ma (green), the lineages leading to P. vivax and P. knowlesi (Pv–Pk) have coexisted with apes and Old World monkeys for approximately 20–30 My (red), and the divergence between P. falciparum and P. reichenowi (Pf–Pr) took place greater than 3 Ma (orange). Finally, P. yoelii, P. chabaudi and P. berghei (blue), all of which parasitize murine rodents, share a common ancestor around the time of the origin of the family Muridae. Pb, P. berghei; Pc, P. chabaudi; Pf, P. falciparum; Pk, P. knowlesi; Pr, P. reichenowi; Pv, P. vivax; Py, P. yoelii.
The rodent parasites included here, P. yoelii, P. chabaudi, and P. berghei, all parasitize murine rodents. The most recent common ancestor of the parasites lived between 13 and 25 Ma, suggesting that the diversification of these rodent parasites coincided with the radiation of the family Muridae, which occurred in the last 25 Ma (Steppan et al. 2004).
Finally, our analyses place the origin of the mammalian Plasmodium in the late Mesozoic, between 64 and 120 Ma, an interval overlapping with the divergence between the primate and rodent lineages (Steppan et al. 2004; Murphy and Eizirik 2009), strongly suggesting that mammals and Plasmodium have coexisted for much, and possibly all, of their evolutionary history (fig. 4). Our results agree with studies placing the ages of the P. falciparum–P. reichenowi and P. vivax–P. knowlesi speciation events toward the older end of previous range estimates.
Discussion
The rate of substitution in Plasmodium is unknown, precluding reliable age estimates for the most recent common ancestor of extant human parasite populations and for speciation events within the genus (Prugnolle et al. 2011). Instead, published ages are often obtained by calibrating DNA sequence polymorphism (usually in P. falciparum or in P. vivax [Joy et al. 2003; Escalante et al. 2005; Jongwutiwes et al. 2005; Mu et al. 2005]) or sequence divergence between species (Hayakawa et al. 2008; Ricklefs and Outlaw 2010; Pacheco et al. 2012) with a substitution rate inferred under the assumption of cospeciation of parasite species and their respective host. Examples include the cospeciation of P. falciparum and P. reichenowi with human and chimpanzees (Joy et al. 2003; Jongwutiwes et al. 2005), the radiation of monkey parasites being coincident with that of their respective Old World monkey host species (Escalante et al. 2005; Mu et al. 2005; Hayakawa et al. 2008; Krief et al. 2010; Pacheco et al. 2012), or the cospeciation of avian species pairs and their respective Plasmodium parasites (Ricklefs and Outlaw 2010). Other studies have calibrated divergence with rRNA substitution rates estimated for bacterial or eukaryotic taxa (Escalante and Ayala 1995; Escalante et al. 1995). All these studies share the common problem of examining at most a few genetic loci, whose polymorphism or divergence might be skewed in an unknown but specific manner. In 2011, Silva et al. (2011) obtained times for several speciation events among mammalian Plasmodium parasites by applying several methods to sequences from 45 nuclear loci. However, their study assumed that P. falciparum and P. reichenowi cospeciated with their respective mammalian hosts, which may not be accurate (Liu et al. 2010).
Here, we approached the problem differently. P. vivax and P. knowlesi have virtually closed genome assemblies and are sufficiently closely related to avoid saturation of synonymous sites. Over 2,800 protein-coding nuclear genes can be reliably aligned between these species in an automated fashion, resulting in a highly accurate estimate of synonymous substitutions rate per site between the two species (dS (Pv–Pk)). We calibrated dS (Pv–Pk) with two eukaryotic rates of synonymous substitution per site per year, one obtained from Drosophila (Li 1997) and one a rough average value for metazoans (Lynch and Conery 2000), to obtain an estimate of the divergence time between the two Plasmodium species. Because the evolution rate per year in Drosophila (dS ∼ 1.5 × 10⁻⁸) is among the fastest ever found among eukaryotes, and Plasmodium is unlikely to evolve slower that the average metazoan, these two estimates can be regarded as reasonable upper and lower boundaries for the divergence time between P. vivax and P. knowlesi. Recent mutation accumulation experiments have documented per generation mutation rates for Plasmodium in par with those observed for yeast, Drosophila and humans (Bopp et al. 2013), although it remains unclear how this translates to substitution rates. It is also noteworthy that the closest eukaryotic taxon to the Apicomplexa with a significant fossil record, the diatoms, have an estimated dS ∼ 6.5–8.7 × 10⁻⁹ (Sorhannus and Fox 1999), which overlaps with the more conservative metazoan rate estimate. Finally, we had the relative divergence time between species pairs from the correlations of hundreds to thousands of genes, so the divergence times between P. vivax and P. knowlesi permitted us to estimate the corresponding absolute divergence times.
Five new putative species of Plasmodium closely related to P. falciparum and P. reichenowi have recently been discovered, all of which infect chimpanzees or gorillas (Ollomo et al. 2009; Duval et al. 2010; Krief et al. 2010; Liu et al. 2010; Prugnolle et al. 2010), bringing to seven the number of identified species in the Laverania subgenus (Prugnolle et al. 2011). This is a crucial finding for the study of malaria, as these species will provide context for the biology and evolution of P. falciparum, the most deadly of the human Plasmodium parasites. So far only data for mitochondrial loci have been published, but soon the defining characteristics of each species will be identified from the nuclear genome, such as differences in genome sequence and structure, gene composition, and sequence divergence. Of particular interest will be the evolution of genes involved in adhesion and invasion of the host cell, and those responsible for evasion of the host immune system. The age of the species will provide the defining rate of evolution of these pathogenesis traits. The mitochondrial data suggest that the common origin of the seven great ape parasites is roughly two to three times older than the split of P. falciparum from P. reichenowi (Prugnolle et al. 2011), although data from many nuclear loci will be necessary to determine this with higher accuracy. Based on our estimate of the P. falciparum–P. reichenowi split, the mitochondrial data place the origin of the Laverania subgenus at approximately 9–16 My old. This suggests that the diversification of these parasites is contemporaneous with that of the Homininae subfamily (containing humans, chimpanzees, bonobos, and gorillas), which took place in the past 15 My (Raaum et al. 2005; Yang and Rannala 2006; Horner et al. 2007).
A recent study based on the mitochondrial gene cytochrome b estimated the split between P. falciparum and P. reichenowi at 2.5 Ma and the origin of all mammalian Plasmodium at less than 13 Ma (Ricklefs and Outlaw 2010). If the mitochondrial estimates are correct, the greater part of mammalian evolution must have occurred in a context devoid of Plasmodium. More importantly from a human health perspective, the mitochondrial estimates imply unusually high rates of molecular evolution, host switching, and speciation as defining characteristics of Plasmodium. However, estimates based on mitochondrial data may be unreliable because the Plasmodium mitochondrial genome has an extremely biased nucleotide composition (27.2% GC overall, 13.7% GC in third codon positions) and a high saturation rate (McIntosh et al. 1998). Our results support this conclusion by showing that for very recent divergences, where substitution saturation is rare, our study generally confirmed the age estimates (e.g., age of P. falciparum–P. reichenowi split), but that for older divergences there were sharp differences, such as the greater than 5-fold difference for the origin of mammalian Plasmodium. On the other hand, if the mitochondrial estimates are correct, they imply that the amino acid substitution rate in Plasmodium nuclear proteins decreased sharply through time, a phenomenon for which there is no seeming explanation.
Overall, our results indicate that mammalian-infecting Plasmodium species have broadly coexisted, and perhaps coevolved, with their mammalian hosts. Even though the transmission of Plasmodium between humans and other primates has been documented (Cox-Singh et al. 2008; Krief et al. 2010; Liu et al. 2010), there is no evidence that this was a common event on an evolutionary scale (Wanaguru et al. 2013).
There is evidence that malaria has had a substantial impact on recent human evolution (Kwiatkowski 2005), and conversely that Plasmodium is under strong pressure exerted by its host (Mackinnon and Marsh 2010). Our results strengthen the hypothesis that the mammalian lineage carried malaria parasites long before the infection of humans, as suggested by the rapid coevolution of surface glycoproteins on red blood cells and their Plasmodium-encoded ligands (Wang et al. 2003). Interestingly, the two best-studied mammalian immune systems, those of human and the house mouse (Mus musculus), have many known differences, several of which involve defense mechanisms implicated in the response to malaria (Coban et al. 2007), including the differential expansion and deletion of various sets of natural killer cell receptors (Hao et al. 2006) and mannose-binding lectins (Sastry et al. 1995), differences between the roles of CD3γ and CD3δ (Fernandez-Malave et al. 2006), and differences in the structure of the splenic marginal zone (Steiniger et al. 2005). Thus, some of the distinctive immune mechanisms in different mammalian lineages may reflect a lengthy coevolution with a unique set of malaria parasites.
Materials and Methods
Data
The genomic files for the seven Plasmodium species were downloaded from PlasmoDB 5.5. GFF files describing gene, protein, coding sequences (CDS) and exon features were also downloaded for all six annotated species, P. berghei (Pb), P. chabaudi (Pc), P. falciparum (Pf), P. knowlesi (Pk), P. vivax (Pv), and P. yoelii (Py). Protein sequences and CDS chromosome coordinates were compared using in-house scripts, and reconciled when possible. The P. reichenowi (Pr) genome did not have an associated annotation, and a putative gene set was derived based on the P. falciparum gene set. We used PASA (Haas et al. 2003) to generate a gene set for P. reichenowi, using the P. falciparum gene set as a proxy for full-length transcript data, and requiring ≥90% nucleotide identity over ≥90% of the length of the gene. This recovered 698 putative proteins. We defined COGs (clusters of orthologous genes) based on our comparative pipeline, which starts with BLASTP to find matches among protein sequences within and across species. We used the BLOSUM62 matrix with expected value 10−5. Jaccard clustering was then performed twice, once to form within-species clusters of paralogous genes and a second time to derive a set of multispecies COGs. In the first case, we used an 80% identity cutoff and a link score of 0.6. In the second, we set a Jaccard coefficient cutoff of 0 for edge pruning. Genes within a COG were aligned with ClustalW, with default parameters.
For each of the five pairwise data sets, or lineages (fig. 2), we retained only those genes satisfying the following conditions: 1) the genes have no paralogs in either species; 2) the genes and respective proteins have no irreconcilable differences stemming from incorrect annotation (see previous paragraph); and 3) the protein sequence lengths in the two species are within 10% of each other. The conditions minimize errors in estimated evolutionary rates due to paralogy, incorrect inferences of orthology, annotation errors, or gap-induced misalignments. The resulting five HQ data sets contained the following numbers of genes successfully paired between the corresponding species: Pv–Pk, 2827; Py–Pc, 853; Py–Pb, 1,220; Pf–Pr, 454; and Pf–Py, 1,400. Table 2 displays results for four regressions using genes present in both the Pv–Pk HQ data set and each of the other HQ data sets, in turn.
Molecular Evolution
Amino acid sequence divergence (dAA) was estimated using the JTT-F model of evolution implemented in the program codeml from the PAML package (Yang 2007). IDEA (Egan et al. 2008) was used to launch and monitor the PAML analyses and to distribute the computations across a grid of computers.
TLS Regression
Unlike the true amino acid sequence distances and , the observed distances and contain noise, because the corresponding mutational processes are random. The taxon pairs and were chosen to correspond to separate tree-paths in the phylogenetic tree, thereby justifying the assumption that the two random mutational processes differentiating each taxon pair are independent. To simplify the notation and to prepare for a regression, fix the malarial species , and , so is a constant. Let and denote the estimated sequence distances, ranging over the genes common to , and . Similarly, let and denote the true sequence distances. Our null hypothesis rests on the assumption that in equation (3). Under its evolutionary models, PAML (Yang 2007) estimates the amino acid sequence divergences with maximum likelihood (ML), deriving the corresponding error estimates from observed Fisher information (Kendall and Stuart 1979). We applied TLS regression to find and minimizing the sum
| (4) |
where the sum is restricted to those genes satisfying the cutoffs and . A confidence interval for α was then obtained by bootstrapping the residuals and .
Derivation of the TLS Regression in Equation (4)
PAML produces its ML estimation (MLE) of a sequence distance from a log-likelihood λ(Xg|xg), which corresponds to a particular random model of evolution. Under our null model , the evolutionary model also specifies . Thus, the log-likelihood of the pertinent data is
| (5) |
as a function of , where the sum is over all genes common to and . The likelihood in equation (5) specifies our statistical null model completely.
Unfortunately, PAML does not evaluate the log-likelihoods and . Instead, PAML reports MLEs maximizing the individual terms and , along with error estimates derived from observed Fisher information (Kendall and Stuart 1979).
To exploit this reduced information as much as possible, approximate as a normal variate with its mean unknown and known standard deviation , so
| (6) |
and similarly for . The substitution of the quadratic approximation for in equation (5) leads to the problem of maximizing
| (7) |
where the sum is over all genes common to , and , a maximization almost equivalent to the TLS regression in equation (4). The rates of evolution and must be positive; however, so in practice, the normal approximation becomes problematic when it puts appreciable probability mass on negative values, skewing the TLS fit.
For any gene , and for or , the true (unknown) likelihoods and are 0. The normal approximation therefore overestimates the true likelihood near or . Hence, if or is small, the normal approximation might be inaccurate. In addition, from a scientific perspective, the gene is of little interest, because it might not have evolved much. It therefore seems advisable to exclude from the TLS fit. The -statistic, the estimated fraction of the variation in the data that the regression explains, is then a conservative underestimate.
Accordingly, we applied a cutoff or , dropping any gene where the normal approximation in equation (7) has more than 5% of either marginal probability on the negative numbers, arriving at the TLS regression in equation (4).
The bootstrap yields an approximate confidence interval for , as follows. Under the null hypothesis, the normalized residuals and can be bootstrapped to approximate the variance of in the original sample, as follows. Let and denote permutations of the usable genes (the genes with and ). For 10,000 uniformly random pairs of independent permutations and , we calculated a TLS regression slope by bootstrapping the residuals and to produce values and . The normal approximation and the bootstrapped sample standard deviation of the values gave an estimated 95% confidence interval for .
The Fraction of Variation in the Data Explained by TLS Regression
To assess the extent to which Plasmodium amino acid substitution rates conform to a molecular clock model, we quantify the strength of the relationship between substitution rates in the various lineages. This can be measured by , the correlation between and over all genes . We cannot observe and directly, but rather we observe and , which incorporate measurement errors corresponding to the variance and , respectively.
To estimate , we compute the disattenuated correlation , which estimates the correlation between the underlying variables and by compensating for the attenuation in the correlation introduced by the measurement error in and . Define the weights and corresponding probabilities , which define a “weighted empirical distribution” over the points . Let denote expectation under the weighted empirical distribution. The disattenuated correlation is
| (8) |
In the case of identical weights (where, without loss of generality, ), is a consistent estimator of (Sokal and Rohlf 1981), so the standard method of replicating unweighted data points to approximate a particular weighted distribution shows that despite using weights, in equation (8) is also a consistent estimator of . Bootstrapping simulations suggest that when compared with identical weights, the weights dramatically decrease the variance of the estimate (data not shown). To convert the correlation into the more familiar language of regression, we compute the -statistic , which corresponds to the fraction of the variance in one variable explained by dependence on the other variable. This method was implemented in R. Source code available from the authors upon request.
Supplementary Material
Supplementary table S1–S3 and methods S1 are available at Molecular Biology and Evolution online (http://www.mbe.oxfordjournals.org/).
Acknowledgments
The authors thank Austin Hughes for stimulating discussions, and J. Crabtree, A. Ganapathy, and D. Riley for technical support. This project was funded in part with federal funds from the National Institute of Allergy and Infectious Diseases (NIAID), National Institutes of Health (NIH), Department of Health and Human Services under contract number HHSN272200900009C and by startup funds to J.C.S., and by the Intramural Research Program of the National Institutes of Health, National Library of Medicine (J.L.S.).
References
- Bopp SE, Manary MJ, Bright AT, Johnston GL, Dharia NV, Luna FL, McCormack S, Plouffe D, McNamara CW, Walker JR, et al. Mitotic evolution of Plasmodium falciparum shows a stable core genome but recombination in antigen families. PLoS Genet. 2013;9:e1003293. doi: 10.1371/journal.pgen.1003293. [DOI] [PMC free article] [PubMed] [Google Scholar]
- Bromham L, Penny D. The modern molecular clock. Nat Rev Genet. 2003;4:216–224. doi: 10.1038/nrg1020. [DOI] [PubMed] [Google Scholar]
- Carlton JM, Adams JH, Silva JC, Bidwell SL, Lorenzi H, Caler E, Crabtree J, Angiuoli SV, Merino EF, Amedeo P, et al. Comparative genomics of the neglected human malaria parasite Plasmodium vivax. Nature. 2008;455:757–763. doi: 10.1038/nature07327. [DOI] [PMC free article] [PubMed] [Google Scholar]
- Carlton JM, Angiuoli SV, Suh BB, Kooij TW, Pertea M, Silva JC, Ermolaeva MD, Allen JE, Selengut JD, Koo HL, et al. Genome sequence and comparative analysis of the model rodent malaria parasite Plasmodium yoelii yoelii. Nature. 2002;419:512–519. doi: 10.1038/nature01099. [DOI] [PubMed] [Google Scholar]
- Coban C, Ishii KJ, Horii T, Akira S. Manipulation of host innate immune responses by the malaria parasite. Trends Microbiol. 2007;15:271–278. doi: 10.1016/j.tim.2007.04.003. [DOI] [PubMed] [Google Scholar]
- Cox-Singh J, Davis TM, Lee KS, Shamsul SS, Matusop A, Ratnam S, Rahman HA, Conway DJ, Singh B. Plasmodium knowlesi malaria in humans is widely distributed and potentially life threatening. Clin Infect Dis. 2008;46:165–171. doi: 10.1086/524888. [DOI] [PMC free article] [PubMed] [Google Scholar]
- Douzery EJ, Scornavacca C, Romiguier J, Belkhir K, Galtier N, Delsuc F, Ranwez V. OrthoMaM v8: a database of orthologous exons and coding sequences for comparative genomics in mammals. Mol Biol Evol. 2014 Jul;31(7):1923–1928. doi: 10.1093/molbev/msu132. [DOI] [PubMed] [Google Scholar]
- Drosophila 12 Genomes Consortium, Clark AG, Eisen MB, Smith DR, Bergman CM, Oliver B, Markow TA, Kaufman TC, Kellis M, Gelbart W, et al. Evolution of genes and genomes on the Drosophila phylogeny. Nature. 2007;450:203–218. doi: 10.1038/nature06341. [DOI] [PubMed] [Google Scholar]
- Duval L, Fourment M, Nerrienet E, Rousset D, Sadeuh SA, Goodman SM, Andriaholinirina NV, Randrianarivelojosia M, Paul RE, Robert V, et al. African apes as reservoirs of Plasmodium falciparum and the origin and diversification of the Laverania subgenus. Proc Natl Acad Sci U S A. 2010;107:10561–10566. doi: 10.1073/pnas.1005435107. [DOI] [PMC free article] [PubMed] [Google Scholar]
- Egan A, Mahurkar A, Crabtree J, Badger JH, Carlton JM, Silva JC. IDEA: interactive display for evolutionary analyses. BMC Bioinformatics. 2008;9:524. doi: 10.1186/1471-2105-9-524. [DOI] [PMC free article] [PubMed] [Google Scholar]
- Escalante AA, Ayala FJ. Evolutionary origin of Plasmodium and other Apicomplexa based on rRNA genes. Proc Natl Acad Sci U S A. 1995;92:5793–5797. doi: 10.1073/pnas.92.13.5793. [DOI] [PMC free article] [PubMed] [Google Scholar]
- Escalante AA, Barrio E, Ayala FJ. Evolutionary origin of human and primate malarias: evidence from the circumsporozoite protein gene. Mol Biol Evol. 1995;12:616–626. doi: 10.1093/oxfordjournals.molbev.a040241. [DOI] [PubMed] [Google Scholar]
- Escalante AA, Cornejo OE, Freeland DE, Poe AC, Durrego E, Collins WE, Lal AA. A monkey's tale: the origin of Plasmodium vivax as a human malaria parasite. Proc Natl Acad Sci U S A. 2005;102:1980–1985. doi: 10.1073/pnas.0409652102. [DOI] [PMC free article] [PubMed] [Google Scholar]
- Escalante AA, Freeland DE, Collins WE, Lal AA. The evolution of primate malaria parasites based on the gene encoding cytochrome b from the linear mitochondrial genome. Proc Natl Acad Sci U S A. 1998;95:8124–8129. doi: 10.1073/pnas.95.14.8124. [DOI] [PMC free article] [PubMed] [Google Scholar]
- Fernandez-Malave E, Wang N, Pulgar M, Schamel WW, Alarcon B, Terhorst C. Overlapping functions of human CD3delta and mouse CD3gamma in alphabeta T-cell development revealed in a humanized CD3gamma-mouse. Blood. 2006;108:3420–3427. doi: 10.1182/blood-2006-03-010850. [DOI] [PubMed] [Google Scholar]
- Gardner MJ, Hall N, Fung E, White O, Berriman M, Hyman RW, Carlton JM, Pain A, Nelson KE, Bowman S, et al. Genome sequence of the human malaria parasite Plasmodium falciparum. Nature. 2002;419:498–511. doi: 10.1038/nature01097. [DOI] [PMC free article] [PubMed] [Google Scholar]
- Grimaldi DA. Amber fossil Drosphilidae (Diptera), with particular reference to the Hispaniolan taxa. Am Museum Novit. 1987;2880:1–23. [Google Scholar]
- Grimaldi DA. Relicts in the Drosophilidae (Diptera) In: Liebherr JK, editor. Zoogeography of Caribbean insects. Ithaca (NY): Cornell University Press; 1988. pp. 183–213. [Google Scholar]
- Haas BJ, Delcher AL, Mount SM, Wortman JR, Smith RK, Jr, Hannick LI, Maiti R, Ronning CM, Rusch DB, Town CD, et al. Improving the Arabidopsis genome annotation using maximal transcript alignment assemblies. Nucleic Acids Res. 2003;31:5654–5666. doi: 10.1093/nar/gkg770. [DOI] [PMC free article] [PubMed] [Google Scholar]
- Hall N, Karras M, Raine JD, Carlton JM, Kooij TW, Berriman M, Florens L, Janssen CS, Pain A, Christophides GK, et al. A comprehensive survey of the Plasmodium life cycle by genomic, transcriptomic, and proteomic analyses. Science. 2005;307:82–86. doi: 10.1126/science.1103717. [DOI] [PubMed] [Google Scholar]
- Hao L, Klein J, Nei M. Heterogeneous but conserved natural killer receptor gene complexes in four major orders of mammals. Proc Natl Acad Sci U S A. 2006;103:3192–3197. doi: 10.1073/pnas.0511280103. [DOI] [PMC free article] [PubMed] [Google Scholar]
- Hayakawa T, Culleton R, Otani H, Horii T, Tanabe K. Big bang in the evolution of extant malaria parasites. Mol Biol Evol. 2008;25:2233–2239. doi: 10.1093/molbev/msn171. [DOI] [PubMed] [Google Scholar]
- Hobolth A, Christensen OF, Mailund T, Schierup MH. Genomic relationships and speciation times of human, chimpanzee, and gorilla inferred from a coalescent hidden Markov model. PLoS Genet. 2007;3:e7. doi: 10.1371/journal.pgen.0030007. [DOI] [PMC free article] [PubMed] [Google Scholar]
- Honey K. Tales from the gene pool: a genomic view of infectious disease. J Clin Invest. 2009;119:2452–2454. doi: 10.1172/JCI40662. [DOI] [PMC free article] [PubMed] [Google Scholar]
- Horner DS, Lefkimmiatis K, Reyes A, Gissi C, Saccone C, Pesole G. Phylogenetic analyses of complete mitochondrial genome sequences suggest a basal divergence of the enigmatic rodent Anomalurus. BMC Evol Biol. 2007;7:16. doi: 10.1186/1471-2148-7-16. [DOI] [PMC free article] [PubMed] [Google Scholar]
- Hughes AL. Near neutrality: leading edge of the neutral theory of molecular evolution. Ann N Y Acad Sci. 2008;1133:162–179. doi: 10.1196/annals.1438.001. [DOI] [PMC free article] [PubMed] [Google Scholar]
- Hughes AL, Verra F. Malaria parasite sequences from chimpanzee support the co-speciation hypothesis for the origin of virulent human malaria (Plasmodium falciparum) Mol Phylogenet Evol. 2010;57:135–143. doi: 10.1016/j.ympev.2010.06.004. [DOI] [PMC free article] [PubMed] [Google Scholar]
- Jeffares DC, Pain A, Berry A, Cox AV, Stalker J, Ingle CE, Thomas A, Quail MA, Siebenthall K, Uhlemann AC, et al. Genome variation and evolution of the malaria parasite Plasmodium falciparum. Nat Genet. 2007;39:120–125. doi: 10.1038/ng1931. [DOI] [PMC free article] [PubMed] [Google Scholar]
- Jongwutiwes S, Putaporntip C, Iwasaki T, Ferreira MU, Kanbara H, Hughes AL. Mitochondrial genome sequences support ancient population expansion in Plasmodium vivax. Mol Biol Evol. 2005;22:1733–1739. doi: 10.1093/molbev/msi168. [DOI] [PMC free article] [PubMed] [Google Scholar]
- Joy DA, Feng X, Mu J, Furuya T, Chotivanich K, Krettli AU, Ho M, Wang A, White NJ, Suh E, et al. Early origin and recent expansion of Plasmodium falciparum. Science. 2003;300:318–321. doi: 10.1126/science.1081449. [DOI] [PubMed] [Google Scholar]
- Kendall M, Stuart A. The advanced theory of statistics, Vol. 2: Inference and relationship. London: Charles Griffin & Co Ltd; 1979. [Google Scholar]
- Kimura M. Evolutionary rate at the molecular level. Nature. 1968;217:624–626. doi: 10.1038/217624a0. [DOI] [PubMed] [Google Scholar]
- Krief S, Escalante AA, Pacheco MA, Mugisha L, Andre C, Halbwax M, Fischer A, Krief JM, Kasenene JM, Crandfield M, et al. On the diversity of malaria parasites in African apes and the origin of Plasmodium falciparum from Bonobos. PLoS Pathog. 2010;6:e1000765. doi: 10.1371/journal.ppat.1000765. [DOI] [PMC free article] [PubMed] [Google Scholar]
- Kwiatkowski DP. How malaria has affected the human genome and what human genetics can teach us about malaria. Am J Hum Genet. 2005;77:171–192. doi: 10.1086/432519. [DOI] [PMC free article] [PubMed] [Google Scholar]
- Li W-H. Molecular evolution. Sunderland: Sinauer; 1997. [Google Scholar]
- Liu W, Li Y, Learn GH, Rudicell RS, Robertson JD, Keele BF, Ndjango JB, Sanz CM, Morgan DB, Locatelli S, et al. Origin of the human malaria parasite Plasmodium falciparum in gorillas. Nature. 2010;467:420–425. doi: 10.1038/nature09442. [DOI] [PMC free article] [PubMed] [Google Scholar]
- Liu W, Li Y, Shaw KS, Learn GH, Plenderleith LJ, Malenke JA, Sundararaman SA, Ramirez MA, Crystal PA, Smith AG, et al. African origin of the malaria parasite Plasmodium vivax. Nat Commun. 2014;5:3346. doi: 10.1038/ncomms4346. [DOI] [PMC free article] [PubMed] [Google Scholar]
- Lynch M, Conery JS. The evolutionary fate and consequences of duplicate genes. Science. 2000;290:1151–1155. doi: 10.1126/science.290.5494.1151. [DOI] [PubMed] [Google Scholar]
- Mackinnon MJ, Marsh K. The selection landscape of malaria parasites. Science. 2010;328:866–871. doi: 10.1126/science.1185410. [DOI] [PubMed] [Google Scholar]
- Martin MJ, Rayner JC, Gagneux P, Barnwell JW, Varki A. Evolution of human-chimpanzee differences in malaria susceptibility: relationship to human genetic loss of N-glycolylneuraminic acid. Proc Natl Acad Sci U S A. 2005;102:12819–12824. doi: 10.1073/pnas.0503819102. [DOI] [PMC free article] [PubMed] [Google Scholar]
- McIntosh MT, Srivastava R, Vaidya AB. Divergent evolutionary constraints on mitochondrial and nuclear genomes of malaria parasites. Mol Biochem Parasitol. 1998;95:69–80. doi: 10.1016/s0166-6851(98)00093-0. [DOI] [PubMed] [Google Scholar]
- Mu J, Joy DA, Duan J, Huang Y, Carlton J, Walker J, Barnwell J, Beerli P, Charleston MA, Pybus OG, et al. Host switch leads to emergence of Plasmodium vivax malaria in humans. Mol Biol Evol. 2005;22:1686–1693. doi: 10.1093/molbev/msi160. [DOI] [PubMed] [Google Scholar]
- Murphy WJ, Eizirik E. Placental mammals (Eutheria) In: Hedges SB, Kumar S, editors. The Timetree of Life. New York: Oxford University Press; 2009. pp. 471–474. [Google Scholar]
- Nei M. Molecular evolutionary genetics. New York: Columbia University Press; 1987. [Google Scholar]
- Obbard DJ, Maclennan J, Kim KW, Rambaut A, O'Grady PM, Jiggins FM. Estimating divergence dates and substitution rates in the Drosophila phylogeny. Mol Biol Evol. 2012;29:3459–3473. doi: 10.1093/molbev/mss150. [DOI] [PMC free article] [PubMed] [Google Scholar]
- Ollomo B, Durand P, Prugnolle F, Douzery E, Arnathau C, Nkoghe D, Leroy E, Renaud F. A new malaria agent in African hominids. PLoS Pathog. 2009;5:e1000446. doi: 10.1371/journal.ppat.1000446. [DOI] [PMC free article] [PubMed] [Google Scholar]
- Pacheco MA, Reid MJ, Schillaci MA, Lowenberger CA, Galdikas BM, Jones-Engel L, Escalante AA. The origin of malarial parasites in orangutans. PLoS One. 2012;7:e34990. doi: 10.1371/journal.pone.0034990. [DOI] [PMC free article] [PubMed] [Google Scholar]
- Pain A, Bohme U, Berry AE, Mungall K, Finn RD, Jackson AP, Mourier T, Mistry J, Pasini EM, Aslett MA, et al. The genome of the simian and human malaria parasite Plasmodium knowlesi. Nature. 2008;455:799–803. doi: 10.1038/nature07306. [DOI] [PMC free article] [PubMed] [Google Scholar]
- Prugnolle F, Durand P, Neel C, Ollomo B, Ayala FJ, Arnathau C, Etienne L, Mpoudi-Ngole E, Nkoghe D, Leroy E, et al. African great apes are natural hosts of multiple related malaria species, including Plasmodium falciparum. Proc Natl Acad Sci U S A. 2010;107:1458–1463. doi: 10.1073/pnas.0914440107. [DOI] [PMC free article] [PubMed] [Google Scholar]
- Prugnolle F, Durand P, Ollomo B, Duval L, Ariey F, Arnathau C, Gonzalez JP, Leroy E, Renaud F. A fresh look at the origin of Plasmodium falciparum, the most malignant malaria agent. PLoS Pathog. 2011;7:e1001283. doi: 10.1371/journal.ppat.1001283. [DOI] [PMC free article] [PubMed] [Google Scholar]
- Raaum RL, Sterner KN, Noviello CM, Stewart CB, Disotell TR. Catarrhine primate divergence dates estimated from complete mitochondrial genomes: concordance with fossil and nuclear DNA evidence. J Hum Evol. 2005;48:237–257. doi: 10.1016/j.jhevol.2004.11.007. [DOI] [PubMed] [Google Scholar]
- Rich SM, Leendertz FH, Xu G, LeBreton M, Djoko CF, Aminake MN, Takang EE, Diffo JL, Pike BL, Rosenthal BM, et al. The origin of malignant malaria. Proc Natl Acad Sci U S A. 2009;106:14902–14907. doi: 10.1073/pnas.0907740106. [DOI] [PMC free article] [PubMed] [Google Scholar]
- Ricklefs RE, Outlaw DC. A molecular clock for malaria parasites. Science. 2010;329:226–229. doi: 10.1126/science.1188954. [DOI] [PubMed] [Google Scholar]
- Sastry R, Wang JS, Brown DC, Ezekowitz RA, Tauber AI, Sastry KN. Characterization of murine mannose-binding protein genes Mbl1 and Mbl2 reveals features common to other collectin genes. Mamm Genome. 1995;6:103–110. doi: 10.1007/BF00303252. [DOI] [PubMed] [Google Scholar]
- Silva JC, Egan A, Friedman R, Munro JB, Carlton JM, Hughes AL. Genome sequences reveal divergence times of malaria parasite lineages. Parasitology. 2011;138(13):1737–1749. doi: 10.1017/S0031182010001575. [DOI] [PMC free article] [PubMed] [Google Scholar]
- Sokal RR, Rohlf FJ. Biometry: the principles and practice of statistics in biological research. San Francisco: W. H. Freeman; 1981. [Google Scholar]
- Sorhannus U, Fox M. Synonymous and nonsynonymous substitution rates in diatoms: a comparison between chloroplast and nuclear genes. J Mol Evol. 1999;48:209–212. doi: 10.1007/pl00006459. [DOI] [PubMed] [Google Scholar]
- Steiniger B, Timphus EM, Jacob R, Barth PJ. CD27+ B cells in human lymphatic organs: re-evaluating the splenic marginal zone. Immunology. 2005;116:429–442. doi: 10.1111/j.1365-2567.2005.02242.x. [DOI] [PMC free article] [PubMed] [Google Scholar]
- Steiper ME, Young NM. Primate molecular divergence dates. Mol Phylogenet Evol. 2006;41:384–394. doi: 10.1016/j.ympev.2006.05.021. [DOI] [PubMed] [Google Scholar]
- Steiper ME, Young NM. Primates (Primates) In: Hedges SB, Kumar S, editors. The Timetree of Life. New York: Oxford University Press; 2009. pp. 482–486. [Google Scholar]
- Steppan S, Adkins R, Anderson J. Phylogeny and divergence-date estimates of rapid radiations in muroid rodents based on multiple nuclear genes. Syst Biol. 2004;53:533–553. doi: 10.1080/10635150490468701. [DOI] [PubMed] [Google Scholar]
- Tanabe K, Mita T, Jombart T, Eriksson A, Horibe S, Palacpac N, Ranford-Cartwright L, Sawai H, Sakihama N, Ohmae H, et al. Plasmodium falciparum accompanied the human expansion out of Africa. Curr Biol. 2010;20:1–7. doi: 10.1016/j.cub.2010.05.053. [DOI] [PubMed] [Google Scholar]
- Throckmorton LH. The phylogeny, ecology, and geography of Drosophila. In: King RC, editor. Handbook of genetics. New York: Plenum; 1975. pp. 421–469. [Google Scholar]
- Valkiunas G, Ashford RW, Bensch S, Killick-Kendrick R, Perkins S. A cautionary note concerning Plasmodium in apes. Trends Parasitol. 2011;27:231–232. doi: 10.1016/j.pt.2011.02.008. [DOI] [PubMed] [Google Scholar]
- Wanaguru M, Liu W, Hahn BH, Rayner JC, Wright GJ. RH5-Basigin interaction plays a major role in the host tropism of Plasmodium falciparum. Proc Natl Acad Sci U S A. 2013;110:20735–20740. doi: 10.1073/pnas.1320771110. [DOI] [PMC free article] [PubMed] [Google Scholar]
- Wang HY, Tang H, Shen CK, Wu CI. Rapidly evolving genes in human. I. The glycophorins and their possible role in evading malaria parasites. Mol Biol Evol. 2003;20:1795–1804. doi: 10.1093/molbev/msg185. [DOI] [PubMed] [Google Scholar]
- Weedall GD, Polley SD, Conway DJ. Gene-specific signatures of elevated non-synonymous substitution rates correlate poorly across the Plasmodium genus. PLoS One. 2008;3:e2281. doi: 10.1371/journal.pone.0002281. [DOI] [PMC free article] [PubMed] [Google Scholar]
- World Health Organization. World malaria report 2009. Geneva: World Health Organization; 2009. [Google Scholar]
- Yang Z. PAML 4: phylogenetic analysis by maximum likelihood. Mol Biol Evol. 2007;24:1586–1591. doi: 10.1093/molbev/msm088. [DOI] [PubMed] [Google Scholar]
- Yang Z, Rannala B. Bayesian estimation of species divergence times under a molecular clock using multiple fossil calibrations with soft bounds. Mol Biol Evol. 2006;23:212–226. doi: 10.1093/molbev/msj024. [DOI] [PubMed] [Google Scholar]
- Zuckerkandl E, Pauling L. Evolutionary divergence and convergence in proteins. In: Bryson V, Vogel HJ, editors. Evolving genes and proteins. New York: Academic Press; 1965. pp. 97–166. [Google Scholar]
Associated Data
This section collects any data citations, data availability statements, or supplementary materials included in this article.