

Understanding the organisation of human spinal locomotor circuitry after severe CNS damage is essential for improving neurorehabilitation strategies. Danner et al. present evidence of flexibly organised burst-generating elements within the functionally isolated human lumbosacral spinal cord that generate rhythmic patterns in response to constant, repetitive epidural stimulation.
Keywords: central pattern generation, epidural spinal cord stimulation, human, modular organization, spinal cord injury
Abstract
Constant drive provided to the human lumbar spinal cord by epidural electrical stimulation can cause local neural circuits to generate rhythmic motor outputs to lower limb muscles in people paralysed by spinal cord injury. Epidural spinal cord stimulation thus allows the study of spinal rhythm and pattern generating circuits without their configuration by volitional motor tasks or task-specific peripheral feedback. To reveal spinal locomotor control principles, we studied the repertoire of rhythmic patterns that can be generated by the functionally isolated human lumbar spinal cord, detected as electromyographic activity from the legs, and investigated basic temporal components shared across these patterns. Ten subjects with chronic, motor-complete spinal cord injury were studied. Surface electromyographic responses to lumbar spinal cord stimulation were collected from quadriceps, hamstrings, tibialis anterior, and triceps surae in the supine position. From these data, 10-s segments of rhythmic activity present in the four muscle groups of one limb were extracted. Such samples were found in seven subjects. Physiologically adequate cycle durations and relative extension- and flexion-phase durations similar to those needed for locomotion were generated. The multi-muscle activation patterns exhibited a variety of coactivation, mixed-synergy and locomotor-like configurations. Statistical decomposition of the electromyographic data across subjects, muscles and samples of rhythmic patterns identified three common temporal components, i.e. basic or shared activation patterns. Two of these basic patterns controlled muscles to contract either synchronously or alternatingly during extension- and flexion-like phases. The third basic pattern contributed to the observed muscle activities independently from these extensor- and flexor-related basic patterns. Each bifunctional muscle group was able to express both extensor- and flexor-patterns, with variable ratios across the samples of rhythmic patterns. The basic activation patterns can be interpreted as central drives implemented by spinal burst generators that impose specific spatiotemporally organized activation on the lumbosacral motor neuron pools. Our data thus imply that the human lumbar spinal cord circuits can form burst-generating elements that flexibly combine to obtain a wide range of locomotor outputs from a constant, repetitive input. It may be possible to use this flexibility to incorporate specific adaptations to gait and stance to improve locomotor control, even after severe central nervous system damage.
Introduction
In quadrupedal mammals, neural networks in the lumbar spinal cord, termed central pattern generators, provide the basic sequential neural activity to hindlimb motor pools as required for stepping, even when experimentally isolated from supraspinal and sensory modulation (Brown, 1911; Grillner, 1981, 2006). Evidence for spinal locomotor pattern generation in humans is inherently indirect. Automatic rhythmic activation of lower-extremity muscles, i.e. spinal myoclonus, has been observed in subjects with chronic spinal cord injury (Bussel et al., 1988; Calancie et al., 1994; Calancie, 2006). Further, the lumbar spinal cord circuitry can be activated by epidural stimulation to generate rhythmic motor outputs in motor-complete spinal cord injured individuals lying supine (Dimitrijevic et al., 1998; Shapkova and Schomburg, 2001; Gerasimenko et al., 2002; Minassian et al., 2004). The current view is that some elements of the human lumbar locomotor circuitry are similar to those of other mammals (Duysens and Van de Crommert, 1998; Grillner, 2011; Guertin, 2013). Yet, no conclusions have been drawn on its functional organization.
There are two leading conceptual models for the organization of the mammalian locomotor pattern generator (Grillner and Zangger, 1975; McCrea and Rybak, 2008; Guertin, 2009). One model is the two-level hierarchical central pattern generator with a half-centre-like rhythm generator acting as a ‘master-clock’ for pattern formation networks that, in turn, distribute excitation to the different motor neuron pools (Burke et al., 2001; Rybak et al., 2006; Zhong et al., 2012). The second model is a network of coupled unit burst generators, each forming a separate rhythmogenic module (Grillner, 1981, 2003; Hägglund et al., 2013). The consensus is that the central pattern generating networks, one per hemicord and limb, show a modular organization where burst-generating elements are combined to produce integrated motor outputs (McCrea and Rybak, 2008; Hägglund et al., 2013).
The modular organization of human motor control has been studied by statistical analysis of motor patterns recorded during specific locomotor tasks (Giszter and Hart, 2013). A motor module generates basic control signals to produce functionally relevant patterns of muscle activation (Dominici et al., 2011; Fox et al., 2013). The use of a small set of modules by the nervous system is thought to simplify the control of stereotyped motor behaviour (Clark et al., 2010; Fox et al., 2013; Zelik et al., 2014). These motor modules agree with the concepts of functional reflexes, motor primitives, and muscle synergies while some elements of modularity conform to central pattern generator models (Dominici et al., 2011; Duysens et al., 2013; Giszter and Hart, 2013). Decomposition of EMG activity recorded during walking identified two basic activation patterns across the developmental period of human gait, an ‘extension’ and a ‘swing’ pattern, that were retained and tuned in adult locomotion (Dominici et al., 2011) and were suggested to be controlled at spinal level (Grillner, 2011).
Here, we used epidural spinal cord stimulation (SCS) to generate rhythmic motor patterns in the absence of a volitional locomotor task or task-specific peripheral feedback. We analysed the characteristics and modularity of these SCS-induced rhythmic motor outputs in individuals with motor complete spinal cord injury to uncover the functional organization of spinal locomotor control.
Materials and methods
Under approval of the Ethics Committee of the City of Vienna, Austria, in accordance with the Declaration of Helsinki, and with signed informed consent, 10 otherwise healthy adults aged 28.2 ± 11.8 (mean ± SD) years with post-traumatic and clinically motor-complete spinal cord injury in a chronic condition (≥1 year post-injury) were studied. Stretch and cutaneo-muscular reflexes of the legs were preserved in all. The neurological status was evaluated according to the International Standards for Neurological Classification of Spinal Cord Injury (Table 1).
Table 1.
Demographic data and neurological classification of spinal cord injury
| Subject | Gender | Age (years) | Years post injury | Vertebral level(s) of fracture | AIS | Neurological level of injury | Total motor score* | Pin prick score | Light touch score |
|---|---|---|---|---|---|---|---|---|---|
| 1 | F | 20.1 | 3.3 | T4, T5 | A | T4 | 50 | 48 | 44 |
| 2 | M | 24.3 | 1.0 | T3, T4 | A | T5 | 50 | 50 | 50 |
| 3 | M | 58.4 | 3.3 | T7, T8 | B | T9 | 50 | 88 | 86 |
| 4 | M | 25.3 | 1.6 | C5, C6 | B | C8 | 27 | 68 | 68 |
| 5 | F | 33.0 | 2.7 | T4–T6, T10 | A | T5 | 50 | 50 | 54 |
| 6 | M | 33.1 | 13.5 | T5–T8 | B | T8 | 50 | 86 | 86 |
| 7 | F | 26.2 | 5.7 | T7 | A | T5 | 50 | 50 | 50 |
| 8 | M | 21.9 | 5.1 | C5 | A | C6 | 16 | 23 | 23 |
| 9 | M | 21.2 | 2.6 | T7, T8 | A | T7 | 50 | 61 | 61 |
| 10 | M | 18.0 | 3.0 | C4, C5, T7 | B | C6 | 16 | 64 | 64 |
AIS = American Spinal Injury Association Impairment Scale; *Lower-limb motor scores were 0 in all.
Additionally, a neurophysiological evaluation with surface-EMG recordings from the adductors, quadriceps, hamstrings, tibialis anterior and triceps surae muscles bilaterally was applied (Sherwood et al., 1996; McKay et al., 2012). None of the subjects had the ability to induce EMG activity by the attempt of isolated unilateral ankle dorsi- and plantar-flexion. Non-specific residual excitatory influence was tested by the activation of muscles below the lesion in response to a reinforcement manoeuvre, a forceful neck flexion against resistance (Table 2). Residual inhibitory supraspinal influence was assessed by evoking foot withdrawal by non-noxious mechanical plantar stimulation without and then with the volitional attempt to suppress the response (Table 2).
Table 2.
Neurophysiological evaluation of translesional influence
| Reinforcement (neck flexion) |
Volitional suppression of foot withdrawal reflex |
10-s sample of rhythmic EMG patterns generated by SCS |
||||||||
|---|---|---|---|---|---|---|---|---|---|---|
| Subject | Number of activated muscles (max = 5 + 5) |
% of reduction* |
Locomotor-like |
Rhythmic co-activation across all muscles |
Other mixed-synergy patterns |
|||||
| Right | Left | Right | Left | Right | Left | Right | Left | Right | Left | |
| 1 | 0 | 0 | 16 | 33 | x | x | ||||
| 2 | 5 | 5 | 29 | 13 | x | x | x | |||
| 3 | 5 | 5 | 16 | 20 | x | x | ||||
| 4 | 0 | 0 | 6 | 32 | x | x | x | x | ||
| 5 | 5 | 5 | 43 | 22 | x | x | x | x | ||
| 6 | 0 | 0 | 60 | 29 | x | |||||
| 7 | 2 | 2 | 12 | 0 | x | x | x | x | ||
| 8 | 0 | 0 | 48 | 0 | ||||||
| 9 | 5 | 0 | 18 | 1 | ||||||
| 10 | 4 | 4 | −** | −** | ||||||
*Reduction of root mean squares of EMG activity; **Subject 10 did not respond to plantar stimulation.
x = pattern present.
Spinal cord stimulation system
All subjects had SCS systems implanted for the control of spinal spasticity affecting the legs (Pinter et al., 2000). The system included a linear electrode array (Pisces-Quad electrode, Model 3487A, Medtronic), connected to either an external test stimulator (Model 3625 Test Stimulator, Medtronic), or an implanted pulse generator (Itrel 3, Model 7425, Medtronic). The electrode array consisted of four evenly spaced ring electrodes, each 1.27 mm in diameter and 3 mm long, with an interelectrode spacing of 6 mm. For their identification, these contacts will be referred to as 0 to 3, 0 being the most rostral. The electrode array was placed in the dorsal epidural space. Target position was over the midline of the lumbar spinal cord and, across the subjects, the vertebral levels of the electrode positions ranged from T11 to L1. The stimulators delivered monophasic rectangular constant-voltage pulses of 210-µs width, each followed by a longer second phase of small amplitude to adjust charge balance for each stimulus and avoid delivery of direct current (Rattay et al., 2000). Available stimulation frequencies were 2–130 Hz, and intensities up to 10.5 V. Electrode impedance of the SCS system is ∼1000 Ω (Minassian et al., 2004). Each electrode of the array could be set as cathode (‘–’), anode (‘+’), or to be inactive, allowing for various bipolar electrode combinations. Monopolar stimulation was carried out with one of the electrodes selected as cathode and the active area on the implanted pulse generator case (‘c’) as anode. The rostro-caudal positions of the active cathode with respect to the spinal cord segments were estimated based on the relative thresholds of posterior root-muscle reflexes electromyographically recorded as stimulus time-locked compound muscle action potentials from quadriceps and triceps surae elicited by 2-Hz stimulation. Lower thresholds of posterior root-muscle reflexes in quadriceps than in triceps surae indicate cathode positions over the L2–L4 lumbar spinal cord segments, equal thresholds a cathode over the L5–S2 lumbosacral segments, and lower thresholds in triceps surae a cathode caudal to the S2 segment (Minassian et al., 2007).
Electromyographic recordings
SCS-induced surface EMG activity was acquired from the quadriceps, hamstrings, tibialis anterior, and triceps surae muscles bilaterally using pairs of silver-silver chloride recording electrodes (Intec Medizintechnik), each placed centrally over the muscle bellies and oriented along the long axis of the muscles with an interelectrode distance of 3 cm. Additional EMG recordings were taken from the lumbar paraspinal trunk muscles. Abrasive paste (Nuprep, Weaver and Company) was used for skin preparation to reduce contact resistance. EMG signals were amplified (Grass Instruments) with a gain of 2000 and filtered to a bandwidth of 30–700 Hz. Data were digitized at 2002 samples per second and channel using a Codas ADC system (Dataq Instruments).
Study protocol
Subjects were lying supine on an examination bed. For a given combination of active electrodes, stimulation was initially applied at the lowest frequency available, and the stimulus intensity was increased in 1 V increments until posterior root-muscle reflexes were detected electromyographically in quadriceps, hamstrings, tibialis anterior, and triceps surae bilaterally. At this intensity, the stimulation frequency was increased step-wise, including frequencies around 5, 10, 16, 21, 25, 31 and 40 Hz. The exact stimulation frequencies were monitored by recording stimulation artefacts via the paraspinal EMG electrodes. The frequency variation was repeated for higher intensities up to a maximum of 10 V. Subsequently, stimulus intensity and frequency variation were repeated for different active electrode combinations. For each subject, data from two separate recording sessions were analysed.
Data selection
Ten-second segments of unilateral rhythmic EMG activity elicited by SCS in quadriceps, hamstrings, tibialis anterior, and triceps surae with established and consistent rhythmicity were selected from the data pool on the basis of the quality of rhythmicity across the four unilateral muscles. Right and left legs were analysed independently. From each data section with unchanged stimulation parameters, all 10-s segments, each shifted by one interstimulus interval, were extracted. The SCS-induced EMG activities were series of stimulus time-related posterior root-muscle reflexes (Minassian et al., 2004) that can be normally identified as separate responses for SCS frequencies of up to 40 Hz (Figs. 1A and B). Envelopes of the EMG data were thus calculated from the peak-to-peak amplitudes of the series of posterior root-muscle reflexes (Fig. 1A). The ranking parameter r of each 10-s segment of rhythmic EMG activity was calculated as r = max(fQ)·max(fHam)·max(fTA)·max(fTS), where f is the frequency spectrum between 0.2 Hz and 3 Hz of the EMG envelope of the respective muscles (Q, quadripceps; Ham, hamstrings; TA, tibialis anterior; TS, triceps surae). All 10-s segments of a recording session were sorted according to their r-values. Samples with the highest r-values of each recording session were visually inspected and finally selected for further analysis so that only one example of a given EMG pattern was chosen from a recording segment with unchanged stimulation parameters.
Figure 1.

Non-negative matrix factorization (NMF): data preparation and interpretation of the basic patterns and weights. Construction of EMG profiles that served as input data for the NMF, shown for tibialis anterior (A–E). (A) Envelopes of the selected rhythmic EMG segments were calculated from peak-to-peak amplitudes of series of responses. (B) Section of same EMG trace with enlarged time-scale shows that bursts are comprised of modulating reflex-compound muscle action potentials time-related to the stimulus pulses (stim.). (C) Low-pass filtered envelopes of the same tibialis anterior bursts were used to define the cycles and their separation into extension- (Ext) and flexion-like (Fl) phases. (D) Filtered envelopes of all complete cycles within the 10-s sample. These subdivisions were extrapolated to 100 data points for the Ext and Fl phase each, amplitude normalized, and averaged to construct the EMG profile (E). Calculated for all muscles and samples, these EMG profiles (X) served as the input to the NMF (F). The NMF identifies a preselected number of k basic patterns (P) and their weights (W), the latter specifying the contribution of each basic pattern to a given EMG profile. The various EMG profiles (black solid lines) can be approximated (dotted lines) by the weighted sum of the small number of basic patterns, which represent common underlying temporal components. are individual basic patterns, and their weights, consecutively numbered by index j.
Decomposition of rhythmic EMG activities
A dimensionality reduction technique was applied to the EMG profile of each muscle of the selected 10-s segments to identify basic patterns underlying the muscle activation. To construct the EMG profiles, the EMG envelopes were low-pass filtered (zero-phase Equiripple filter: Fpass = 0.125, Fstop = 0.167 normalized frequency units, Apass = 2, Astop = 5 dB; Fig. 1C) and separated into subdivisions, each covering a complete cycle of rhythmic activity. Periods of tibialis anterior activity were used to define the flexion-like phases based on the hypothesis that the uniarticular tibialis anterior would be explicitly controlled by a flexor-related drive. Indeed, previous findings have shown that phases of tibialis anterior activity separated SCS-induced rhythmic activity into two different functionally organized phases (Minassian et al., 2004, 2007; Danner et al., 2013). The cycles of rhythmic activity were defined as the intervals between the ends of successive tibialis anterior bursts. The flexion phase of rhythmic activity was defined as the time between the onset and end of each tibialis anterior burst, and the remaining phase of the cycle as the extension phase. The onset of a tibialis anterior burst was the time when the data of the low-pass filtered EMG envelope exceeded the local minimum preceding the burst by 50% of the difference between the peak value of the burst and this local minimum (Fig. 1C). The end of a tibialis anterior burst was defined accordingly. Each subdivision of the EMG envelopes was extrapolated to 200 data points, 100 values for the extension and the flexion phase, each. The phase normalization was required because of the considerable variation of the relative extension- and flexion-phase durations observed across samples. These data were normalized to the peak-amplitude. The EMG profiles resulted from averaging the individual traces of all complete cycles detected within the 10-s segments (Fig. 1D and E).
Each of the selected 10-s segments of rhythmic activity provided four EMG profiles. The EMG profiles of all selected data segments were assembled into a matrix X (with each column being an EMG profile) that served as input for the non-negative matrix factorization (NMF; cf. supporting online material for Dominici et al., 2011). The aim was to test whether the EMG profiles of the rhythmic lower-limb activities could be closely reconstructed by linear combinations of a small number of non-negative basic activation patterns (Fig. 1F).
NMF is a method that factorizes a matrix X into two matrices, P and W, NMF(X, k) → P·W, so that X = P·W + e, and |e| → min, where P consists of a predefined number of k basic activation patterns (activation timing profiles, primitives, shared activation pattern) and W is the matrix of weights (loadings). X is an n × m, P an n × k and W a k × m matrix, with n = 200, i.e. the count of data points (time samples) of each EMG profile, and m the number (index) of the EMG profiles. All matrices are non-negative. Models using 1–8 basic activation patterns were analysed here. The coefficient of determination (R2) and the Akaike Information Criterion with correction for finite sample sizes (AICC; Akaike, 1974; Burnham and Anderson, 2002) were calculated to assess the model’s goodness of fit. The AICC is rooted in information theory and represents an estimate of the relative information loss by representing the process underlying the data with a given model (Burnham and Anderson, 2002).
Statistical analysis
Mean values were compared using Student’s t-tests or analyses of variance. Categorical data were analysed using Pearson’s χ2-test. Pearson’s product moment correlations were calculated to investigate the relation of two scalar values and linear regressions were calculated to investigate whether one scalar value predicts the outcome of another. Similarly, logistic regressions were used to analyse scalar predictors on categorical values. If model assumptions were not met, their respective non-parametric equivalents were used. All post hoc tests were Bonferroni corrected. An α-error of P < 0.05 was regarded as significant.
Results
Sustained epidural stimulation induced rhythmic EMG activity in quadriceps, hamstrings, tibialis anterior, and triceps surae with various synchronous and reciprocal relationships between the muscles. We identified 39 samples of 10 s duration with rhythmic activity generated in all recorded muscle groups of one limb. Figure 2 gives four examples with different patterns and cycle durations. The rhythmic patterns were found in Subjects 1–7 (Tables 1 and 2). Some rhythmic activity was observed in Subjects 8–10 as well, but failed to persist for the required 10 s or was not present in all four muscles. Remaining subclinical supraspinal influence over lumbosacral spinal motor excitability was not related to the occurrence of rhythmic muscle activation (cf. Table 2). In 23 of 39 samples, rhythmic activity was expressed unilaterally only, with the muscles of the contralateral leg showing either unmodulated or irregularly modulated motor output. The unilateral samples of rhythmic activity were found on the side with lower posterior root-muscle reflex thresholds in 16 cases and on the side with the higher thresholds only once.
Figure 2.

Example 10-s segments of rhythmic EMG activity evoked by epidural spinal cord stimulation in quadriceps, hamstrings, tibialis anterior, and triceps surae. (A) Subject 2, right side, electrode pairing and polarity of 0+ and 1−, 7 V, 30.1 Hz; (B) Subject 3, left side, electrodes 0+ and 3−, 10 V, 22.5 Hz; (C) Subject 4, left side, electrodes 0+ and 3−, 6 V, 31.5 Hz; (D) Subject 2, right side, electrodes 1+ and 3−, 10 V, 27.7 Hz.
Rhythmic patterns could be elicited by stimulation using either bipolar or monopolar configurations. The effective cathode location was over the L2–L4 spinal cord segments in 34 cases, over L5–S2 in four cases, and caudal to S2 in one case. The mean relative stimulus intensity evoking the rhythmic patterns was 2.8 ± 1.1 times the posterior root-muscle reflex threshold of quadriceps and the mean SCS frequency was 29.5 ± 4.85 Hz, with a minimum of 22.5 Hz.
The burst-like activity had a constant phase relation between the muscles within each sample. The burst frequency was 0.71 ± 0.41 Hz, and varied between samples from 0.27 Hz to 1.84 Hz. An analysis of variance revealed significant interindividual differences of the burst frequency [F(6,32) = 6.551, P < 0.001]. Subject 5 had significantly higher frequencies than Subjects 1–4, whereas all other post hoc tests did not yield significant results. The burst frequency was not significantly correlated with the applied SCS frequency (r = 0.125, P = 0.450), but was predicted by the relative stimulation intensity [constant: B = 0.414, SE = 0.188; intensity: B = 0.105, SE = 0.062, β = 0.269, t(37) = 1.697, P = 0.098, R2 = 0.072], although not significantly, with a tendency of increased burst frequencies with increasing stimulation intensity.
Extension- and flexion-phase durations amounted to 1.29 ± 0.75 s and 0.59 ± 0.27 s, respectively, with relative extension-phase durations of 65.6 ± 10.4% of the full cycle durations. A linear regression showed that the cycle duration predicted the absolute duration of the extension phase [constant: B = −0.163, SE = 0.062; cycle duration: B = 0.775, SE = 0.030, β = 0.974, t(37) = 26.243, P < 0.001; R2 = 0.949] and flexion phase [constant: B = 0.163, SE = 0.062; cycle duration: B = 0.225, SE = 0.030, β = 0.782, t(37) = 7.633, P < 0.001; R2 = 0.612] as well as the relative extension-phase duration [constant: B = 0.527, SE = 0.030; cycle duration: B = 0.069, SE = 0.014; β = 0.624, t(37) = 4.855, P < 0.001; R2 = 0.389]. Thus, with longer cycle durations the absolute extension- and flexion-phase durations increased with different slopes (Fig. 3A), and the relative extension-phase duration increased while the relative flexion-phase duration decreased (Fig. 3B).
Figure 3.
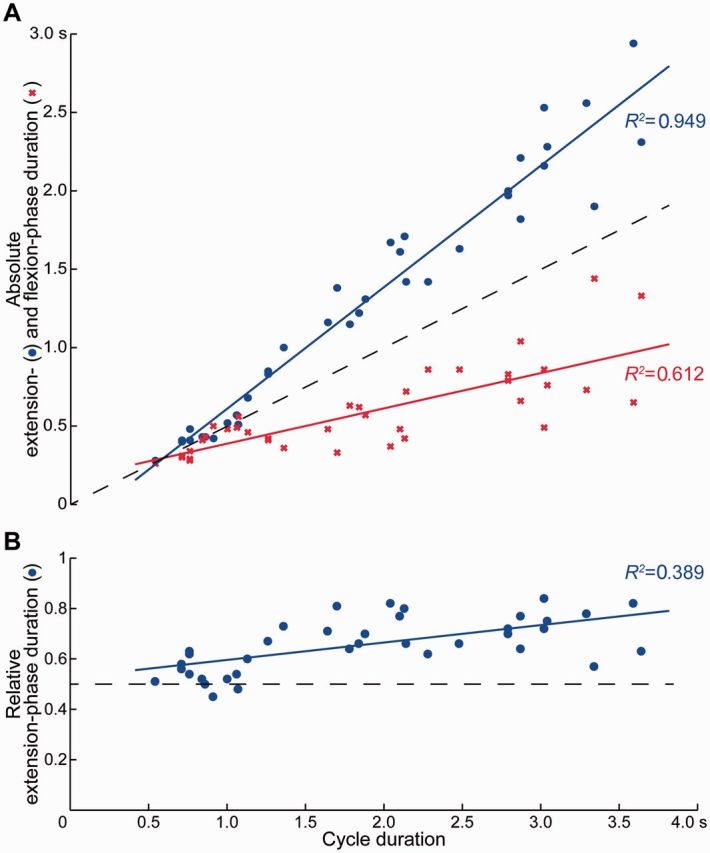
Relation between cycle duration and (A) absolute extension- and flexion-phase duration as well as (B) relative extension-phase duration of spinal cord stimulation-induced rhythmic activity. Solid lines are regression lines fitted to the observed data. Dashed lines indicate changes of cycle duration with equal extension- and flexion-phase durations.
A variety of rhythmic EMG patterns was intra- and interindividually generated. Each muscle normally displayed one major burst per cycle of rhythmic activity (e.g. Fig. 2A), with few examples of more complex patterns (e.g. Fig. 2D). Correlation of the EMG envelopes showed that, with respect to the tibialis anterior activity, the burst-like activities of the other ipsilateral muscles were largely coordinated either synchronously or alternatingly. Quadriceps were coactive with tibialis anterior in 69% of all 10-s segments of rhythmic activity, hamstrings with tibialis anterior in 36% and triceps surae with tibialis anterior in 38%. A logistic regression model showed that SCS frequency did not predict the phase-relation of the activity in either muscle group with the tibialis anterior bursts, nor between quadriceps and hamstrings bursts. On the other hand, stimulation intensity predicted the coactivation of triceps surae with tibialis anterior [constant: B = 3.424, SE = 1.250; intensity: B = −1.140, SE = 0.416, Cox and Snell R2 = 0.227, odds ratio = 0.320, χ2(1) = 10.019, P = 0.002], i.e. increasing the relative stimulation intensities increased the probability of generating alternating rhythmic activation of tibialis anterior and triceps surae.
All possible permutations of alternating or synchronous relations between rhythmic activities of quadriceps, hamstrings and triceps surae with respect to tibialis anterior were found, except for the pattern with quadriceps in reciprocity with the other muscles. The various patterns were not consistently generated across subjects (Table 2). Rhythmic coactivation of all unilateral muscle groups (Fig. 2A) was the most common pattern (n = 15). The remaining patterns occurred two to five times each. ‘Locomotor-like’ patterns with alternating activation of antagonists (Fig. 2B) were found four times. They were generated in Subjects 2, 3 and 5, i.e. those subjects with the most widespread activation of lower-limb muscles by a reinforcement manoeuvre. All locomotor-like patterns were generated with the cathode over the L2–L4 spinal cord segments, at frequencies of 25.5 Hz (n = 3) and 30.1 Hz, and relative stimulus intensities of 3.3 and 4.5 times the posterior root-muscle reflex threshold of quadriceps (n = 2, each).
Decomposition of the EMG patterns
NMF of the pooled data including all EMG profiles (n = 156) demonstrated that the variety of EMG patterns could be closely reproduced by linear combinations of a small number of basic activation patterns with muscle- and sample-specific weights (cf. Fig. 1F). According to the AICC and the Akaike weights AICw (Table 3), the model based on three basic activation patterns (k = 3) had the highest relative probability of all calculated models to best represent the process that had generated the data. The second best solution was the k = 4 model. All other solutions were judged as unlikely.
Table 3.
Goodness of fit measures of the NMF models
| K | R2 | AICC | ΔAIC | AICw |
|---|---|---|---|---|
| 1 | 0.261 | 831.884 | 818.019 | 0.000 |
| 2 | 0.832 | 111.085 | 97.221 | 0.000 |
| 3 | 0.908 | 13.864 | 0.000 | 0.998 |
| 4 | 0.944 | 19.922 | 6.058 | 0.002 |
| 5 | 0.968 | 121.588 | 107.724 | 0.000 |
| 6 | 0.979 | 251.915 | 238.051 | 0.000 |
| 7 | 0.985 | 407.198 | 393.334 | 0.000 |
| 8 | 0.987 | 468.902 | 455.037 | 0.000 |
k = number of basic activation patterns of the non-negative matrix factorization (NMF) model; R2 = coefficient of determination; AICC = Akaike Information Criterion with correction; AICw = Akaike weights.
Nonetheless, the model with only two basic activation patterns explained 83% of the total variance across the EMG profiles of all rhythmic samples (R2 in Table 3). The two basic patterns were of sinusoidal-like shapes and had an alternating temporal structure, with the first basic pattern, , peaking at 60% of the extension phase, and the second one, , at 55% of the flexion phase, respectively (Fig. 4A, Model k = 2; pk,j is the j-th basic pattern of model k). The weights of these two basic activation patterns, required to reconstruct the various EMG profiles, had a highly significant negative correlation (Fig. 4B, Model k = 2).
Figure 4.

Basic activation patterns and relations between their weights identified by non-negative matrix factorization from the pooled EMG-profile data across all subjects, muscles and samples of rhythmic EMG patterns. (A) Amplitude-normalized basic activation patterns shown for the models with k = 2, 3, and 4, ordered according to the relative timing of their peaks. (B) Negative (lines ending with small filled circles) and positive (lines ending with arrowheads) correlations between the weights of different basic activation patterns within each model indicate the tendency of reciprocal or simultaneous loading of two patterns. (C) Positive correlations in-between models, informing on preservation or splitting of basic activation patterns with increasing number of k. In B and C, only (Bonferroni corrected) correlations with P < 0.05 are illustrated. Index j in and enumerates the basic activation patterns based on their peak-timing; Ext = extension and Fl = flexion phase.
The k = 3 model identified a basic activation pattern that peaked at 56% of the extension phase, and a second and third basic pattern that peaked at 15% and 74% of the flexion phase, respectively (Fig. 4A, Model k = 3). The first and third basic patterns closely resembled and , and the highly significant negative correlation between their weights was retained (Fig. 4B, Model k = 3). The weights of the second basic pattern that peaked during early flexion were not significantly correlated to those of either or .
Comparison between the k = 3 and k = 2 models demonstrated a highly significant positive correlation between the weights of and with those of the respective basic extensor and flexor activation patterns of the lower-order model, respectively (Fig. 4C). Further, there was a near-even relationship between the weights of the early flexor component with those of both, the extensor and flexor components of the k = 2 model. Hence, muscle activations explained by the additional early flexor component of the k = 3 model were otherwise approximated by the basic extensor or flexor component in the lower-order model.
The four-basic-pattern solution was characterized by a new component, , with its maximum at 15% of the extension phase (Fig. 4A, Model k = 4). The second basic pattern peaked at 61% of the extension phase, and the third and fourth basic activation patterns were almost identical to the two flexor components of the k = 3 model and peaked at 14% and 72% of the flexion phase, respectively. There was a highly significant positive correlation between the weights of the two extensor components and a highly significant negative correlation between the weights of these two patterns with the weights of the late flexor pattern (Fig. 4B, Model k = 4). As in case of the k = 3 model, the weights of the early flexor pattern were not significantly correlated to those of either of the other basic patterns. Correlations of weights between models suggested that the basic activation patterns of the lower-order models were retained in the k = 4 model, and the new pattern was related to the basic extensor pattern of the k = 3 and k = 2 models (Fig. 4C).
Across the variety of rhythmic EMG patterns, the basic extensor pattern of the k = 2 model preferentially loaded on the hamstrings and triceps surae muscle groups and least on tibialis anterior, whereas there was no muscle-specificity of the basic flexor pattern apart from the bias to contribute to the tibialis anterior activity (Fig. 5). These relations of weights were retained across the k = 3 and k = 4 models. The early flexor pattern was more preferentially distributed to hamstrings than to quadriceps and triceps surae (Fig. 5, and ). The relative distributions to the muscles were similar for the first two basic patterns of the k = 4 model that peaked during the extension phase.
Figure 5.

Correlations between weights of a given basic activation pattern across muscles and all selected EMG samples. Relations are given for the models with k = 2, 3, and 4 basic activation patterns for quadriceps (Q), hamstrings (Ham), tibialis anterior (TA), and triceps surae (TS). Bars indicate group mean and standard error, normalized to the individual maximum weight of the respective basic activation pattern and model. Index j in enumerates the basic activation patterns based on their peak-timing. All group tests P < 0.001, asterisks indicate significant post hoc tests: *P < 0.05, **P < 0.01, ***P < 0.001.
Discussion
We studied rhythmic EMG patterns produced by the functionally isolated human lumbar spinal cord under repetitive, constant electrical stimulation. They included a variety of coactivation, mixed synergy and locomotor-like patterns with a range of burst frequencies. Statistical decomposition of the EMG profiles across subjects, muscles, and the various rhythmic patterns revealed a common, flexible functional organization of their underlying spinal interneuronal circuitry.
Central and peripheral influences upon the lumbar spinal cord circuitry
Some subclinical residual excitatory and/or inhibitory translesional influence on the excitability of the lumbosacral spinal cord circuitry was detected in all subjects studied here (Table 2). This observation suggests that some descending long-tract fibres or propriospinal connections transiting the lesion may have survived their spinal cord injury clinically classified as motor complete, as shown possible in earlier studies neuropathologically (Kakulas, 2004) and neurophysiologically (Sherwood et al., 1992; McKay et al., 2004). Such residual influence was not a decisive component for the generation of the rhythmic patterns in response to SCS. The absence of consistent rhythmic EMG patterns in Subjects 8–10 might have been due to individual differences in the state of the spinal networks (cf. Harkema, 2008). Nevertheless, the three individuals in whom locomotor-like EMG patterns were generated (Subjects 2, 3 and 5) most probably had the highest level of base excitatory supraspinal support of the lumbar circuitry (Table 2, reinforcement).
The lumbosacral neural circuits received sensory input from the legs, yet adapted to the supine position, where hip-joint extension is limited and axial leg loads are absent. Thus, sensory information otherwise signalling phase transitions in the locomotor cycle and entraining the step frequency both in the chronic spinal cat (Grillner and Rossignol, 1978; Hultborn and Nielsen, 2007) and in people with motor-complete spinal cord injury (Dobkin et al., 1995; Harkema et al., 1997; Dietz et al., 2002) were not provided. Additionally, antidromic volleys generated by SCS block or mitigate peripheral feedback. Thus, we obtained a model to study central spinal locomotor mechanisms, i.e. a model approximating immobilized, ‘fictive’ locomotion (cf. Pearson and Gordon, 2013) with the constraints inherent to human studies. An additional yet conceptually different step would be to investigate rhythmogenesis and its interaction with sensory feedback by allowing movement to occur with minimal mechanical constraints (Gurfinkel et al., 1998; Selionov et al., 2009). Physiologically appropriate phasic afferent feedback could have coordinated our motor outputs into more locomotor-like patterns (cf. Fedirchuk et al., 1998).
Neural processes initiated by spinal cord stimulation
In individuals with motor-complete spinal cord injury, SCS-effects upon lower-limb muscle activation are initiated by bilateral stimulation of afferent fibres within posterior rootlets/roots of several lumbar spinal cord segments (Rattay et al., 2000; Minassian et al., 2007; Angeli et al., 2014) and the subsequent trans-synaptic activation of motor neurons and spinal circuitry (Minassian et al., 2004; Capogrosso et al., 2013). The rhythmic EMG patterns reported here were strictly composed of series of stimulus-triggered, modulating responses. We have previously proposed that repetitive SCS activates spinal interneuronal circuits that in turn modulate the concomitantly elicited posterior root-muscle reflexes (Minassian et al., 2004, 2007; cf. Degtyarenko et al., 1998; Kinoshita and Yamaguchi, 2001).
Effects of spinal cord stimulation parameters
Eighty-seven per cent of the rhythmic EMG segments were generated with the cathode over the L2–L4 spinal cord segments. The role of these segments in the generation of rhythmic motor patterns was previously recognized (Dimitrijevic et al., 1998; Shapkova, 2004). Either the L2–L4 posterior-root fibres have specifically effective projections onto the circuitry that generated the rhythmic outputs, or key elements of these functional neural networks are located within these segments (Grillner, 2006). Moreover, 59% of the rhythmic EMG patterns described here were only expressed unilaterally, supporting earlier indications that side-specific rhythm-generating networks exist bilaterally in the human spinal cord (Yang et al., 2005).
Increasing stimulus intensities significantly increased the odds of changing the EMG pattern from synchronous bursts of activity across all ipsilateral muscles to any other type of pattern. The elicitation of synchronous activity in antagonists may suggest that elements of the spinal locomotor network were not evenly activated (Fedirchuk et al., 1998). This view is also supported by the observation that fictive locomotion often starts with synchronous activity in flexor and extensor nerves and then with time, the interneuronal network organizes itself to generate flexor-extensor alternation (Meehan et al., 2012).
The minimum stimulation frequency needed to elicit rhythmic EMG patterns was 22.5 Hz, suggesting that certain repetition rates of inputs and subsequent temporal and spatial synaptic summation processes were required to activate the rhythm-generating networks. Yet, the stimulation frequency alone neither determined the burst frequency nor the specific phase coordination of the generated motor outputs to the different muscles. A similar effective SCS-frequency range of 25–50 Hz was reported previously (Dimitrijevic et al., 1998; Gerasimenko et al., 2002). Such frequencies also facilitate rhythmic activity generated by step-related feedback during assisted treadmill stepping (Minassian et al., 2005; Harkema et al., 2011) and may enable synergistic lower limb movements initiated by residual supraspinal influence (Angeli et al., 2014). Shapkova (2004) found two ranges of stimulation frequencies, 3–12 Hz and 20–30 Hz, to be effective in inducing fast air-stepping in paraplegic children lying supine with their legs elastically suspended in a semi-flexed position. The latter is close to the frequency range reported here and probably induced similar rhythm generating mechanisms. The lower frequencies would have evoked strong twitch-contractions (cf. Murg et al., 2000; Jilge et al., 2004; Sayenko et al., 2014) that together with the suspension may have resulted in the fast oscillatory movements described by Shapkova and Schomburg (2001).
Rhythm generation
The burst frequency of the SCS-induced output patterns appeared centrally determined as no timing information through the stimulation was provided. The observed interindividual differences suggest that the operation of the rhythm generator also depends on its central state of excitability. The wide range of burst frequencies of 0.27–1.84 Hz covered different rhythmic behaviours. The lower range was similar to the burst frequencies of spinal myoclonus of 0.3–0.6 Hz (Bussel et al., 1988; Calancie, 2006). The mean burst frequency of 0.71 ± 0.41 Hz was close to that of slow gait of adults (0.77 Hz, 1.54 step/s, 2.6 km/h) and the upper range of frequencies included fast gait (1.31 Hz, 2.61 steps/s, 6.0 km/h; Oberg et al., 1993).
The longer mean extension- than flexion-phase durations and the adaptation to decreasing cycle durations by decreasing relative extension phase durations suggest that the ‘asymmetric alternating activity’ (Grillner, 2006) characteristic of terrestrial locomotion, including human gait (Murray, 1967), may be at least partially controlled at the spinal level in humans.
Pattern generation
In studies of the modular organization of locomotor control, a motor module is considered a functional unit of the CNS producing specific motor outputs and, computationally seen, consists of a basic activation pattern along with its variable weights of distribution to different muscles (Clark et al., 2010; Dominici et al., 2011; Fox et al., 2013). It is assumed that motor modules are largely controlled by brainstem and spinal networks (Fox et al., 2013; Giszter and Hart, 2013). Yet, in studies of volitional locomotor tasks, cortical modulation (Dominici et al., 2011) and diverse locomotor behaviours (Zelik et al., 2014) contribute to the underlying motor modules, with further influence from step-related sensory feedback and biomechanical events of the gait cycle (Ivanenko et al., 2003). Here, the absence of such influences allows the basic activation patterns to be interpreted as intrinsic spinal drives (Dominici et al., 2011; Giszter and Hart, 2013), generated by spinal networks in response to the ongoing epidural stimulation.
The sinusoidal-like basic activation patterns identified by the two-pattern NMF model represent alternating bursts of activity. When reciprocally distributed to muscles, they describe patterns similar to alternating activity in extensor and flexor nerves recorded during fictive locomotion in experimentally reduced animal models (Hägglund et al., 2013). This similarity may suggest that the two basic activation patterns were generated by analogous spinal circuits as in other mammals (Grillner, 2011) and relate to the drives of extensor- and flexor-burst generators. Yet, each of the basic patterns contributed to the activation of several muscles in agonistic relationships as well. The two elementary extensor and flexor patterns were retained and further individualized across the NMF models with three and four basic activation patterns. The additional basic activation pattern that peaked in the early flexion phase explained muscle activations that, in the two-pattern model, were shaped by either extensor or flexor drives. Yet, within the higher-order models, it loaded independently from the basic extensor and flexor patterns and was characteristically associated with hamstrings activation. Together, these results are reminiscent of the complex central activation patterns of posterior biceps and semitendinosus muscles during fictive locomotion in reduced animal preparations (McCrea and Rybak, 2008; Guertin, 2009). The additional activation pattern identified by the four-pattern model resulted from the basic extensor pattern of the lower order models and mainly added details to the shapes of rhythmic EMG activities peaking during the extension-like phases.
Flexible organization of burst-generating elements
The basic patterns identified here resemble those underlying volitional locomotion in toddlers as well as adult rhesus monkeys, cats, rats, and guinea fowls (Dominici et al., 2011). In volitional locomotion, the distribution of the basic activation patterns to the muscles is invariantly specified by the motor task. Here, all bifunctional muscle groups could be driven by both, extensor- and flexor-related basic patterns—simultaneously or reciprocally—with their respective contributions varying between samples. This implies that the burst-generating elements driving the motor neuron pools are modularly organized and are flexibly combined to produce a variety of rhythmic patterns. Similarly, various types of fictive motor patterns were observed in the acutely spinalized marmoset monkey including alternating as well as synchronous activity in flexor and extensor nerves (Fedirchuk et al., 1998). These activities were interpreted as ‘component fictive patterns’, which if combined would resemble a true locomotor pattern.
In conclusion, the functionally isolated human lumbosacral spinal cord can organize a rich repertoire of rhythmic output patterns to leg muscles in response to repetitive, constant stimulation. This range of rhythmic patterns can be explained by variable combinations of a small number of common spinal neural drives, each with a distinct temporal structure, and may be realized by multiple burst generators with modifiable connection strengths, determining reciprocities and phase lags of the rhythmic drives (Grillner, 2006; Hägglund et al., 2013). To use this remarkable capability and flexibility of the spared, sublesional lumbosacral spinal networks, neurorehabilitation approaches should consequently target the configuration of the burst-generating elements in order to incorporate specific adaptations to gait and stance.
Acknowledgements
We would like to express our appreciation to Milan R. Dimitrijevic and W. Barry McKay for critical reading of the manuscript and Renate Preinfalk and Maria Auer for data collection.
Glossary
Abbreviations
- NMF
non-negative matrix factorization
- SCS
spinal cord stimulation
Funding
Vienna Science and Technology Fund (WWTF), grant number LS11-057, Wings for Life Spinal Cord Research Foundation, grant number WFL-AT-007/11, and Austrian Science Fund (FWF), grant number L512-N13.
References
- Akaike H. A new look at the statistical model identification. IEEE Trans Automat Contr. 1974;19:716–23. [Google Scholar]
- Angeli CA, Edgerton VR, Gerasimenko YP, Harkema SJ. Altering spinal cord excitability enables voluntary movements after chronic complete paralysis in humans. Brain. 2014;137:1394–409. doi: 10.1093/brain/awu038. [DOI] [PMC free article] [PubMed] [Google Scholar]
- Brown TG. The intrinsic factors in the act of progression in the mammal. Proc R Soc Lond B. 1911;84:308–19. [Google Scholar]
- Burnham KP, Anderson DR. Model selection and multimodel inference: a practical information-theoretic approach. 2nd edn. New York: Springer; 2002. [Google Scholar]
- Burke RE, Degtyarenko AM, Simon ES. Patterns of locomotor drive to motoneurons and last-order interneurons: clues to the structure of the CPG. J Neurophysiol. 2001;86:447–62. doi: 10.1152/jn.2001.86.1.447. [DOI] [PubMed] [Google Scholar]
- Bussel B, Roby-Brami A, Azouvi P, Biraben A, Yakovleff A, Held JP. Myoclonus in a patient with spinal cord transection. Possible involvement of the spinal stepping generator. Brain. 1988;111:1235–45. doi: 10.1093/brain/111.5.1235. [DOI] [PubMed] [Google Scholar]
- Calancie B. Spinal myoclonus after spinal cord injury. J Spinal Cord Med. 2006;29:413–24. doi: 10.1080/10790268.2006.11753891. [DOI] [PMC free article] [PubMed] [Google Scholar]
- Calancie B, Needham-Shropshire B, Jacobs P, Willer K, Zych G, Green BA. Involuntary stepping after chronic spinal cord injury. Evidence for a central rhythm generator for locomotion in man. Brain. 1994;117:1143–59. doi: 10.1093/brain/117.5.1143. [DOI] [PubMed] [Google Scholar]
- Capogrosso M, Wenger N, Raspopovic S, Musienko P, Beauparlant J, Bassi Luciani L, et al. A computational model for epidural electrical stimulation of spinal sensorimotor circuits. J Neurosci. 2013;33:19326–40. doi: 10.1523/JNEUROSCI.1688-13.2013. [DOI] [PMC free article] [PubMed] [Google Scholar]
- Clark DJ, Ting LH, Zajac FE, Neptune RR, Kautz SA. Merging of healthy motor modules predicts reduced locomotor performance and muscle coordination complexity post-stroke. J Neurophysiol. 2010;103:844–57. doi: 10.1152/jn.00825.2009. [DOI] [PMC free article] [PubMed] [Google Scholar]
- Danner SM, Rattay F, Hofstoetter US, Dimitrijevic MR, Minassian K. Locomotor rhythm and pattern generating networks of the human lumbar spinal cord: an electrophysiological and computer modeling study. BMC Neurosci. 2013;14(Suppl 1):S274. doi: 10.1515/bmt-2013-4012. [DOI] [PubMed] [Google Scholar]
- Degtyarenko AM, Simon ES, Burke RE. Locomotor modulation of disynaptic EPSPs from the mesencephalic locomotor region in cat motoneurons. J Neurophysiol. 1998;80:3284–96. doi: 10.1152/jn.1998.80.6.3284. [DOI] [PubMed] [Google Scholar]
- Dietz V, Müller R, Colombo G. Locomotor activity in spinal man: significance of afferent input from joint and load receptors. Brain. 2002;125:2626–34. doi: 10.1093/brain/awf273. [DOI] [PubMed] [Google Scholar]
- Dimitrijevic MR, Gerasimenko Y, Pinter MM. Evidence for a spinal central pattern generator in humans. Ann N Y Acad Sci. 1998;860:360–76. doi: 10.1111/j.1749-6632.1998.tb09062.x. [DOI] [PubMed] [Google Scholar]
- Dobkin BH, Harkema S, Requejo P, Edgerton VR. Modulation of locomotor-like EMG activity in subjects with complete and incomplete spinal cord injury. J Neurol Rehabil. 1995;9:183–90. [PubMed] [Google Scholar]
- Dominici N, Ivanenko YP, Cappellini G, d'Avella A, Mondì V, Cicchese M, et al. Locomotor primitives in newborn babies and their development. Science. 2011;334:997–9. doi: 10.1126/science.1210617. [DOI] [PubMed] [Google Scholar]
- Duysens J, Van de Crommert HW. Neural control of locomotion: the central pattern generator from cats to humans. Gait Posture. 1998;7:131–41. doi: 10.1016/s0966-6362(97)00042-8. [DOI] [PubMed] [Google Scholar]
- Duysens J, De Groote F, Jonkers I. The flexion synergy, mother of all synergies and father of new models of gait. Front Comput Neurosci. 2013;7:14. doi: 10.3389/fncom.2013.00014. [DOI] [PMC free article] [PubMed] [Google Scholar]
- Fedirchuk B, Nielsen J, Petersen N, Hultborn H. Pharmacologically evoked fictive motor patterns in the acutely spinalized marmoset monkey (Callithrix jacchus) Exp Brain Res. 1998;122:351–61. doi: 10.1007/s002210050523. [DOI] [PubMed] [Google Scholar]
- Fox EJ, Tester NJ, Kautz SA, Howland DR, Clark DJ, Garvan C, et al. Modular control of varied locomotor tasks in children with incomplete spinal cord injuries. J Neurophysiol. 2013;110:1415–25. doi: 10.1152/jn.00676.2012. [DOI] [PMC free article] [PubMed] [Google Scholar]
- Gerasimenko YP, Makarovskii AN, Nikitin OA. Control of locomotor activity in humans and animals in the absence of supraspinal influences. Neurosci Behav Physiol. 2002;32:417–23. doi: 10.1023/a:1015836428932. [DOI] [PubMed] [Google Scholar]
- Giszter SF, Hart CB. Motor primitives and synergies in the spinal cord and after injury-the current state of play. Ann N Y Acad Sci. 2013;1279:114–26. doi: 10.1111/nyas.12065. [DOI] [PMC free article] [PubMed] [Google Scholar]
- Grillner S. Control of locomotion in bipeds, tetrapods, and fish. In: Brooks VD, editor. Handbook of physiology. Section 1: The nervous system, vol. II. Motor control. Bethesda, MD: American Physiological Society; 1981. pp. 1179–236. [Google Scholar]
- Grillner S. The motor infrastructure: from ion channels to neuronal networks. Nat Rev Neurosci. 2003;4:573–86. doi: 10.1038/nrn1137. [DOI] [PubMed] [Google Scholar]
- Grillner S. Biological pattern generation: the cellular and computational logic of networks in motion. Neuron. 2006;52:751–66. doi: 10.1016/j.neuron.2006.11.008. [DOI] [PubMed] [Google Scholar]
- Grillner S. Human locomotor circuits conform. Science. 2011;334:912–3. doi: 10.1126/science.1214778. [DOI] [PubMed] [Google Scholar]
- Grillner S, Rossignol S. On the initiation of the swing phase of locomotion in chronic spinal cats. Brain Res. 1978;146:269–77. doi: 10.1016/0006-8993(78)90973-3. [DOI] [PubMed] [Google Scholar]
- Grillner S, Zangger P. How detailed is the central pattern generation for locomotion? Brain Res. 1975;88:367–71. doi: 10.1016/0006-8993(75)90401-1. [DOI] [PubMed] [Google Scholar]
- Guertin PA. The mammalian central pattern generator for locomotion. Brain Res Rev. 2009;62:45–56. doi: 10.1016/j.brainresrev.2009.08.002. [DOI] [PubMed] [Google Scholar]
- Guertin PA. Central pattern generator for locomotion: anatomical, physiological, and pathophysiological considerations. Front Neurol. 2013;3:183. doi: 10.3389/fneur.2012.00183. [DOI] [PMC free article] [PubMed] [Google Scholar]
- Gurfinkel VS, Levik YS, Kazennikov OV, Selionov VA. Locomotor-like movements evoked by leg muscle vibration in humans. Eur J Neurosci. 1998;10:1608–12. doi: 10.1046/j.1460-9568.1998.00179.x. [DOI] [PubMed] [Google Scholar]
- Hägglund M, Dougherty KJ, Borgius L, Itohara S, Iwasato T, Kiehn O. Optogenetic dissection reveals multiple rhythmogenic modules underlying locomotion. Proc Natl Acad Sci USA. 2013;110:11589–94. doi: 10.1073/pnas.1304365110. [DOI] [PMC free article] [PubMed] [Google Scholar]
- Harkema SJ. Plasticity of interneuronal networks of the functionally isolated human spinal cord. Brain Res Rev. 2008;57:255–64. doi: 10.1016/j.brainresrev.2007.07.012. [DOI] [PMC free article] [PubMed] [Google Scholar]
- Harkema SJ, Hurley SL, Patel UK, Requejo PS, Dobkin BH, Edgerton VR. Human lumbosacral spinal cord interprets loading during stepping. J Neurophysiol. 1997;77:797–811. doi: 10.1152/jn.1997.77.2.797. [DOI] [PubMed] [Google Scholar]
- Harkema S, Gerasimenko Y, Hodes J, Burdick J, Angeli C, Chen Y, et al. Effect of epidural stimulation of the lumbosacral spinal cord on voluntary movement, standing, and assisted stepping after motor complete paraplegia: a case study. Lancet. 2011;377:1938–47. doi: 10.1016/S0140-6736(11)60547-3. [DOI] [PMC free article] [PubMed] [Google Scholar]
- Hultborn H, Nielsen JB. Spinal control of locomotion–from cat to man. Acta Physiol (Oxf) 2007;189:111–21. doi: 10.1111/j.1748-1716.2006.01651.x. [DOI] [PubMed] [Google Scholar]
- Ivanenko YP, Grasso R, Zago M, Molinari M, Scivoletto G, Castellano V, et al. Temporal components of the motor patterns expressed by the human spinal cord reflect foot kinematics. J Neurophysiol. 2003;90:3555–65. doi: 10.1152/jn.00223.2003. [DOI] [PubMed] [Google Scholar]
- Jilge B, Minassian K, Rattay F, Pinter MM, Gerstenbrand F, Binder H, et al. Initiating extension of the lower limbs in subjects with complete spinal cord injury by epidural lumbar cord stimulation. Exp Brain Res. 2004;154:308–26. doi: 10.1007/s00221-003-1666-3. [DOI] [PubMed] [Google Scholar]
- Kinoshita M, Yamaguchi T. Stimulus time-locked responses of motoneurons during forelimb fictive locomotion evoked by repetitive stimulation of the lateral funiculus. Brain Res. 2001;904:31–42. doi: 10.1016/s0006-8993(01)02431-3. [DOI] [PubMed] [Google Scholar]
- Kakulas BA. Neuropathology: the foundation for new treatments in spinal cord injury. Spinal Cord. 2004;42:549–63. doi: 10.1038/sj.sc.3101670. [DOI] [PubMed] [Google Scholar]
- McCrea DA, Rybak IA. Organization of mammalian locomotor rhythm and pattern generation. Brain Res Rev. 2008;57:134–46. doi: 10.1016/j.brainresrev.2007.08.006. [DOI] [PMC free article] [PubMed] [Google Scholar]
- McKay WB, Sherwood AM, Tang SF. A manual for the neurophysiological assessment of motor control: The brain motor control assessment (BMCA) protocol. In: Dimitrijevic MR, Kakulas B, McKay WB, Vrbova G, editors. Restorative neurology of the injured spinal cord. New York: Oxford University Press; 2012. pp. 261–83. [Google Scholar]
- McKay WB, Lim HK, Priebe MM, Stokic DS, Sherwood AM. Clinical neurophysiological assessment of residual motor control in post-spinal cord injury paralysis. Neurorehabil Neural Repair. 2004;18:144–53. doi: 10.1177/0888439004267674. [DOI] [PubMed] [Google Scholar]
- Meehan CF, Grondahl L, Nielsen JB, Hultborn H. Fictive locomotion in the adult decerebrate and spinal mouse in vivo. J Physiol. 2012;590:289–300. doi: 10.1113/jphysiol.2011.214643. [DOI] [PMC free article] [PubMed] [Google Scholar]
- Minassian K, Persy I, Rattay F, Dimitrijevic MR. Peripheral and central afferent input to the lumbar cord. Biocybern Biomed Eng. 2005;25:11–29. [Google Scholar]
- Minassian K, Jilge B, Rattay F, Pinter MM, Binder H, Gerstenbrand F, et al. Stepping-like movements in humans with complete spinal cord injury induced by epidural stimulation of the lumbar cord: electromyographic study of compound muscle action potentials. Spinal Cord. 2004;42:401–16. doi: 10.1038/sj.sc.3101615. [DOI] [PubMed] [Google Scholar]
- Minassian K, Persy I, Rattay F, Pinter MM, Kern H, Dimitrijevic MR. Human lumbar cord circuitries can be activated by extrinsic tonic input to generate locomotor-like activity. Hum Mov Sci. 2007;26:275–95. doi: 10.1016/j.humov.2007.01.005. [DOI] [PubMed] [Google Scholar]
- Murg M, Binder H, Dimitrijevic MR. Epidural electric stimulation of posterior structures of the human lumbar spinal cord: 1. muscle twitches - a functional method to define the site of stimulation. Spinal Cord. 2000;38:394–402. doi: 10.1038/sj.sc.3101038. [DOI] [PubMed] [Google Scholar]
- Murray MP. Gait as a total pattern of movement. Am J Phys Med. 1967;46:290–333. [PubMed] [Google Scholar]
- Oberg T, Karsznia A, Oberg K. Basic gait parameters: reference data for normal subjects, 10-79 years of age. J Rehabil Res Dev. 1993;30:210–23. [PubMed] [Google Scholar]
- Pearson KG, Gordon J. Locomotion. In: Kandel ER, Schwartz JH, Jessell TM, Siegelbaum SA, Hudspeth AJ, editors. Principles of neural science. 5th edition. New York: McGraw-Hill; 2013. pp. 812–34. [Google Scholar]
- Pinter MM, Gerstenbrand F, Dimitrijevic MR. Epidural electrical stimulation of posterior structures of the human lumbosacral cord: 3. Control of spasticity. Spinal Cord. 2000;38:524–31. doi: 10.1038/sj.sc.3101040. [DOI] [PubMed] [Google Scholar]
- Rattay F, Minassian K, Dimitrijevic MR. Epidural electrical stimulation of posterior structures of the human lumbosacral cord: 2. quantitative analysis by computer modeling. Spinal Cord. 2000;38:473–89. doi: 10.1038/sj.sc.3101039. [DOI] [PubMed] [Google Scholar]
- Rybak IA, Shevtsova NA, Lafreniere-Roula M, McCrea DA. Modelling spinal circuitry involved in locomotor pattern generation: insights from deletions during fictive locomotion. J Physiol. 2006;577:617–39. doi: 10.1113/jphysiol.2006.118703. [DOI] [PMC free article] [PubMed] [Google Scholar]
- Sayenko DG, Angeli C, Harkema SJ, Edgerton VR, Gerasimenko YP. Neuromodulation of evoked muscle potentials induced by epidural spinal-cord stimulation in paralyzed individuals. J Neurophysiol. 2014;111:1088–99. doi: 10.1152/jn.00489.2013. [DOI] [PMC free article] [PubMed] [Google Scholar]
- Selionov VA, Ivanenko YP, Solopova IA, Gurfinkel VS. Tonic central and sensory stimuli facilitate involuntary air-stepping in humans. J Neurophysiol. 2009;101:2847–58. doi: 10.1152/jn.90895.2008. [DOI] [PubMed] [Google Scholar]
- Shapkova EY. Spinal locomotor capability revealed by electrical stimulation of the lumbar enlargement in paraplegic patients. In: Latash M, Levin M, editors. Progress in motor control, vol. 3: effect of age, disorder, and rehabilitation. Champaign, IL: Human Kinetics; 2004. pp. 253–89. [Google Scholar]
- Shapkova EY, Schomburg ED. Two types of motor modulation underlying human stepping evoked by spinal cord electrical stimulation (SCES) Acta Physiol Pharmacol Bulg. 2001;26:155–7. [PubMed] [Google Scholar]
- Sherwood AM, Dimitrijevic MR, McKay WB. Evidence of subclinical brain influence in clinically complete spinal cord injury: discomplete SCI. J Neurol Sci. 1992;110:90–8. doi: 10.1016/0022-510x(92)90014-c. [DOI] [PubMed] [Google Scholar]
- Sherwood AM, McKay WB, Dimitrijevic MR. Motor control after spinal cord injury: assessment using surface EMG. Muscle Nerve. 1996;19:966–79. doi: 10.1002/(SICI)1097-4598(199608)19:8<966::AID-MUS5>3.0.CO;2-6. [DOI] [PubMed] [Google Scholar]
- Yang JF, Lamont EV, Pang MY. Split-belt treadmill stepping in infants suggests autonomous pattern generators for the left and right leg in humans. J Neurosci. 2005;25:6869–76. doi: 10.1523/JNEUROSCI.1765-05.2005. [DOI] [PMC free article] [PubMed] [Google Scholar]
- Zelik KE, La Scaleia V, Ivanenko YP, Lacquaniti F. Can modular strategies simplify neural control of multidirectional human locomotion? J Neurophysiol. 2014;111:1686–702. doi: 10.1152/jn.00776.2013. [DOI] [PubMed] [Google Scholar]
- Zhong G, Shevtsova NA, Rybak IA, Harris-Warrick RM. Neuronal activity in the isolated mouse spinal cord during spontaneous deletions in fictive locomotion: insights into locomotor central pattern generator organization. J Physiol. 2012;590:4735–59. doi: 10.1113/jphysiol.2012.240895. [DOI] [PMC free article] [PubMed] [Google Scholar]