

See Grote et al. (doi:10.1093/awu386) for a scientific commentary on this article.
Miller-Delaney et al. report the first genome-wide analysis of DNA methylation in the hippocampus of patients with temporal lobe epilepsy. They identify altered methylation profiles in protein-coding genes, reveal pathology grade-specific differences and identify methylation-sensitive non-coding RNAs. The findings increase understanding of mechanisms regulating coding/non-coding gene expression in epilepsy.
Keywords: DNA methylation, epigenetics, microRNA, long non-coding RNA, temporal lobe epilepsy
Abstract
Temporal lobe epilepsy is associated with large-scale, wide-ranging changes in gene expression in the hippocampus. Epigenetic changes to DNA are attractive mechanisms to explain the sustained hyperexcitability of chronic epilepsy. Here, through methylation analysis of all annotated C-phosphate-G islands and promoter regions in the human genome, we report a pilot study of the methylation profiles of temporal lobe epilepsy with or without hippocampal sclerosis. Furthermore, by comparative analysis of expression and promoter methylation, we identify methylation sensitive non-coding RNA in human temporal lobe epilepsy. A total of 146 protein-coding genes exhibited altered DNA methylation in temporal lobe epilepsy hippocampus (n = 9) when compared to control (n = 5), with 81.5% of the promoters of these genes displaying hypermethylation. Unique methylation profiles were evident in temporal lobe epilepsy with or without hippocampal sclerosis, in addition to a common methylation profile regardless of pathology grade. Gene ontology terms associated with development, neuron remodelling and neuron maturation were over-represented in the methylation profile of Watson Grade 1 samples (mild hippocampal sclerosis). In addition to genes associated with neuronal, neurotransmitter/synaptic transmission and cell death functions, differential hypermethylation of genes associated with transcriptional regulation was evident in temporal lobe epilepsy, but overall few genes previously associated with epilepsy were among the differentially methylated. Finally, a panel of 13, methylation-sensitive microRNA were identified in temporal lobe epilepsy including MIR27A, miR-193a-5p (MIR193A) and miR-876-3p (MIR876), and the differential methylation of long non-coding RNA documented for the first time. The present study therefore reports select, genome-wide DNA methylation changes in human temporal lobe epilepsy that may contribute to the molecular architecture of the epileptic brain.
Introduction
Temporal lobe epilepsy is the most common epilepsy syndrome in adults and is particularly associated with pharmacoresistance, often necessitating surgical resection of the epileptic focus (Blumcke et al., 2013). Hippocampi from such patients often display hippocampal sclerosis, a hallmark pathological lesion comprising segmental neuron loss in the cornu ammonis (CA) 1, CA3 and hilus, gliosis, as well as other changes (Wieser, 2004). Nevertheless, a significant number of patients with pharmacoresistant temporal lobe epilepsy display limited or no signs of pathologic change in resected hippocampal tissue (Blumcke et al., 2013). Identifying shared and unique molecular pathways across a spectrum of hippocampal pathologies may yield novel insight into the pathomechanisms of epilepsy and endogenous programmes of neuroprotection (Jimenez-Mateos and Henshall, 2009; Pitkanen and Lukasiuk, 2011).
Genome-wide expression profiling has revealed that levels of hundreds of protein-coding transcripts are altered in experimental and human epilepsy, including genes coding for ion channels and genes involved in synaptic remodeling, inflammation, gliosis and neuronal death (Pitkanen and Lukasiuk, 2011). More recently, it emerged that expression of non-coding RNA is also altered in human epilepsy (Qureshi and Mehler, 2012; Henshall, 2014). Amongst non-coding transcripts, research into the contribution of microRNA, small (∼22 nucleotide) endogenous non-coding RNA that regulate gene expression at a post-transcriptional level, has progressed the furthest. Dysregulation of microRNA may promote epileptogenesis and modulating individual microRNAs can directly influence brain excitability and the pathophysiological features of temporal lobe epilepsy (Tao et al., 2011; Jimenez-Mateos et al., 2012; Tan et al., 2013). Thus, to gain new insight into the pathomechanisms of epilepsy requires appraisal of the aberrant expression of both coding and non-coding RNA.
Epigenetic mechanisms have emerged as important determinants of how genes are regulated in health and disease, including in epilepsy (Kobow and Blumcke, 2011; Lubin, 2012; Roopra et al., 2012; Boison et al., 2013). DNA methylation is the covalent attachment of methyl groups to the cytosine base present in CG dinucleotide-containing regulatory sequences (Jaenisch and Bird, 2003; Robertson, 2005). It can result directly in the inhibition of gene transcription and indirectly in transcriptional silencing that is mediated by methyl-CpG-binding domain proteins (Qureshi and Mehler, 2010). Differential methylation of gene promoter regions is responsible, in part, for the modulation of gene expression profiles that promote cell identity and function throughout life (Jaenisch and Bird, 2003). Although DNA methylation was originally thought to be a static process after cellular differentiation, it is now known to be highly dynamic in the hippocampus, including after neuronal stimulation, and important for certain plasticity and injury responses (Endres et al., 2000; Miller and Sweatt, 2007; Ma et al., 2009; Feng et al., 2010; Guo et al., 2011a, b; Kaas et al., 2013). Altered DNA methylation of RELN was reported in human temporal lobe epilepsy, which may contribute to granule cell dispersion (Kobow et al., 2009). Methylation changes for brain-derived neurotrophic factor and the glutamate receptor subunit encoded by Grin2c have also been identified in experimental epilepsy (Ryley Parrish et al., 2013). Hippocampal protein levels of DNA methyltransferases 1 and 3a are increased in human temporal lobe epilepsy (Zhu et al., 2012) and DNA methyltransferase activity is elevated in experimental epilepsy (Williams-Karnesky et al., 2013). Genome-wide DNA methylation analysis has shown that hypomethylation of gene promoters occurs in the acute wake of prolonged seizures (status epilepticus) (Miller-Delaney et al., 2012) while during epileptogenesis hypermethylation of genes becomes prominent (Kobow et al., 2013; Williams-Karnesky et al., 2013). DNA methylation changes in the pilocarpine model of epilepsy seem to primarily affect C-phosphate-G (CpG) islands associated with gene bodies (Kobow et al., 2013). The mechanism of the transition from hypo- to hypermethylation is unknown but may be linked to initial strong activation of demethylating enzymes (Henshall et al., 1999; Ma et al., 2009) followed by loss of adenosinergic tone via astrogliosis-driven interference in the transmethylation pathway (Williams-Karnesky et al., 2013). Whether DNA methylation changes persist and are important in chronic human pharmacoresistant epilepsy has not been explored.
Here we analyse genome-wide methylation changes in hippocampal samples from living patients with refractory temporal lobe epilepsy who have been scored for hippocampal sclerosis according to the Watson Grading (WG) system (Watson et al., 1996). In addition to the analysis of protein coding promoter methylation, the role of methylation in the transcriptional regulation of non-coding RNAs is investigated, with particular emphasis on microRNA.
Materials and methods
Human tissue samples
Resected hippocampal tissue from patients with refractory temporal lobe epilepsy was provided by Ryder Gwinn (Swedish Medical Centre, Seattle, USA). Informed consent was obtained for all patients. Hippocampal tissue was scored according to the Watson hippocampal sclerosis grading (WG) system (Watson et al., 1996). Control tissue was obtained from the University of Maryland Brain and Tissue Bank (USA). Demography of samples was as follows: WG1: male (n = 3), female (n = 2), caucasian (n = 3), hispanic (n = 1), race not on file (n = 1); WG4: male (n = 4), caucasian (n = 2), Asian (n = 1), race not on file (n = 1); and control subjects: male (n = 2), female (n = 3), race not on file (n = 5).
Microdissection of hippocampal samples
Fresh frozen human hippocampal samples were sectioned on a cryostat. Cresyl violet staining was carried out on all brain tissue samples and used as a guide for microdissection of the hippocampal region from the surrounding tissue. DNA and RNA were extracted from the hippocampal region of 12 unstained 60-μm sections per patient sample, using the Norgen All-in-One Purification Kit. Independent isolation of small RNAs was not carried out, with total RNA being used for all subsequent steps. Nucleic acid concentration was analysed on a Nanodrop Spectrophotometer and RNA integrity using an Agilent 2100 Bioanalyser.
Methylated DNA immunoprecipitation
The protocol used for methylation analysis was as described previously (Buckley et al., 2010; Das et al., 2010; Miller-Delaney et al., 2012, 2013). Briefly, 2 μg of sonicated DNA was incubated overnight with 10 μg of anti-5’-methylcytidine antibody (BIMECY-1000; Eurogentec) and immunoprecipitated using Dynabeads® (112-02D; Bio Sciences) and a magnetic particle concentrator (DynaMag™, catalogue #123.21D; BioSciences). Methylated DNA immunoprecipitation and reference control DNA were differentially labelled and hybridized (according to NimbleGen DNA methylation analysis protocol version 6.0) to CpG Island promoter plus arrays from Roche NimbleGen (#5924529001; Human DNA Methylation 3x720K CpG Island Plus RefSeq Promoter Arrays) covering 30 841 loci representing all annotated CpG islands and promoter regions in the human genome. For microRNA analysis, custom designed Nimblegen arrays were manufactured with tiled regions 50 kb upstream and 20 kb downstream of all 754 microRNAs included on TaqMan® Array Human microRNA A+B Cards (V3; #4444913). Individual patient samples were hybridized to single arrays. Scanning was performed on an Axon 4000B scanner, and data were processed using GenePix Pro 6.0. Image analysis and peak detection were performed using the methylation application in Nimblescan version 2.4. Methylated peaks were identified using the following parameters: sliding window of 750 bp, P-value minimum cut-off (−log10) of 2.0, and a minimum of two probes per peak. Resulting data files were visualized using SignalMap 1.9. Methylation data have been deposited at www.ebi.ac.uk/arrayexpress (E-MTAB-3054 and E-MTAB-3055). The following percentage cut-offs were used to determine differential methylation profiles of sample groups. Hypermethylated: control 80–100%, WG1 80–100%, WG4 75–100% of samples methylated. Hypomethylated: control 0–20%, WG1 0–20%, WG4 0–25% of samples demethylated. A list of the gene promoter specific methylation peaks detectable across all samples is provided for all studied genes including those where no difference across all three sample cohorts was found (Supplementary material).
MicroRNA expression analysis
Briefly, 20 ng RNA was reverse transcribed using Megaplex RT Primers (Life Technologies; #4444745) and was followed by pre-amplification using Megaplex™ Primer Pools (Life Technologies, #4444750) according to manufacturer’s protocols. MicroRNA expression was analysed using TaqMan® Array Human microRNA A+B Cards (V3; #4444913) on the 7900 HT Fast Realtime System (Applied Biosystems). Significance was based on the following criteria: a minimum fold-change greater than ±2 and a P-value ≤ 0.05. Numbers of hippocampal samples profiled per group were as follows: Control, n = 4; WG1, n = 4; WG4, n = 3. For analysis of individual microRNAs of interest, reverse transcription was carried out using microRNA-specific primers (Life technologies) and PCR analysis performed using cDNA in triplicate on the 7900 HT Fast Real-Time System for the following microRNAs: Hsa-miR-129-3p, Hsa-miR-876-3p, Hsa-miR-27a, Hsa-miR-193a-5p normalized to RNU6B (now known as RNU6-6P). Minus reverse transcription and non-template controls were used throughout to rule out genomic DNA and cross-well contamination, respectively. A relative fold-change in expression was performed using the comparative cycle threshold method (2−ΔΔCT). Cortex samples were those used in a previously published study (Jimenez-Mateos et al., 2012).
Gene expression analysis
RNA extracted from post-mortem control subjects was of poor integrity (data not shown). Four temporal lobe epilepsy samples passed RNA integrity analysis (two WG1 and two WG4) with RIN values of 8.5, 8.6, 9 and 8.8, respectively, while the remaining samples were of moderate integrity (RIN values of 4.1 to 6.9; Table 2). Double-stranded cDNA was synthesized from DNase-treated total RNA using the Ovation Pico WTA System V2 (catalogue #3302-12; Nugen) which is optimized for RNA of moderate integrity. PCR analysis of gene and long non-coding RNA was performed using cDNA in triplicate on the 7900 HT Fast Real-Time System (Applied Biosystems) for the following genes: ADARB2-AS1, FARP2, FZD2, KCNK13, LINC324, PHAX, SOX1, TGM2, UCA1, and normalized to 18S RNA.
Table 2.
Temporal lobe epilepsy patient clinical and pathological details
| Identifier | Gender | Age (y) | Tissue diagnosis and pathology | Antiepileptic drugs | RIN | Analyses |
|---|---|---|---|---|---|---|
| WG1_1 | M | 59 | R side; HS grade 1. Gliosis only; No GCD/MFS | Ph, Clon, Zon | 5.9 | GM, Gexp, miRexp, miRM |
| WG1_2 | F | 31 | R side, HS grade 1. Gliosis only; No GCD/MFS | Clon, Lev, Ox | 8.6 | GM, Gexp, miRexp, miRM |
| WG1_3 | F | 16 | R side, HS grade 1. Mild astrogliosis; No GCD/MFS | Ox, Zon | 5.5 | GM, Gexp, miRexp |
| WG1_4 | M | 46 | L side, HS grade 1. Mild-moderate astrogliosis; No GCD/MFS | Lev, Ph | 4.1 | GM, Gexp, miRexp, miRM |
| WG1_5 | M | 39 | R side, HS grade 1. Gliosis only; No MFS/GCD | Lam, Lev | 8.5 | GM, Gexp, miRexp, miRM |
| WG4_1 | M | 57 | L side, HS grade 4. Mild GCD | Car, Lam | 9.0 | GM, Gexp, miRexp, miRM |
| WG4_2 | M | 37 | L side, HS grade 4. GCD, MFS | Car, Lev | 8.8 | GM, Gexp, miRexp, miRM |
| WG4_3 | M | 40 | R side, HS grade 4. GCD, MFS | Car, Dz | 6.9 | GM, Gexp, miRexp |
| WG4_4 | M | 52 | R side, HS grade 4. Weak MFS, No GCD | Car | 4.8 | GM, Gexp, miRexp, miRM |
Car = carbamazepine; Clon = clonazepam; Dz = diazepam; GM = gene promoter methylation analysis; GCD = granule cell dispersion; Gexp = gene expression analysis; HS = hippocampal sclerosis; L = left side resection; Lam = lamotrigine; Lev = levetiracetam; MFS = mossy fibre sprouting (dynorphin staining); miRexp = microRNA expression analysis; miRM = microRNA methylation analysis; Ox = oxcarbazapine; Ph = phenytoin; R = right side resection; RIN = RNA integrity number; Zon = zonisamide.
Bioinformatics
Compilation, preprocessing and analysis of genomic methylation data were performed as described previously (Miller-Delaney et al., 2012) using in-house developed Java (version 1.6) software. Methylated DNA immunoprecipitation probe significances in terms of P-values were generated using the Kolmogorov–Smirnov test as implemented by NimbleScan SignalMap software version 1.9. These values were then transformed (−log10) to give peak scores. A peak was called when two or more consecutive probes achieved a score of at least 2. For gene centric studies, methylation profiles were then generated from the peak score profiles by assessing the presence or absence of a peak over all promoter regions (−2000 and +500 bp around the transcriptional start site) and CpG islands. Cluster analysis was then performed using Spearman’s correlation as a similarity metric and using complete linkage as cluster distance method. Heat-map visualization was performed using the heatmap.2 package. Analysis was implemented in the R statistical computing language. For microRNA, correlation of methylation status and expression in temporal lobe epilepsy was carried out as previously described (Das et al., 2013).
Gene ontology and functional analyses were assigned by manual interrogation of Entrez Gene (http://www.ncbi.nlm.nih.gov/sites/entrez?db_gene) and using GOstat web-based analysis (http://gostat.wehi.edu.au/). Analyses of over/under-represented gene ontology terms included correction for multiple comparisons (Benjamini) and significance was determined at P < 0.05. Ideogram generation was performed using Idiographica web-based software (Kin and Ono, 2007). Positional gene enrichment analysis was performed using web-based software (De Preter et al., 2008).
Bisulphite sequencing
A total of 500 ng of DNA from individual patient samples was bisulphate-converted using the EZ DNA Methylation-Gold kit™ (catalogue #D5005 and #D5006; Zymo), and PCR was performed on 10 ng of the bisulphite-treated DNA as outlined previously (Das et al., 2010; Miller-Delaney et al., 2012). PCR primers were designed using methyl primer express (www.appliedbiosystems.com/methylprimerexpress) and were as follows: ADARB2-AS1 forward primer 5′-TATGGGTGTGTGTGCGTGTGT-3′, reverse primer 5′-CACCTACCCCACCTACCCCA-3′; UCA1 forward primer 5′-GTTTAGGTGGTCTTTTATA-3′, reverse primer 5′-TAATCTAAAAACCCAAAATCG-3′. PCR products were purified using the QIAquick® PCR purification kit (catalogue #28104; Qiagen) as per the instructions of the manufacturer and sequenced in the forward direction at Eurofins MWG Operon.
Data analysis
Data are presented as mean ± standard error of the mean (SEM). Gene expression analysis comparisons were made using ANOVA, followed by Newman–Keuls post hoc testing or by Student’s t-test, with significance accepted at P < 0.05.
Results
Clinical and pathology data
Human autopsy control and temporal lobe epilepsy patient clinical data are reported in Tables 1 and 2. Although studies have suggested a lack of gender effects on Watson grade of hippocampal sclerosis or CA1–4 neuronal dropout (Doherty et al., 2007), samples were matched for age and sex as far as possible with the available samples. The average patient age ranged from 16 to 59 years, with average ages of 38.2, 46.5 and 34.4 years per sample group (WG1, WG4 and controls, respectively). Statistical analysis confirmed no significant difference between groups (ANOVA, Newman-Keuls post hoc analysis; P = 0.37).
Table 1.
Autopsy control details
| Identifier | Gender | Age (years) | Cause of death | PMI (h) | Analyses |
|---|---|---|---|---|---|
| C1 | M | 37 | Arteriosclerotic cardiovascular disease | 12 | GM, miRexp, miRM |
| C2 | M | 27 | Congestive heart failure | 13 | GM, miRexp, miRM |
| C3 | F | 24 | Multiple injury car crash | 9 | GM |
| C4 | F | 36 | Cardiac arrhythmia | 6 | GM, miRexp, miRM |
| C5 | F | 48 | Bilateral pulmonary thromboemboli | 9 | GM, miRexp, miRM |
GM = gene promoter methylation analysis; miRexp = miRNA expression analysis; miRM = miRNA methylation analysis; PMI = post-mortem interval.
Nissl-stained sections from autopsy controls displayed typical hippocampal architecture (Fig. 1A). In contrast, samples from patients with temporal lobe epilepsy displayed hippocampal sclerosis consistent with the WG system. WG1 samples were defined as those exhibiting gliosis with slight (<10%) or no neuronal cell loss (Fig. 1B), whereas WG4 samples exhibited gliosis with >50% neuronal cell loss in CA1 and CA3/CA4, with sparing of CA2 (Fig. 1C) (Watson et al., 1996; Doherty et al., 2007). WG1 samples did not display granule cell dispersion or mossy fibre sprouting whereas both pathological features were common in the WG4 samples.
Figure 1.
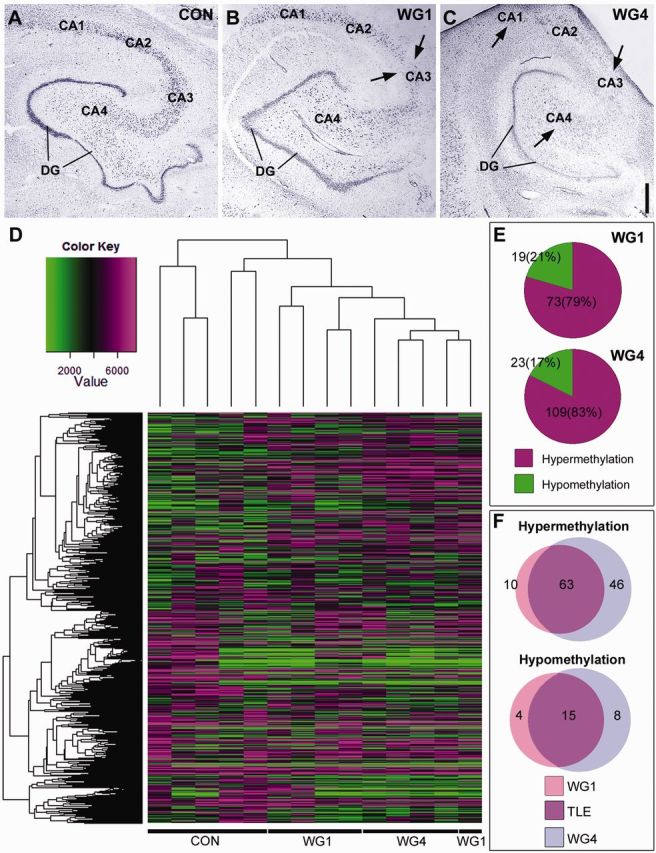
Methylation of protein-coding genes defines hippocampal sclerosis in temporal lobe epilepsy. (A–C) Cresyl violet staining illustrating Watson grading of hippocampal sclerosis in representative human temporal lobe epilepsy samples compared to controls. Areas of cell loss are marked by arrows. Scale bar = 1 mm. (D) Dendrogram showing the hierarchical clustering of raw data methylation profiles of Control, WG1 and WG4 groups. Hypomethylation locations are signified by green and hypermethylation locations by magenta areas. Value represents the average of the probes for a given region (from −2 kb to + 500 bp around the transcriptional start site). This value was calculated for each gene that is represented on the histogram. (E) Pie charts illustrating the percentage of differential hypermethylation and hypomethylation events in WG1 and WG4 when either group was compared to control. Differential hypermethylation of promoter regions is prominent in both WG1 and WG4. (F) Venn diagrams illustrating the differential methylation profiles of WG1 and WG4 in terms of the number gene promoters involved. Methylation events unique to WG1 are shown in pink, those unique to WG4 are shown in blue and those unique to temporal lobe epilepsy regardless of hippocampal sclerosis grade are shown in purple. Control (Con), Watson Grade 1 (WG1), and Watson Grade 4 (WG4). DG = dentate gyrus; TLE = temporal lobe epilepsy.
Differential methylation of protein coding genes defines hippocampal sclerosis
The methylation profiles of hippocampus from post-mortem controls and patients with temporal lobe epilepsy were established using methylated DNA immunoprecipitation and hybridization to arrays covering all annotated CpG islands and promoter regions in the human genome. Methylation peaks identified using the NimbleScan 2.4 software were mapped to genes using a window of −2 kb to +500 bp relative to the transcriptional start site. This resulted in the identification of 322, 535, and 716 hypermethylated genes in control, WG1 and WG4, respectively.
Genes whose methylation status was not different between control and temporal lobe epilepsy samples were removed. This accounted for 96% of the promoter regions investigated. The remaining data set contained genes whose promoters were differentially methylated in WG1 and/or WG4 compared with controls (Fig. 1D–F). Hierarchical clustering and principal component analysis illustrated that the methylation profiles of WG1 and WG4 samples were more similar to each other than to controls (Fig. 1D and Supplementary Fig. 1). There was, however, noticeable variation in DNA methylation profiles between individual controls. Unique methylation profiles of WG1 and WG4 samples existed as well as a subset of gene promoters with common differential methylation profiles in WG1 and WG4 when compared to controls (Fig. 1F). Thus, analysis of differential methylation in WG1 and WG4 compared with autopsy control highlights unique methylation profiles for each hippocampal sclerosis grade (Table 3 and 4), in addition to a common methylation profile of temporal lobe epilepsy regardless of hippocampal sclerosis grade (Supplementary Table 1).
Table 3.
Genes differentially methylated in WG1 temporal lobe epilepsy
| Gene ID | Accession number | Gene title |
|---|---|---|
| Hypermethylated | ||
| ADPRHL2 | NM_017825 | ADP-ribosylhydrolase like 2 |
| B3GNTL1 | NM_001009905 | B3GNTL1 UDP-GlcNAc:betaGal beta-1,3-N-acetylglucosaminyltransferase-like 1 |
| FARP2 | NM_014808 | FERM, RhoGEF and pleckstrin domain protein 2 |
| FZD2 | NM_001466 | Frizzled family receptor 2 |
| ITPRIPL2 | NM_001034841 | Inositol 1,4,5-trisphosphate receptor interacting protein-like 2 |
| LIMD2 | NM_030576 | LIM domain containing 2 |
| PHAX | NM_032177 | Phosphorylated adaptor for RNA export |
| RPL39L | NM_052969 | Ribosomal protein L39-like |
| SCGB3A1 | NM_052863 | Secretoglobin, family 3A, member 1 |
| SPATA20 | NM_022827 | Spermatogenesis associated 20 |
| Hypomethylated | ||
| AFF3 | NM_002285 | AF4/FMR2 family, member 3 |
| CATSPER1 | NM_053054 | Cation channel, sperm associated 1 |
| LOC730668 | NR_027240 | Dynein heavy chain-like pseudogene |
| NCR1 | NM_004829 | Natural cytotoxicity triggering receptor 1 |
Table 4.
Genes differentially methylated in WG4 temporal lobe epilepsy
| Gene ID | Accession number | Gene title |
|---|---|---|
| Hypermethylated | ||
| AGBL1 | NM_152336 | ATP/GTP binding protein-like 1 |
| ANKRD29 | NM_173505 | Ankyrin repeat domain 29 |
| CLEC14A | NM_175060 | C-type lectin domain family 14, member A |
| CNGB1 | NM_001297 | Cyclic nucleotide gated channel beta 1 |
| CNTD2 | NM_024877 | Cyclin N-terminal domain containing 2 |
| COBL | NM_015198 | Cordon-bleu WH2 repeat protein |
| CSPG5 | NM_006574 | Chondroitin sulfate proteoglycan 5 (neuroglycan C) |
| CXorf65 | NM_001025265 | Chromosome X open reading frame 65 |
| DNAJC11 | NM_018198 | DnaJ (Hsp40) homolog, subfamily C, member 11 |
| DUSP15 | NM_177991 | Dual specificity phosphatase 15 |
| FAM193B | NM_019057 | Family with sequence similarity 193, member B |
| FAM78B | NM_001017961 | Homo sapiens family with sequence similarity 78, member B |
| FIGLA | NM_001004311 | Folliculogenesis specific basic helix-loop-helix |
| GK5 | NM_001039547 | Glycerol kinase 5 (putative) |
| GLB1L | NM_024506 | Galactosidase, beta 1-like |
| GLTPD2 | NM_001014985 | Glycolipid transfer protein domain containing 2 |
| GNRHR | NM_000406 | Gonadotropin-releasing hormone receptor |
| GPD2 | NM_000408 | Glycerol-3-phosphate dehydrogenase 2 (mitochondrial) |
| GRID2IP | NM_001145118 | Glutamate receptor, ionotropic, delta 2 (Grid2) interacting protein |
| HK2 | NM_000189 | Hexokinase 2 |
| KCNK13 | NM_022054 | Potassium channel, subfamily K, member 13 |
| LDHC | NM_017448 | Lactate dehydrogenase C |
| MPV17L | NM_173803 | MPV17 mitochondrial membrane protein-like |
| NANOS3 | NM_001098622 | Nanos homolog 3 |
| NLRP3 | NM_183395 | NLR family, pyrin domain containing 3 |
| P2RY4 | NM_002565 | Pyrimidinergic receptor P2Y, G-protein coupled, 4 |
| PAQR5 | NM_017705 | Progestin and adipoQ receptor family member V |
| PNPLA5 | NM_138814 | PNPLA5 patatin-like phospholipase domain containing 5 |
| PSAP | NM_002778 | Prosaposin |
| PSG3 | NM_021016 | Pregnancy specific beta-1-glycoprotein 3 |
| PTPLAD2 | NM_001010915 | Protein tyrosine phosphatase-like A domain containing 2 |
| RAPGEFL1 | NM_016339 | Rap guanine nucleotide exchange factor (GEF)-like 1 |
| RPIA | NM_144563 | Ribose 5-phosphate isomerase A |
| SEC16A | NM_014866 | SEC16 homolog A |
| SETX | NM_015046 | Senataxin |
| SOX1 | NM_005986 | SRY (sex determining region Y)-box 1 |
| SYNPR | NM_144642 | Synaptoporin |
| TAF9B | NM_015975 | TAF9B RNA polymerase II, TATA box binding protein (TBP)-associated factor |
| TMEM106C | NM_024056 | Transmembrane protein 106C |
| TMEM170B | NM_001100829 | Transmembrane protein 170B |
| TMEM53 | NM_024587 | Transmembrane protein 53 |
| TMPRSS9 | NM_182973 | Transmembrane protease, serine 9 |
| TNFRSF19 | NM_018647 | Tumor necrosis factor receptor superfamily, member 19 |
| TTLL9 | NM_001008409 | Tubulin tyrosine ligase-like family, member 9 |
| VIPR2 | NM_003382 | Vasoactive intestinal peptide receptor 2 |
| ZSCAN5B | NM_001080456 | Zinc finger and SCAN domain containing 5B |
| Hypomethylated | ||
| ANXA2 | NM_004039 | Annexin A2 |
| BTBD6 | NM_033271 | BTB (POZ) domain containing 6 |
| CDH22 | NM_021248 | Cadherin 22, type 2 |
| FAM45A | NM_207009 | Family with sequence similarity 45, member A |
| GPR25 | NM_005298 | G protein-coupled receptor 25 |
| NKAIN1 | NM_024522 | Na+/K+ transporting ATPase interacting 1 |
| RFX4 | NM_032491 | Regulatory factor X, 4 (influences HLA class II expression) |
| TGM2 | NM_198951 | Transglutaminase 2 (C polypeptide, protein-glutamine-gamma-glutamyltransferase) |
Overall, the prominent response in temporal lobe epilepsy samples was differential hypermethylation (79% in WG1 and 83% in WG4; Fig. 1E). Of 119 hypermethylated genes, the majority of hypermethylation events were found to be common occurrences in both WG1 and WG4 when compared with controls (63 genes; 52.9%) (Fig. 1F). Similarly, of only 27 differentially hypomethylated genes, the majority of hypomethylation events were found to be common occurrences in temporal lobe epilepsy regardless of Watson grade (15 genes; 55.5%) (Fig. 1F).
Gene ontology highlights genes linked to development processes, neuron maturation and remodelling
Gene ontology analysis of differential methylation events was carried out across both WG data sets and for temporal lobe epilepsy regardless of pathology grading using a combination of manual interrogation of Entrez Gene and GOstat online software (Fig. 2). Several gene ontology terms were found to be over-represented in the unique methylation profile of WG1 samples (Supplementary Table 2). These included terms linked to developmental processes (GO:32502; P = 0.004), cellular development and cellular differentiation (GO:48869 and GO:30154; P = 0.008) and were associated with the genes AF4/FMR2 family, member 3 (AFF3), cation channel, sperm associated 1 (CATSPER1), FERM, RhoGEF and pleckstrin domain protein 2 (FARP2), natural cytotoxicity triggering receptor 1 (NCR1), frizzled class receptor 2 (FZD2), spermatogenesis associated 20 (SPATA20) and secretoglobin, family 3A, member 1 (SCGB3A1).
Figure 2.

Gene ontology analysis of differential methylation events in temporal lobe epilepsy. In terms of cellular location, the highest proportion of genes differentially methylated in temporal lobe epilepsy regardless of hippocampal sclerosis, were expressed in the nucleus (18 hypermethylated, two hypomethylated). General differential hypermethylation of genes associated with transcriptional regulation was evident in temporal lobe epilepsy (two, five and eight genes in WG1, WG4 and temporal lobe epilepsy, respectively). A pattern of differential hypermethylation of neuronal genes was also evident (three, five and seven genes in WG1, WG4 and temporal lobe epilepsy respectively). Furthermore, hypermethylation of neurotransmitter secretion / synaptic transmission genes was evident in temporal lobe epilepsy (four genes WG4, nine genes temporal lobe epilepsy). EC = extracellular; ER = endoplasmic reticulum; NT/ST = neurotransmitter secretion/synaptic transmission; transcript. reg. = transcriptional regulation; TF = transcription factor; TLE = temporal lobe epilepsy.
Several of the genes associated with developmental processes are neuronally expressed (e.g. FARP2, FZD2). Furthermore, gene ontology terms connected with neuron remodelling and maturation were over-represented in the unique methylation profile of WG1 samples (GO:16322 and GO:42551; P = 0.02 and P = 0.04 respectively; associated with FARP2) (and see Supplementary Fig. 2). Other neuronal genes hypermethylated in WG1 included phosphorylated adaptor for RNA export (PHAX). Cordon-bleu WH2 repeat protein (COBL), chondroitin sulphate proteoglycan 5 (CSPG5), glutamate receptor, ionotropic, delta 2 interacting protein (GRID2IP), synaptoporin (SYNPR) and potassium channel, subfamily K, member 13 (KCNK13) were uniquely hypermethylated in WG4 samples (Tables 3 and 4). Neuronally-expressed genes hypermethylated in temporal lobe epilepsy regardless of hippocampal sclerosis grade included calcium channel, voltage-dependent, N type, alpha 1B subunit (CACNA1B), potassium voltage-gated channel, subfamily G, member 1 (KCNG1), potassium inwardly-rectifying channel, subfamily J, member 4 (KCNJ4), latrophilin 1 (LPHN1), neuroligin 2 (NLGN2), RAS guanyl releasing protein 2 (RASGRP2) and synaptotagmin II (SYT2) (Supplementary Table 1). Many of these genes were, more specifically, associated with the synapse, neurotransmitter secretion and synaptic transmission: acid phosphatase 1, soluble (ACP1), CACNA1B, KCNG1, KCNJ4, LPHN1, NLGN2, pannexin 2 (PANX2), RASGRP2, SYT2 (all hypermethylated in temporal lobe epilepsy; Supplementary Table 1); dystrophia myotonica-protein kinase (DMPK) (hypomethylated in temporal lobe epilepsy; Supplementary Table 1); and CSPG5, GRID2IP, KCNK13 and SYNPR (uniquely hypermethylated in WG4; Table 3).
Although two gene ontology terms were found to be significantly over-represented in the WG4 data set, both terms were connected to female gamete generation (GO:48477 and GO:7292; P = 0.015 and 0.033, respectively); folliculogenesis-specific basic helix-loop-helix (FIGLA) and nanos homologue 3 (NANOS3). Further, no gene ontology terms were found to be over-represented in temporal lobe epilepsy in general. No gene ontology terms were found to be significantly under-represented in any data set (WG1, WG4 and temporal lobe epilepsy differential methylation profiles in addition to the total list of differential methylation events; data not shown).
Differential methylation in human temporal lobe epilepsy occurs in genes with nuclear functions
In terms of cellular location, the highest proportion of genes differentially methylated in temporal lobe epilepsy regardless of hippocampal sclerosis grade, were expressed in the nucleus (18 genes hypermethylated, two genes hypomethylated). Aberrant gene expression is a feature of the pathophysiology of epilepsy, its development and hippocampal sclerosis, as well as animal models of prolonged seizures and epilepsy and nuclear genes associated with transcriptional regulation are therefore of particular relevance. Several transcription regulation genes were found to be differentially methylated in WG1, WG4 and in temporal lobe epilepsy regardless of pathology grade. In temporal lobe epilepsy, hypermethylation of the following genes was found compared to controls: helicase with zinc finger 2, transcriptional co-activator (HELZ2), MEF2 activating motif and SAP domain containing transcriptional regulator (MAMSTR), myogenin (MYOG), transcription elongation factor A (SII), 3 (TCEA3), TSC22 domain family, member 1 (TSC22D1) and the zinc finger proteins, ZNF653, ZNF705D and ZNF764 (Supplementary Table 1). Furthermore, unique methylation profiles of transcriptional regulators were found in both WG1 temporal lobe epilepsy (hypermethylated, FZD2 and PHAX; hypomethylated, AFF3) and WG4 temporal lobe epilepsy [hypermethylated, FIGLA, NLR family, pyrin domain containing 3 (NLRP3), SRY-box 1 (SOX1), TAF9B RNA polymerase II, TATA box binding protein (TBP)-associated factor (TAF9B), zinc finger and SCAN domain containing 5B (ZSCAN5B); hypomethylated, regulatory factor X, 4 (RFX4)] (Tables 3 and 4). Furthermore, gene ontology terms associated with small nuclear RNA export from the nucleus and transport were found to be over-represented in the unique methylation profile of WG1 temporal lobe epilepsy (GO:6408 and GO:51030; P = 0.015; associated with PHAX; Supplementary Table 2).
Differential methylation profiles of genes associated with cell death were also apparent in temporal lobe epilepsy. These included: angiopoietin 4 (ANGPT4), inositol hexakisphosphate kinase 2 (IP6K2), paraneoplastic Ma antigen 3 (PNMA3) and TSC22D1 (all differentially hypermethylated in temporal lobe epilepsy); NANOS3, NLRP3, senataxin (SETX), TAF9B, tumor necrosis factor receptor superfamily, member 19 (TNFRSF19) (all uniquely hypermethylated in WG4 temporal lobe epilepsy); and transglutaminase 2 (TGM2), which was uniquely hypomethylated in WG4 temporal lobe epilepsy. Interestingly, a unique methylation profile of genes associated with cell death was not evident in WG1 temporal lobe epilepsy.
Chromosomal enrichment is not a feature of differential methylation in temporal lobe epilepsy
Studies in cancer have found clustering of hypermethylation sites within the genome, and in the case of neuroblastic tumours, toward the telomeric ends of chromosomes (Buckley et al., 2010). Analysis of differential methylation events in temporal lobe epilepsy illustrated that methylation events occurred throughout the genome, without preference for any region (Fig. 3). Positional gene enrichment analysis of all data sets confirmed no enrichment of any genomic region for differential methylation events (data not shown).
Figure 3.
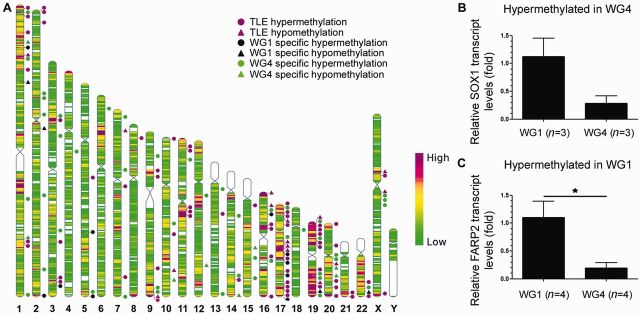
Distribution of differentially methylated gene promoters and protein-coding gene expression. (A) Differential methylation events occurred at random throughout the genome and positional gene enrichment analysis of all datasets confirmed no enrichment of any genomic region. The location of differentially methylated genes in temporal lobe epilepsy regardless of hippocampal sclerosis grade are marked by magenta shapes. Genes with unique methylation profiles in WG1 are marked by black shapes and those in WG4 by green shapes. Triangles denote hypomethylated gene promoters and circles, hypermethylated gene promoters. Heat map indicates gene density. (B) A substantial decrease in SOX1 expression was evident in WG4 compared to WG1, aligning with hypermethylation of this gene promoter in WG4. This downregulation was not statistically significant, considering the small number of samples tested (n = 3 for both groups, ∼4-fold reduction; P = 0.07). (C) FARP2 expression was found to be significantly upregulated in WG1 compared to WG4, contrary to findings of differential hypermethylation in WG1 (n = 4 for both groups, P = 0.02). TLE = temporal lobe epilepsy.
Hippocampal expression of differentially methylated genes in temporal lobe epilepsy
In epileptic rats, 79% of differential DNA methylation events were not associated with changes in gene expression (Kobow et al., 2013). To explore whether promoter methylation had the expected effect on transcription, gene expression analysis was performed on a sample of six genes that were found to exhibit differential promoter methylation in WG1 or WG4 temporal lobe epilepsy. Differential expression of differentially methylated genes was analysed in WG1 or WG4 temporal lobe epilepsy by comparison with the alternative hippocampal sclerosis grade (Fig. 3 and Supplementary Fig. 2). RNA quality in post-mortem samples was not sufficient for gene expression analysis.
A trend towards reduction in SOX1 expression (hypermethylated in WG4) was evident in WG4 when compared to WG1 temporal lobe epilepsy, although this reduction was not statistically significant (Fig. 3B). FARP2 expression was found to be significantly upregulated in WG1 compared to WG4, contrary to findings of differential hypermethylation in WG1 temporal lobe epilepsy (Fig. 3C). In a number of other cases, no significant difference in gene expression was detectable (FZD2, KCNK13, PHAX, TGM2).
Differential microRNA expression profiles define temporal lobe epilepsy with hippocampal sclerosis
We next explored the expression and role of DNA methylation in control of non-coding RNA. A total of 18 microRNAs were found to be differentially expressed in the hippocampal samples from patients with temporal lobe epilepsy (Fig. 4A). This data set included three microRNAs that were uniquely differentially regulated in WG1 temporal lobe epilepsy (miR-363 and miR-876-3p upregulated; miR-483-3p downregulated). Three microRNA were also found to be uniquely differentially downregulated in WG4 samples (miR-138, miR-873 and miR-876-3p). A total of 12 microRNA were found to be differentially expressed in temporal lobe epilepsy regardless of hippocampal sclerosis grade (miR-27b-5p, miR-129-2-3p, miR-129, miR-193a-5p, miR-362-3p and miR-520f upregulated; miR-218, miR-184, miR-449b, miR-34b, miR-34c and miR-548c downregulated).
Figure 4.
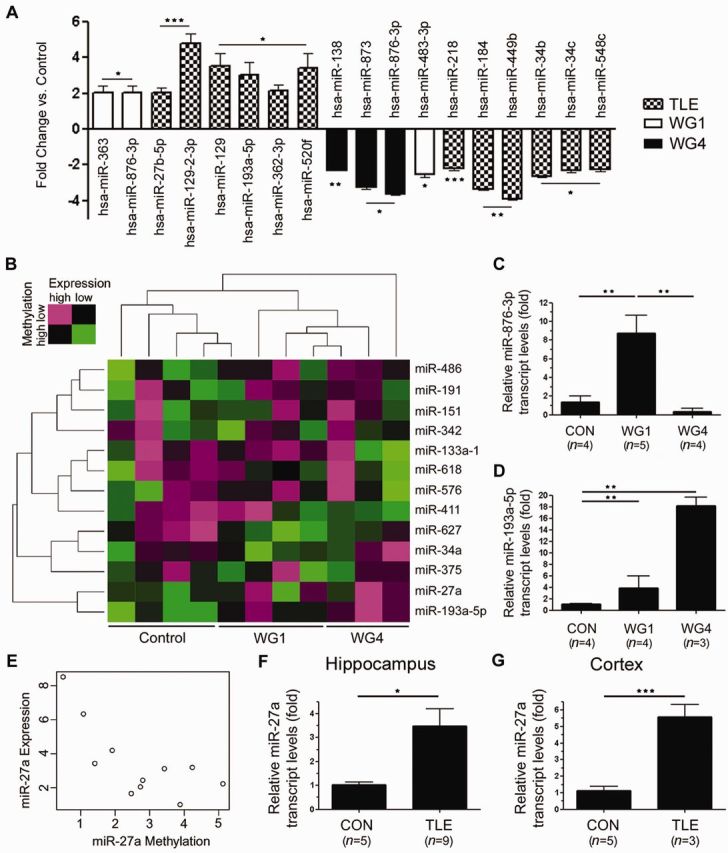
MicroRNA expression and methylation sensitive microRNA in temporal lobe epilepsy. (A) Differential microRNA expression in temporal lobe epilepsy. (B) Two dimensional hierarchical cluster analysis of methylation sensitive microRNA. The methylation peak of each microRNA exhibited a significant inverse correlation with expression (Spearman’s r < −0.53; P < 0.05). Green indicates low microRNA expression with high methylation, whereas magenta indicates high expression with low methylation. (C) Real-time PCR verification of increased miR-876-3p expression in WG1samples. miR-876-3p was undetectable in two of the WG4 samples. (D) Real-time PCR verification of increased miR-193a-5p expression in temporal lobe epilepsy, regardless of pathology grade. (E) Representative graph for study showing inverse correlation of miR-27a expression and methylation peak score. (F and G) Real-time PCR verification of increased miR-27a expression in temporal lobe epilepsy in the hippocampus and cortex respectively. *P < 0.05, **P < 0.01, ***P < 0.001. TLE = temporal lobe epilepsy.
Differential microRNA expression was confirmed by real time PCR analysis of individual microRNAs of interest (Fig. 4). Of particular note was the differential expression of miR-876-3p. This microRNA was undetected in two of the WG4 samples, barely detectable in the remaining WG4 samples and was significantly upregulated in WG1 samples (Fig. 4C; ANOVA P < 0.01). MiR-876-3p therefore has potential value as a marker for WG1 hippocampal sclerosis. Furthermore, miR-193a-5p was confirmed to be upregulated in temporal lobe epilepsy, regardless of hippocampal sclerosis grade (Fig. 4D; ANOVA P < 0.01).
DNA methylation sensitive non-coding RNA expression in human temporal lobe epilepsy
An integrated analysis correlating microRNA methylation status and expression in temporal lobe epilepsy was carried out using a combination of methylated DNA immunoprecipitation and microRNA profiling techniques. The methylation profiles of patient samples were established using methylated DNA immunoprecipitation and hybridization to custom tiling arrays spanning 50 kb upstream and 20 kb downstream of all 754 microRNA included on TaqMan® Array Human microRNA Cards. Based on the predicted transcriptional start site and putative promoter regions for the majority of microRNA, analysis was performed within 10 kb upstream of each pre-microRNA (Saini et al., 2007; Das et al., 2013). Statistically significant DNA methylation peaks within this region were identified and the mean probe score calculated for each sample, allowing quantification of DNA methylation levels. The DNA methylation peak mapping closest to the pre-microRNA sequence where the levels of methylation exhibited a significant inverse correlation with microRNA expression was identified (Spearman’s r < − 0.53; P < 0.05).
In total, the methylation scores of 13 microRNAs were found to be significantly inversely correlated with expression across patient samples. Two dimensional hierarchical cluster analysis was carried out based on both expression of the 13 methylation sensitive microRNA and the methylation levels of the peak mapping closest to the pre-microRNA (Fig. 4B). In general, WG1 and WG4 samples were more similar to each other than to post-mortem controls. Of the 13 methylation sensitive microRNAs in temporal lobe epilepsy, four had been previously demonstrated to be methylation sensitive in cancer; miR-129, miR-151, miR-191, miR-27a and miR-375 (Das et al., 2013). Although their expression was not differentially regulated in this study, several of the methylation-sensitive microRNA had previously been shown to exhibit differential expression in temporal lobe epilepsy. These included miR-411 [differentially down regulated in temporal lobe epilepsy regardless of hippocampal sclerosis grade (McKiernan et al., 2012)], miR-193a and miR-27a [both differentially upregulated in temporal lobe epilepsy regardless of hippocampal sclerosis grade (Kan et al., 2012)]. Differential upregulation of the methylation sensitive microRNA, miR-27a, in temporal lobe epilepsy regardless of hippocampal sclerosis grade was confirmed by real-time PCR analysis in both the hippocampus and cortex (Fig. 4E–G). Functional analysis of predicted and experimentally verified targets of the set of methylation sensitive microRNA in temporal lobe epilepsy revealed no statistical enrichment after correction for multiple comparison (Benjamini correction) (Grimson et al., 2007; Huang da et al., 2009; Vergoulis et al., 2012).
Differential methylation of long non-coding RNA in human temporal lobe epilepsy
Four long non-coding RNA were found to be differentially hypermethylated in temporal lobe epilepsy regardless of hippocampal sclerosis grade (Supplementary Table 1 and Supplementary Fig. 3). These were urothelial cancer associated 1 (non-protein coding; UCA1), adenosine deaminase, RNA-specific, B2, antisense RNA 1 (ADARB2-AS1), long intergenic non-protein coding RNA 324 (LINC324) and mitogen-activated protein kinase 14, antisense RNA 1 (MAP3K14-AS1). Attempts to verify differential expression of these long non-coding RNA by real-time PCR failed owing to degradation of long RNA transcripts in post-mortem controls. Although transcript was detectable in temporal lobe epilepsy samples, confirmation of downregulation of the long non-coding RNA in temporal lobe epilepsy compared to control was not possible. However, hypermethylation of several of the long non-coding RNA was confirmed in temporal lobe epilepsy samples by bisulphite sequencing (Supplementary Fig. 3A and B). Differential methylation may therefore play a role in transcriptional regulation of long non-coding RNA in human temporal lobe epilepsy.
Discussion
The present study is the first genome-wide analysis of DNA methylation in the hippocampus of patients with drug refractory temporal lobe epilepsy. Our pilot study reveals that a limited number of genes display altered methylation profiles in temporal lobe epilepsy as well as distinct methylation changes in the hippocampus of patients with WG1 and WG4 hippocampal sclerosis. Hypermethylation of gene promoters was prominent in temporal lobe epilepsy. Our analysis also led to the identification of miR-876-3p, a microRNA with potential value as a marker for WG1 hippocampal sclerosis, and through an integrated analysis correlating microRNA methylation status and expression, we identified 13 methylation-sensitive microRNA in temporal lobe epilepsy. This study contributes to our understanding of mechanisms regulating coding and non-coding gene expression in temporal lobe epilepsy and hippocampal sclerosis grading and the alterations produced when the brain is exposed to persistent seizure activity.
Epigenetic processes such as DNA methylation are attractive to explain the underlying patho-mechanisms supporting sustained hyperexcitability in chronic human epilepsy as well as pharmacoresistance (Kobow and Blumcke, 2011; Lubin, 2012; Roopra et al., 2012). However, it has been uncertain to date how much of the genome displays differential methylation. A major finding in the present study was that <150 protein-coding genes displayed differential methylation in the hippocampus of patients with intractable temporal lobe epilepsy. This indicates that the majority of DNA methylation assessed by DNA immunoprecipitation of methyl-cytosine is static in the human hippocampus. This is broadly consistent with the recognized stability of the majority of DNA methylation in the brain and emerging data in other human neurologic disorders, including autism (Ladd-Acosta et al., 2014), depression (Sabunciyan et al., 2012) and Alzheimer’s disease (Bakulski et al., 2012). Hypermethylation of gene promoters was the major difference between temporal lobe epilepsy and control, the effect of which would most likely be to suppress transcription (Urdinguio et al., 2009). Our human data are consistent with findings in rodent models of temporal lobe epilepsy where hypermethylation was also the predominant effect (Kobow et al., 2013; Williams-Karnesky et al., 2013). This differs markedly from the hypomethylation landscape and the individual genes involved in the hippocampus after status epilepticus in mice (Miller-Delaney et al., 2012). DNA methylation patterns in human temporal lobe epilepsy therefore display disease-stage specific patterns although the proportion of the genome potentially experiencing changes in DNA methylation appears unexpectedly restricted.
Neuronal genes associated with synaptic function, calcium and potassium channels were among those displaying hypermethylation in resected hippocampus from temporal lobe epilepsy patients. As astrogliosis was present in all patient samples this suggests dynamic methylation in temporal lobe epilepsy may be more favourable in neurons, perhaps due to endogenous levels of molecular machinery (Akbarian et al., 2001). Increased DNA methylation in neurons could be a response to hyperexcitation or be an adaptive mechanism to limit over-excitation or insufficient inhibition (Kobow and Blumcke, 2011; Lubin, 2012).
Most of the genes displaying differential DNA methylation in the hippocampus of temporal lobe epilepsy patients have not been previously linked to epilepsy (Pitkanen and Lukasiuk, 2011; Thomas and Berkovic, 2014). Two exceptions were hypermethylation of PSAP (prosaposin) and ATPAF2, mutations that have recently been reported in epilepsy (Lemke et al., 2012). Similar conclusions were drawn from methylation profiles in a rat kainate model of epilepsy, where no genes with strong links to seizures/epilepsy were found among the list of genes undergoing differential DNA methylation (Williams-Karnesky et al., 2013). Thus, differences in DNA methylation do not seem to be likely causes of the sustained changes to genes with direct roles in controlling the balance between excitation and inhibition characteristic of the human hippocampus in chronic pharmacoresistant temporal lobe epilepsy.
Gene ontology analysis showed differences in the biological pathways impacted for the genes displaying differential methylation in temporal lobe epilepsy depending on pathology grade. For WG1 samples, many hypermethylated genes were associated with developmental processes. This might be an adaptation to maintain existing neuroanatomical structures against the ontogenic effects of seizure activity. In WG4 samples, hypermethylation of cell death genes was prominent. This might be evidence of molecular adaptations that resist further cell loss in the tissue. Other commonalities with published findings on the pathways controlled by DNA methylation in experimental epilepsy include processes such as DNA binding and cell death, which were prominent processes hypermethylated in our human data and experimental epilepsy (Kobow et al., 2013). Another notable finding was increased hypermethylation of genes associated with nuclear functions, including DNA and RNA binding. These findings are in line with recent animal data that identified DNA methylation targets in genes whose products interact with DNA or play a role in gene transcription and translation (Miller-Delaney et al., 2012; Williams-Karnesky et al., 2013). These data suggest that homeostatic functions in the nucleus involving stability and processing of DNA or RNA might be of mechanistic importance for understanding why the epileptic phenotype is maintained and, in some cases, becomes progressive in nature.
Some processes we expected to see featured did not. We found little evidence for DNA methylation regulation of inflammation-associated genes in human temporal lobe epilepsy. As inflammation is a prominent feature of temporal lobe epilepsy (Vezzani et al., 2011) we must assume that other processes besides methylation control these changes. Taken together, our data suggests that a restricted set of genes are amenable to methylation change in human temporal lobe epilepsy, while many processes are not. Why DNA methylation is critical to certain genes and not others remains to be resolved.
The present study found rather weak associations between methylation status and transcript levels of protein coding genes. From the tested genes only a trend towards the reduction in SOX1 expression predicted by differential hypermethylation in WG4 samples was observed. This may be significant because Sox1 deficient mice suffer from epilepsy associated with abnormal ventral forebrain development (Malas et al., 2003). Previous findings in chronic rat epilepsy also found that the majority of methylation changes (79%) did not result in changes in gene expression (Kobow et al., 2013). However in the remaining cohort, hypermethylation of gene promoters was associated with gene silencing. Also, altering methylation can influence seizure development. For example, adenosine augmentation therapy reduced hypermethylation of genes and reduced epileptogenesis (Williams-Karnesky et al., 2013) and a ketogenic diet also resulted in a reduction of hypermethylation events (Kobow et al., 2013). However, rescue of loci-specific DNA methylation and gene expression to control levels was not complete following treatment, suggesting that ultimate control of DNA methylation by seizure activity is not overarching.
We did not identify specific regions of chromosomal enrichment for DNA methylation. This is in agreement with data from mice subject to status epilepticus, which found little evidence of chromosomal clustering of DNA methylation with the exception of an area on chromosome 4 (Miller-Delaney et al., 2012). However, we found that the function of genes displaying differential methylation was heavily skewed toward genes with nuclear activities. This is similar to findings after experimental prolonged seizures where genes with nuclear functions were heavily enriched (Miller-Delaney et al., 2012). This suggests a non-random process and also that DNA methylation may be involved in controlling a restricted aspect of cell function in response to pathophysiological activity.
A major finding in the present study was that DNA methylation seems to exert strong control of microRNA and possibly other non-coding RNA in human temporal lobe epilepsy. Evidence for differential expression of non-coding RNA, in particular microRNA, in the pathogenesis of epilepsy has recently emerged (Henshall, 2014). To this end, the present research has further elucidated findings in the rat highlighting extensive DNA methylation changes within CpG islands of non-genic regions (Kobow et al., 2013). By using an integrated analysis of microRNA expression and DNA methylation of 754 microRNAs, we found 13 methylation-sensitive microRNAs, several of which are differentially expressed in temporal lobe epilepsy depending on hippocampal sclerosis grading. The majority of these are unique to the present study, although microRNA profiling has been previously documented in temporal lobe epilepsy, both incorporating and independent of hippocampal sclerosis scoring (Kan et al., 2012; McKiernan et al., 2012). The results here agree with previous findings of differential microRNA expression in several instances. These include the upregulation of miR-129-3p and miR-362-3p in temporal lobe epilepsy regardless of hippocampal sclerosis grade (Kan et al., 2012). Furthermore, previously documented downregulation of miR-138 in temporal lobe epilepsy with hippocampal sclerosis was confirmed in our analysis, although upregulation in temporal lobe epilepsy without hippocampal sclerosis was not evident (Kan et al., 2012). Similarly, downregulation of miR-184 in temporal lobe epilepsy regardless of hippocampal sclerosis grade was evident, a finding which agrees with previously documented downregulation in temporal lobe epilepsy with hippocampal sclerosis, but differs from the upregulation previously found in patients without hippocampal sclerosis (Kan et al., 2012). Some of the altered microRNAs in human temporal lobe epilepsy are of potential pathophysiological significance. Expression of miR-129 was increased in temporal lobe epilepsy and has been implicated in suppression of Kv1.1 expression in neurons (Sosanya et al., 2013). MiR-193a was increased in temporal lobe epilepsy and ectopic expression (Ory et al., 2011) or demethylation of miR-193a can promote apoptosis in non-neuronal cells (Wang et al., 2013). The upregulation of this microRNA exclusively in WG4 raises the possibility that this microRNA may contribute to cell death. The reduction in miR-138 specific to WG4 matches other work (Kan et al., 2012) and the predicted effect of a loss of miR-138 would be an increase in spine size which could promote hyperexcitability (Siegel et al., 2009). Thus, miR-138 may join miR-134 (Jimenez-Mateos et al., 2012) and miR-128 (Tan et al., 2013) as potential epilepsy microRNAs with structural targets. However, recent work from our group showed that silencing miR-134 increased spine size, but was nevertheless anticonvulsive in the pilocarpine model (Jimenez-Mateos et al., 2014). To this list we add miR-876-3p and miR-193a-5p, which are novel pathology grade-specific microRNAs regulated by DNA methylation.
There are some limitations of the present study. The main findings should be validated in a larger cohort, perhaps using samples from several neurosurgical centres. The use of whole tissue blocks masks DNA methylation differences between glia and neurons and individual cell profiles (e.g. excitatory versus inhibitory neuron profiles). Future studies may be able to feature single cell combined transcriptome-methylome analysis (Macaulay and Voet, 2014). Temporal lobe epilepsy patients were all being treated with antiepileptic drugs prior to surgery and it is unknown whether these could have direct or indirect effects on methylation patterns. Another caveat is that post-mortem controls may contain autopsy delay effects that alter DNA methylation profiles from baseline. Lastly, future work should assess the influence of non-CG methylation and 5-hydroxymethylcytosine in the epigenetic control of gene expression in human temporal lobe epilepsy (Lister et al., 2013).
In summary, the present study reveals that DNA methylation patterns display pathology-specific differences in human hippocampus from temporal lobe epilepsy patients but raises questions about the influence of these changes as a pathomechanism controlling protein-coding gene expression in epilepsy. The data reveal, instead, that non-coding RNA such as microRNA may be particularly sensitive to DNA methylation thereby adding valuable insight to the molecular mechanisms controlling gene expression in human temporal lobe epilepsy.
Acknowledgements
The authors would like to thank Norman Delanty, Michael Farrell and Donncha O’Brien for support with clinical studies and Gianpiero Cavalleri and Catherine Mooney for useful technical advice. We thank the patients for the donation of tissue and the University of Maryland Brain and Tissue Bank for provision of autopsy control samples.
Glossary
Abbreviations
- CA
cornu ammonis
- CpG
C-phosphate-G
- WG
Watson Grade
Funding
This work was supported by funding from Brainwave (Epilepsy Ireland) and the Medical Research Charities Group (2011/7), Health Research Board Ireland (PHD/2007/11) Science Foundation Ireland (08/IN1/B1875, 13/IA/1891) and Children's Medical and Research Foundation, Our Lady's Children's Hospital, Crumlin.
Supplementary material
Supplementary material is available at Brain online.
References
- Akbarian S, Chen RZ, Gribnau J, Rasmussen TP, Fong H, Jaenisch R, et al. Expression pattern of the Rett syndrome gene MeCP2 in primate prefrontal cortex. Neurobiol Dis. 2001;8:784–91. doi: 10.1006/nbdi.2001.0420. [DOI] [PubMed] [Google Scholar]
- Bakulski KM, Dolinoy DC, Sartor MA, Paulson HL, Konen JR, Lieberman AP, et al. Genome-wide DNA methylation differences between late-onset Alzheimer's disease and cognitively normal controls in human frontal cortex. J Alzheimer Dis. 2012;29:571–88. doi: 10.3233/JAD-2012-111223. [DOI] [PMC free article] [PubMed] [Google Scholar]
- Blumcke I, Thom M, Aronica E, Armstrong DD, Bartolomei F, Bernasconi A, et al. International consensus classification of hippocampal sclerosis in temporal lobe epilepsy: a task force report from theILAE commission on diagnostic methods. Epilepsia. 2013;54:1315–29. doi: 10.1111/epi.12220. [DOI] [PubMed] [Google Scholar]
- Boison D, Sandau US, Ruskin DN, Kawamura M, Jr, Masino SA. Homeostatic control of brain function - new approaches to understand epileptogenesis. Front Cell Neurosci. 2013;7:109. doi: 10.3389/fncel.2013.00109. [DOI] [PMC free article] [PubMed] [Google Scholar]
- Buckley PG, Das S, Bryan K, Watters KM, Alcock L, Koster J, et al. Genome-wide DNA methylation analysis of neuroblastic tumors reveals clinically relevant epigenetic events and large-scale epigenomic alterations localized to telomeric regions. Int J Cancer. 2010;128:2296–305. doi: 10.1002/ijc.25584. [DOI] [PubMed] [Google Scholar]
- Das S, Bryan K, Buckley PG, Piskareva O, Bray IM, Foley N, et al. Modulation of neuroblastoma disease pathogenesis by an extensive network of epigenetically regulated microRNAs. Oncogene. 2013;32:2927–36. doi: 10.1038/onc.2012.311. [DOI] [PMC free article] [PubMed] [Google Scholar]
- Das S, Foley N, Bryan K, Watters KM, Bray I, Murphy DM, et al. MicroRNA mediates DNA demethylation events triggered by retinoic acid during neuroblastoma cell differentiation. Cancer Res. 2010;70:7874–81. doi: 10.1158/0008-5472.CAN-10-1534. [DOI] [PMC free article] [PubMed] [Google Scholar]
- De Preter K, Barriot R, Speleman F, Vandesompele J, Moreau Y. Positional gene enrichment analysis of gene sets for high-resolution identification of overrepresented chromosomal regions. Nucleic Acid Res. 2008;36:e43. doi: 10.1093/nar/gkn114. [DOI] [PMC free article] [PubMed] [Google Scholar]
- Doherty MJ, Rostad SW, Kraemer DL, Vossler DG, Haltiner AM. Neocortical gliosis in temporal lobe epilepsy: gender-based differences. Epilepsia. 2007;48:1455–9. doi: 10.1111/j.1528-1167.2007.01046.x. [DOI] [PubMed] [Google Scholar]
- Endres M, Meisel A, Biniszkiewicz D, Namura S, Prass K, Ruscher K, et al. DNA methyltransferase contributes to delayed ischemic brain injury. J Neurosci. 2000;20:3175–81. doi: 10.1523/JNEUROSCI.20-09-03175.2000. [DOI] [PMC free article] [PubMed] [Google Scholar]
- Feng J, Zhou Y, Campbell SL, Le T, Li E, Sweatt JD, et al. Dnmt1 and Dnmt3a maintain DNA methylation and regulate synaptic function in adult forebrain neurons. Nat Neurosci. 2010;13:423–30. doi: 10.1038/nn.2514. [DOI] [PMC free article] [PubMed] [Google Scholar]
- Grimson A, Farh KK, Johnston WK, Garrett-Engele P, Lim LP, Bartel DP. MicroRNA targeting specificity in mammals: determinants beyond seed pairing. Mol Cell. 2007;27:91–105. doi: 10.1016/j.molcel.2007.06.017. [DOI] [PMC free article] [PubMed] [Google Scholar]
- Guo JU, Ma DK, Mo H, Ball MP, Jang MH, Bonaguidi MA, et al. Neuronal activity modifies the DNA methylation landscape in the adult brain. Nat Neurosci. 2011a;14:1345–51. doi: 10.1038/nn.2900. [DOI] [PMC free article] [PubMed] [Google Scholar]
- Guo JU, Su Y, Zhong C, Ming GL, Song H. Hydroxylation of 5-methylcytosine by TET1 promotes active DNA demethylation in the adult brain. Cell. 2011b;145:423–34. doi: 10.1016/j.cell.2011.03.022. [DOI] [PMC free article] [PubMed] [Google Scholar]
- Henshall DC. MicroRNA and epilepsy: profiling, functions and potential clinical applications. Curr Opin Neurol. 2014;27:199–205. doi: 10.1097/WCO.0000000000000079. [DOI] [PMC free article] [PubMed] [Google Scholar]
- Henshall DC, Sinclair J, Simon RP. Relationship between seizure-induced transcription of the DNA damage-inducible gene GADD45, DNA fragmentation, and neuronal death in focally evoked limbic epilepsy. J Neurochem. 1999;73:1573–83. doi: 10.1046/j.1471-4159.1999.0731573.x. [DOI] [PubMed] [Google Scholar]
- Huang da W, Sherman BT, Lempicki RA. Systematic and integrative analysis of large gene lists using DAVID bioinformatics resources. Nat Prot. 2009;4:44–57. doi: 10.1038/nprot.2008.211. [DOI] [PubMed] [Google Scholar]
- Jaenisch R, Bird A. Epigenetic regulation of gene expression: how the genome integrates intrinsic and environmental signals. Nat Genet. 2003;33(Suppl):245–54. doi: 10.1038/ng1089. [DOI] [PubMed] [Google Scholar]
- Jimenez-Mateos EM, Engel T, Merino-Serrais P, Fernaud-Espinosa I, Rodriguez-Alvarez N, Reynolds J, et al. Antagomirs targeting microRNA-134 increase hippocampal pyramidal neuron spine volume in vivo and protect against pilocarpine-induced status epilepticus. Brain Struct Funct. 2014 doi: 10.1007/s00429-014-0798-5. Advance Access published on May 30, 2014, doi:10.1007/s00429-014-0798-5. [DOI] [PubMed] [Google Scholar]
- Jimenez-Mateos EM, Engel T, Merino-Serrais P, McKiernan RC, Tanaka K, Mouri G, et al. Silencing microRNA-134 produces neuroprotective and prolonged seizure-suppressive effects. Nat Med. 2012;18:1087–94. doi: 10.1038/nm.2834. [DOI] [PMC free article] [PubMed] [Google Scholar]
- Jimenez-Mateos EM, Henshall DC. Seizure preconditioning and epileptic tolerance: models and mechanisms. Int J Physiol Pathophysiol Pharmacol. 2009;1:180–91. [PMC free article] [PubMed] [Google Scholar]
- Kaas GA, Zhong C, Eason DE, Ross DL, Vachhani RV, Ming GL, et al. TET1 controls CNS 5-methylcytosine hydroxylation, active DNA demethylation, gene transcription, and memory formation. Neuron. 2013;79:1086–93. doi: 10.1016/j.neuron.2013.08.032. [DOI] [PMC free article] [PubMed] [Google Scholar]
- Kan AA, van Erp S, Derijck AA, de Wit M, Hessel EV, O'Duibhir E, et al. Genome-wide microRNA profiling of human temporal lobe epilepsy identifies modulators of the immune response. Cell Mol Life Sci. 2012;69:3127–45. doi: 10.1007/s00018-012-0992-7. [DOI] [PMC free article] [PubMed] [Google Scholar]
- Kin T, Ono Y. Idiographica: a general-purpose web application to build idiograms on-demand for human, mouse and rat. Bioinformatics. 2007;23:2945–6. doi: 10.1093/bioinformatics/btm455. [DOI] [PubMed] [Google Scholar]
- Kobow K, Blumcke I. The methylation hypothesis: do epigenetic chromatin modifications play a role in epileptogenesis? Epilepsia. 2011;52(Suppl 4):15–9. doi: 10.1111/j.1528-1167.2011.03145.x. [DOI] [PubMed] [Google Scholar]
- Kobow K, Jeske I, Hildebrandt M, Hauke J, Hahnen E, Buslei R, et al. Increased reelin promoter methylation is associated with granule cell dispersion in human temporal lobe epilepsy. J Neuropathol Exp Neurol. 2009;68:356–64. doi: 10.1097/NEN.0b013e31819ba737. [DOI] [PubMed] [Google Scholar]
- Kobow K, Kaspi A, Harikrishnan KN, Kiese K, Ziemann M, Khurana I, et al. Deep sequencing reveals increased DNA methylation in chronic rat epilepsy. Acta Neuropath. 2013;126:741–56. doi: 10.1007/s00401-013-1168-8. [DOI] [PMC free article] [PubMed] [Google Scholar]
- Ladd-Acosta C, Hansen KD, Briem E, Fallin MD, Kaufmann WE, Feinberg AP. Common DNA methylation alterations in multiple brain regions in autism. Mol Psych. 2014;19:862–71. doi: 10.1038/mp.2013.114. [DOI] [PMC free article] [PubMed] [Google Scholar]
- Lemke JR, Riesch E, Scheurenbrand T, Schubach M, Wilhelm C, Steiner I, et al. Targeted next generation sequencing as a diagnostic tool in epileptic disorders. Epilepsia. 2012;53:1387–98. doi: 10.1111/j.1528-1167.2012.03516.x. [DOI] [PubMed] [Google Scholar]
- Lister R, Mukamel EA, Nery JR, Urich M, Puddifoot CA, Johnson ND, et al. Global epigenomic reconfiguration during mammalian brain development. Science. 2013;341:1237905. doi: 10.1126/science.1237905. [DOI] [PMC free article] [PubMed] [Google Scholar]
- Lubin FD. Epileptogenesis: can the science of epigenetics give us answers? Epilepsy Curr. 2012;12:105–10. doi: 10.5698/1535-7511-12.3.105. [DOI] [PMC free article] [PubMed] [Google Scholar]
- Ma DK, Jang MH, Guo JU, Kitabatake Y, Chang ML, Pow-Anpongkul N, et al. Neuronal activity-induced Gadd45b promotes epigenetic DNA demethylation and adult neurogenesis. Science. 2009;323:1074–7. doi: 10.1126/science.1166859. [DOI] [PMC free article] [PubMed] [Google Scholar]
- Macaulay IC, Voet T. Single cell genomics: advances and future perspectives. PLoS Genet. 2014;10:e1004126. doi: 10.1371/journal.pgen.1004126. [DOI] [PMC free article] [PubMed] [Google Scholar]
- Malas S, Postlethwaite M, Ekonomou A, Whalley B, Nishiguchi S, Wood H, et al. Sox1-deficient mice suffer from epilepsy associated with abnormal ventral forebrain development and olfactory cortex hyperexcitability. Neuroscience. 2003;119:421–32. doi: 10.1016/s0306-4522(03)00158-1. [DOI] [PubMed] [Google Scholar]
- McKiernan RC, Jimenez-Mateos EM, Bray I, Engel T, Brennan GP, Sano T, et al. Reduced mature microRNA levels in association with dicer loss in human temporal lobe epilepsy with hippocampal sclerosis. PloS One. 2012;7:e35921. doi: 10.1371/journal.pone.0035921. [DOI] [PMC free article] [PubMed] [Google Scholar]
- Miller-Delaney SF, Das S, Sano T, Jimenez-Mateos EM, Bryan K, Buckley PG, et al. Differential DNA methylation patterns define status epilepticus and epileptic tolerance. J Neurosci. 2012;32:1577–88. doi: 10.1523/JNEUROSCI.5180-11.2012. [DOI] [PMC free article] [PubMed] [Google Scholar]
- Miller-Delaney SF, Das S, Stallings RL, Henshall DC. Investigating gene promoter methylation in a mouse model of status epilepticus. Meth Mol Biol. 2013;1067:87–101. doi: 10.1007/978-1-62703-607-8_7. [DOI] [PubMed] [Google Scholar]
- Miller CA, Sweatt JD. Covalent modification of DNA regulates memory formation. Neuron. 2007;53:857–69. doi: 10.1016/j.neuron.2007.02.022. [DOI] [PubMed] [Google Scholar]
- Ory B, Ramsey MR, Wilson C, Vadysirisack DD, Forster N, Rocco JW, et al. A microRNA-dependent program controls p53-independent survival and chemosensitivity in human and murine squamous cell carcinoma. J Clin Invest. 2011;121:809–20. doi: 10.1172/JCI43897. [DOI] [PMC free article] [PubMed] [Google Scholar]
- Pitkanen A, Lukasiuk K. Mechanisms of epileptogenesis and potential treatment targets. Lancet Neurol. 2011;10:173–86. doi: 10.1016/S1474-4422(10)70310-0. [DOI] [PubMed] [Google Scholar]
- Qureshi IA, Mehler MF. Epigenetic mechanisms underlying human epileptic disorders and the process of epileptogenesis. Neurobiol Dis. 2010;39:53–60. doi: 10.1016/j.nbd.2010.02.005. [DOI] [PMC free article] [PubMed] [Google Scholar]
- Qureshi IA, Mehler MF. Emerging roles of non-coding RNAs in brain evolution, development, plasticity and disease. Nat Rev Neurosci. 2012;13:528–41. doi: 10.1038/nrn3234. [DOI] [PMC free article] [PubMed] [Google Scholar]
- Robertson KD. DNA methylation and human disease. Nat Rev Genet. 2005;6:597–610. doi: 10.1038/nrg1655. [DOI] [PubMed] [Google Scholar]
- Roopra A, Dingledine R, Hsieh J. Epigenetics and epilepsy. Epilepsia. 2012;53(Suppl 9):2–10. doi: 10.1111/epi.12030. [DOI] [PMC free article] [PubMed] [Google Scholar]
- Ryley Parrish R, Albertson AJ, Buckingham SC, Hablitz JJ, Mascia KL, Davis Haselden W, et al. Status epilepticus triggers early and late alterations in brain-derived neurotrophic factor and NMDA glutamate receptor Grin2b DNA methylation levels in the hippocampus. Neuroscience. 2013;248C:602–19. doi: 10.1016/j.neuroscience.2013.06.029. [DOI] [PMC free article] [PubMed] [Google Scholar]
- Sabunciyan S, Aryee MJ, Irizarry RA, Rongione M, Webster MJ, Kaufman WE, et al. Genome-wide DNA methylation scan in major depressive disorder. PLoS One. 2012;7:e34451. doi: 10.1371/journal.pone.0034451. [DOI] [PMC free article] [PubMed] [Google Scholar]
- Saini HK, Griffiths-Jones S, Enright AJ. Genomic analysis of human microRNA transcripts. Proc Natl Acad Sci USA. 2007;104:17719–24. doi: 10.1073/pnas.0703890104. [DOI] [PMC free article] [PubMed] [Google Scholar]
- Siegel G, Obernosterer G, Fiore R, Oehmen M, Bicker S, Christensen M, et al. A functional screen implicates microRNA-138-dependent regulation of the depalmitoylation enzyme APT1 in dendritic spine morphogenesis. Nat Cell Biol. 2009;11:705–16. doi: 10.1038/ncb1876. [DOI] [PMC free article] [PubMed] [Google Scholar]
- Sosanya NM, Huang PP, Cacheaux LP, Chen CJ, Nguyen K, Perrone-Bizzozero NI, et al. Degradation of high affinity HuD targets releases Kv1.1 mRNA from miR-129 repression by mTORC1. J Cell Biol. 2013;202:53–69. doi: 10.1083/jcb.201212089. [DOI] [PMC free article] [PubMed] [Google Scholar]
- Tan CL, Plotkin JL, Veno MT, von Schimmelmann M, Feinberg P, Mann S, et al. MicroRNA-128 governs neuronal excitability and motor behavior in mice. Science. 2013;342:1254–8. doi: 10.1126/science.1244193. [DOI] [PMC free article] [PubMed] [Google Scholar]
- Tao J, Wu H, Lin Q, Wei W, Lu XH, Cantle JP, et al. Deletion of astroglial dicer causes non-cell-autonomous neuronal dysfunction and degeneration. J Neurosci. 2011;31:8306–19. doi: 10.1523/JNEUROSCI.0567-11.2011. [DOI] [PMC free article] [PubMed] [Google Scholar]
- Thomas RH, Berkovic SF. The hidden genetics of epilepsy-a clinically important new paradigm. Nat Rev Neurol. 2014;10:283–92. doi: 10.1038/nrneurol.2014.62. [DOI] [PubMed] [Google Scholar]
- Urdinguio RG, Sanchez-Mut JV, Esteller M. Epigenetic mechanisms in neurological diseases: genes, syndromes, and therapies. Lancet Neurol. 2009;8:1056–72. doi: 10.1016/S1474-4422(09)70262-5. [DOI] [PubMed] [Google Scholar]
- Vergoulis T, Vlachos IS, Alexiou P, Georgakilas G, Maragkakis M, Reczko M, et al. TarBase 6.0: capturing the exponential growth of miRNA targets with experimental support. Nucleic Acid Res. 2012;40:D222–9. doi: 10.1093/nar/gkr1161. [DOI] [PMC free article] [PubMed] [Google Scholar]
- Vezzani A, French J, Bartfai T, Baram TZ. The role of inflammation in epilepsy. Nat Rev Neurol. 2011;7:31–40. doi: 10.1038/nrneurol.2010.178. [DOI] [PMC free article] [PubMed] [Google Scholar]
- Wang J, Yang B, Han L, Li X, Tao H, Zhang S, et al. Demethylation of miR-9-3 and miR-193a genes suppresses proliferation and promotes apoptosis in non-small cell lung cancer cell lines. Cell Physiol Biochem. 2013;32:1707–19. doi: 10.1159/000356605. [DOI] [PubMed] [Google Scholar]
- Watson C, Nielsen SL, Cobb C, Burgerman R, Williamson B. Pathological grading system for hippocampal sclerosis: correlation with magnetic resonance imaging-based volume measurements of the hippocampus. J Epilepsy. 1996;9:56–64. [Google Scholar]
- Wieser HG. ILAE Commission Report. Mesial temporal lobe epilepsy with hippocampal sclerosis. Epilepsia. 2004;45:695–714. doi: 10.1111/j.0013-9580.2004.09004.x. [DOI] [PubMed] [Google Scholar]
- Williams-Karnesky RL, Sandau US, Lusardi TA, Lytle NK, Farrell JM, Pritchard EM, et al. Epigenetic changes induced by adenosine augmentation therapy prevent epileptogenesis. J Clin Invest. 2013;123:3552–63. doi: 10.1172/JCI65636. [DOI] [PMC free article] [PubMed] [Google Scholar]
- Zhu Q, Wang L, Zhang Y, Zhao FH, Luo J, Xiao Z, et al. Increased expression of DNA methyltransferase 1 and 3a in human temporal lobe epilepsy. J Mol Neurosci. 2012;46:420–6. doi: 10.1007/s12031-011-9602-7. [DOI] [PubMed] [Google Scholar]