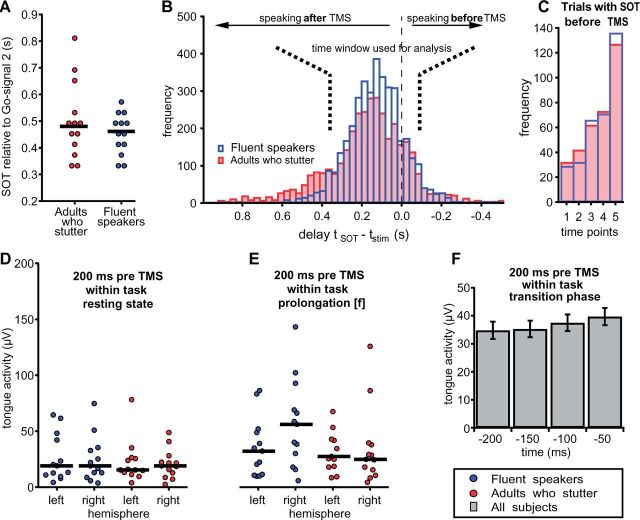
Figure 2.
No group differences for speech onset time and tongue’s pre-TMS innervation. Speech onset times of participants. (A) The medians of the speech onset times are plotted for every subject. A Mann-Whitney test detected no differences between groups (P = 0.724). The solid lines represent the group medians. (B) Histograms illustrate the distribution of speech onset time normalized to the time points of the TMS pulse. Bins that appear at the left side of line zero contain the number of trials where the TMS pulse was applied before speech onset. (C) Amount of trials in which TMS occurred after speech onset as shown on the right side of line zero in the histogram. Time points 1 to 5 represent the times of the TMS pulse with regard to the second go-signal (240 ms, 280 ms, 320 ms, 360 ms and 400 ms). (D and E) Tongue activity quantified as the average over the offset corrected, rectified EMG signal during a 200 ms interval prior to transcranial magnetic stimulation. EMG signals were averaged over the two electrode pairs attached to the left side of the tongue and to the right side of the tongue. (C) For the transition phase after the second go-signal the time course of tongue activity is separated into 50 ms bins over a period of 200 ms. Tongue pressure was comparable between groups across conditions and rose slightly towards the transition phase. SOT = speech onset time.

