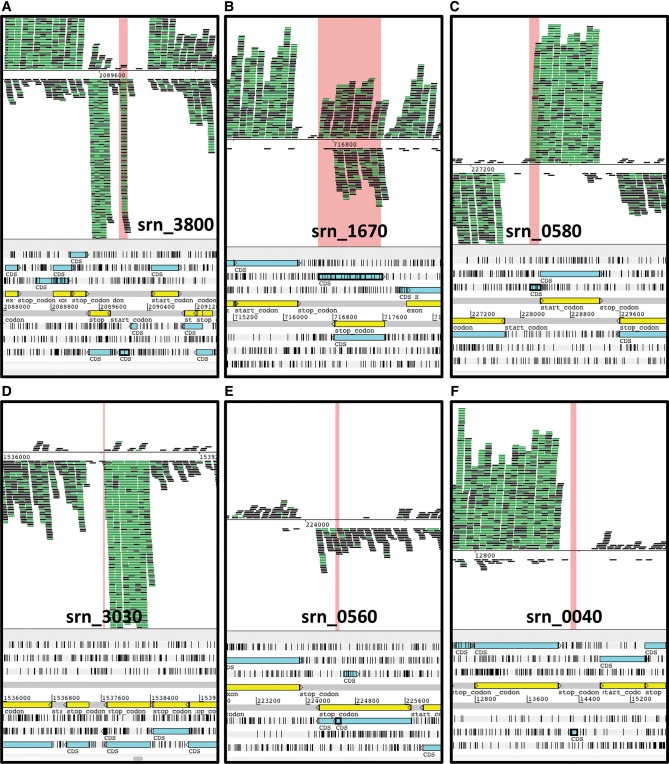
FIGURE 2.
Examples of the visualization of read mapping from strain Newman using Artemis. The srns are highlighted in pink. (A) Typical visualization for a srn described as transcript. (B) Example of an antisense srn. (C) Reads overlapping with a CDS and considered as a 5′ UTR. (D) srn described as a 3′ UTR. (E) srn identified within a CDS. (F) srn not detected.

