

Abstract
The lifecycle, and therefore the virulence, of single-stranded (ss)-RNA viruses is regulated not only by their particular protein gene products, but also by the secondary and tertiary structure of their genomes. The secondary structure of the entire genomic RNA of satellite tobacco mosaic virus (STMV) was recently determined by selective 2′-hydroxyl acylation analyzed by primer extension (SHAPE). The SHAPE analysis suggested a single highly extended secondary structure with much less branching than occurs in the ensemble of structures predicted by purely thermodynamic algorithms. Here we examine the solution-equilibrated STMV genome by direct visualization with cryo-electron microscopy (cryo-EM), using an RNA of similar length transcribed from the yeast genome as a control. The cryo-EM data reveal an ensemble of branching patterns that are collectively consistent with the SHAPE-derived secondary structure model. Thus, our results both elucidate the statistical nature of the secondary structure of large ss-RNAs and give visual support for modern RNA structure determination methods. Additionally, this work introduces cryo-EM as a means to distinguish between competing secondary structure models if the models differ significantly in terms of the number and/or length of branches. Furthermore, with the latest advances in cryo-EM technology, we suggest the possibility of developing methods that incorporate restraints from cryo-EM into the next generation of algorithms for the determination of RNA secondary and tertiary structures.
Keywords: secondary structure, viral RNA genome, cryo-electron microscopy
INTRODUCTION
A viral genome encodes the entire parasitic lifecycle of the virus at multiple levels. In addition to the primary sequence that directly codes for the viral proteins, single-stranded (ss)-RNA viruses exploit their secondary and tertiary structures to direct various events during infection. For example, specific secondary structure motifs within the viral genome have been implicated in packaging (Valegård et al. 1994; Qu and Morris 1997; Choi et al. 2002; Bunka et al. 2011), genome replication (Frolov et al. 2001; Lindenbach et al. 2002; Damgaard et al. 2004), the regulation of protein expression (Barends et al. 2003), protein folding (Watts et al. 2009), conformational switching (Stockley et al. 2007), and evading degradation by the host cell (Athavale et al. 2013).
However, relatively little is known about the large-scale—global—aspects of secondary and tertiary structures of these ss-RNA genomes. In part, this is because RNA is a flexible polymer that is unlikely to adopt a single unique 3D-structure at equilibrium. In addition, it has been hypothesized that large RNAs (of order 1000 nt) may assume an ensemble of secondary structures, each containing a different combination of intramolecular base-pairings between nucleotides in both local and distant regions of the primary sequence, resulting in very different branching patterns (Schroeder et al. 2011; Gopal et al. 2012; Wu et al. 2013). Moreover, the secondary structures may well contain kinetically trapped portions that are formed during replication. Furthermore, it is not known whether, or to what extent, the secondary structure is refolded upon packaging into the virus.
All of these factors preclude determination of the detailed global 3D-structure of the genomic RNA by the techniques traditionally used for high-resolution molecular structure studies that require a large number of identical structures—e.g., X-ray crystallography or cryo-electron microscopy (cryo-EM) single-particle reconstruction. At best, when these techniques are applied to the whole virions of small RNA viruses, they can reveal double-helical regions if those are organized with the same icosahedral symmetry as the capsid proteins. Such double helices have been seen in pariacoto virus (Tang et al. 2001), bacteriophage MS2 (Toropova et al. 2008), and satellite tobacco mosaic virus (STMV) (Larson et al. 1993, 1998).
The lack of direct structural data can be supplemented by RNA secondary structure predictions. Thermodynamic prediction algorithms (Zuker 1989; Hofacker et al. 1994; Wuchty et al. 1999; Markham and Zuker 2008; Reuter and Mathews 2010; Swenson et al. 2012; Bellaousov et al. 2013) are based on estimates of the free energies associated with the known structural motifs—helices, loops, bulges, and junctions—that are derived from melting studies on small model RNAs (Turner and Mathews 2010). When applied to the genomes of ss-RNA viruses, these algorithms predict a very large number of thermally accessible secondary structures, i.e., structures with energies on the order of thermal energy (kT) above the minimum free energy (MFE) structure (Yoffe et al. 2008).
A more recent refinement to RNA secondary structure prediction algorithms involves the incorporation of chemical probing data, which provide information on the extent to which individual nucleotides are restrained by base-pairing or other interactions (Low and Weeks 2010). When such data are used to supplement thermodynamic predictions on relatively short RNAs, significantly more reliable secondary structure maps can be produced (Deigan et al. 2009). The data can be used to generate an ensemble of structures (Schroeder et al. 2011), although they are commonly interpreted in terms of a single structure (Watts et al. 2009; Archer et al. 2013; Athavale et al. 2013; Wu et al. 2013).
We previously incorporated data from one such technique, selective 2′-hydroxyl acylation analyzed by primer extension (SHAPE) (Wilkinson et al. 2006), to suggest the most likely secondary structure of the STMV genomic RNA generated by in vitro transcription (Athavale et al. 2013). Our model was very different from the ensemble of models based on chemical probing in virio and the assumption that only short-range base pairs exist in the STMV genome in the mature virus (Schroeder et al. 2011). Figure 1A shows our SHAPE-directed secondary structure model. It is also significantly more extended than the ensemble of structures predicted by purely thermodynamic algorithms, a representative member of which, the minimum free energy (MFE) structure, is shown in Figure 1B. The SHAPE-restrained STMV secondary structure is also much more extended than the predicted secondary structure of a control RNA of comparable length (Fig. 1C). (For a description of the yeast RNA control, see Materials and Methods.) We noted that the highly extended central domain is reminiscent of viroid RNAs (Athavale et al. 2013). These are circularized, nonencapsidated, noncoding ssRNA molecules that infect plants. They are typically a few hundred nucleotides long, with extended secondary structures that have little or no branching (Wang et al. 2004; Xu et al. 2012). This structure is believed to provide viroid RNAs with resistance to RNA silencing-mediated degradation (Wang et al. 2004), and we proposed a similar role for the STMV secondary structure (Athavale et al. 2013), since this RNA can also infect plants in the absence of a capsid coat (Mirkov et al. 1990; Routh et al. 1995; Dodds 1998).
FIGURE 1.
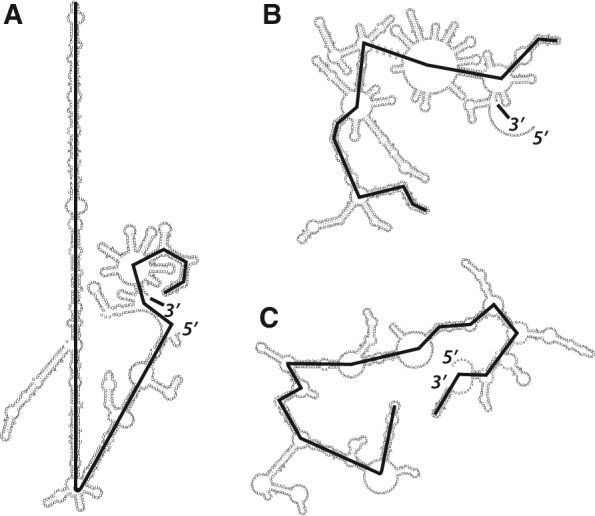
RNA secondary structure maps with heavy black lines identifying the path in each structure associated with the maximum ladder distance (MLD) (Yoffe et al. 2008). (A) SHAPE-directed secondary structure model for STMV RNA (Athavale et al. 2013); MLD = 205. (B) The MFE secondary structure of STMV RNA generated by purely thermodynamic analysis (Athavale et al. 2013); MLD = 100. (C) The MFE secondary structure of a yeast RNA of comparable length predicted by UNAFold (Zuker 1989; Markham and Zuker 2008), with MLD = 147. When a variety of algorithms are applied to the yeast control, the resulting secondary structures have MLDs that range from 98 to 155 (see text for Discussion).
The compactness/extendedness of individual secondary structures can be described by a metric, the maximum ladder distance (MLD), that was defined by Yoffe et al. (2008). The ladder distance associated with an arbitrary pair of bases (nucleotides) in a secondary structure had been introduced earlier by Bundschuh and Hwa (2002); it is defined as the minimum number of base pair “rungs” that must be crossed in reaching one base from the other in a traditional secondary structure diagram, where double helices resemble ladders. The MLD is the maximum value of all ladder distances defined in this way. Accordingly, it is the longest path across the secondary structure (see Fig. 1). For random-sequence RNAs it was found (Yoffe et al. 2008), using RNAstructure analyses (Reuter and Mathews 2010; Bellaousov et al. 2013), and later confirmed in an independent study (Fang et al. 2011a), that the relationship between the ensemble-averaged MLD (<MLD>) and the length of the RNA (the number of nucleotides, N) follows a simple power law:
The SHAPE-determined secondary structure model of STMV RNA (Fig. 1A) has an MLD of 205, which is 40% larger than that expected from Eq. (1), <MLD> = 146.
A subsequent study (Archer et al. 2013) used SHAPE-directed analysis to determine the secondary structure of STMV RNA that had been extracted from the wild-type virion, finding a structure very similar to the one we had reported: a compact, highly branched domain containing the 5′ and 3′ ends of the RNA, and a long central arm with minimal branching. It is interesting that the secondary structure of the central arm in the secondary structure for RNA extracted from the virus (Archer et al. 2013) is identical to that of the in vitro transcript shown in Figure 1A (Athavale et al. 2013).
The MLD of the STMV secondary structure in Figure 1A also lies well outside the range of MLDs predicted for the yeast control. For the latter, the MFE structure as predicted by Mfold (Zuker 1989; Markham and Zuker 2008) has an MLD of 153, while 29 suboptimal structures from Mfold gave MLDs ranging from 98 to 155. Twenty different predictions generated by RNAstructure (Reuter and Mathews 2010; Bellaousov et al. 2013) using Boltzmann sampling gave MLDs ranging from 120 to 140; the MFE structure has MLD = 127. The expected MLD for an ensemble of random sequences of the same length (975 nt) is 138, by Equation (1), near the middle of these predictions. By any measure, the SHAPE-restrained secondary structure of STMV RNA is unusually extended.
Archer et al. also probed the STMV genomic RNA inside the virus, finding only modest differences between the structure of the RNA in virio and the two ex virio structures. In addition, those same authors used atomic force microscopy (AFM) to visualize the ex virio RNA and found that the approximate lengths and number of branches were consistent with their SHAPE-directed secondary structure map. While AFM has been successful in elucidating various structural properties of viral RNA genomes (Day et al. 2001; Kuznetsov et al. 2005; Archer et al. 2013; Wu et al. 2013), inferring the equilibrium secondary structure of solvated RNA from AFM measurements is made difficult by poor lateral resolution and the fact that the sample RNA must be adsorbed onto the imaging surface before visualization. If the energy of interaction between the RNA and the imaging surface is comparable to the energy stabilizing the secondary structure motifs of the RNA, the observed conformations of the adsorbed RNA may not represent those realized in solution (Giro et al. 2004). Therefore, the observations made by AFM need to be corroborated by complementary measurements on RNA molecules free in solution.
Cryo-EM has emerged as a powerful technique for the direct imaging of solvated macromolecules in their native conformations (Frank 2009). Recent experiments by Gopal et al. (2012) demonstrated that cryo-EM is capable of resolving the large-scale features of long RNA molecules (thousands of nucleotides) and elucidating coarse-grained features of the ensemble of conformations they assume in solution. Specifically, they were able to determine the average 3D size and shape of long RNAs, and they showed that RNA2 from cowpea chlorotic mottle virus is more compact than expected for an RNA of that length, as previously predicted (Yoffe et al. 2008).
In the work presented here, we extend cryo-EM to the study of the secondary structure of a viral RNA. To do this, we record the 2D projections of individual RNA molecules in their native conformations in solution. We quantify the compactness of the observed branching patterns by converting the images to one-pixel-wide “skeletons” and using a standard algorithm to determine the number of branches, the length of each branch, and the number of three- and four-way junctions. (See “Image analysis” in Materials and Methods for details.)
We compare in vitro transcribed molecules of STMV RNA with a control RNA of comparable length. We find that while neither sequence adopts a single unique structure in solution, the ensemble of STMV RNA structures is significantly more extended than that of the yeast-genome-derived RNA. We are able to correlate the observed extendedness of STMV RNA with a lack of high-order junctions and an unusually long central arm motif within the predicted secondary structure map (Fig. 1A). We conclude that cryo-EM can be used to study the large-scale secondary structure features of long RNA molecules, and we suggest that data from cryo-EM could be incorporated into structure predictions on long RNA molecules.
Approach: studying 3D-branched objects by 2D projection imaging
Unfortunately, reconstructing a precise secondary structure map from cryo-EM micrographs is made difficult by fundamental limits in spatial resolution as well as the inability to resolve structural features that lie perpendicular to the imaging plane. Single-particle cryo-EM reconstruction and cryo-electron tomography are capable of resolving the high-resolution 3D-structure of certain biomolecules. At present, however, these techniques cannot be used to study large RNAs due to their structural heterogeneity and sensitivity to radiation damage. Rather, we are constrained to study the features of the secondary structures that reveal themselves within the observed ensemble of 2D-projected images.
Consider a simple branched, three-dimensional object. We define its total length (TL3D) as the sum of the contour lengths of all branches extended in 3D. Additionally, we define its maximum path length (MPL3D) as the length of the longest path between any two points within its 3D structure. We use the subscript “3D” to designate that these lengths correspond to distances measured in three-dimensional space. To illustrate these quantities we introduce Mel, the 3D stickman shown on the left side of Figure 2. Ignoring his neck and head, Mel's TL3D is 4.9 nm. He is not truly symmetric; his MPL3D runs from his left foot to his right hand (shown in black in Fig. 2) and is 2.8 nm long. Mel has two three-way junctions and, since his head and neck are excluded in the mock cryo-EM images that follow, he has no four-way junctions.
FIGURE 2.
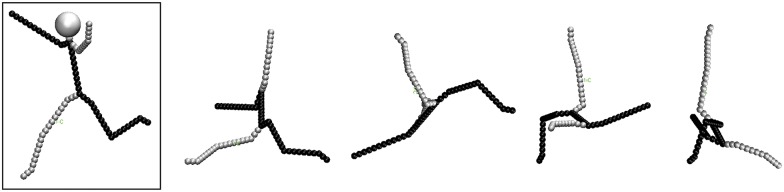
A 3D stickman, Mel, is boxed at left. Each of Mel's limbs, and his torso, are ∼1 nm in length (TL3D = 4.9 nm, excluding his head and neck). Mel's right arm is slightly longer than his left, and his left leg is a little longer than his right, so he has a unique maximum path length (MPL3D = 2.8 nm, shown in black). Four typical 2D projections of Mel in random orientations (excluding his head and neck) are shown.
Now consider the 2D projections of the same 3D branched object. We analogously define the total length (TL2D) and maximum path length (MPL2D) of a projection as the relevant distances measured in two-dimensional space: TL2D is the sum of the contour lengths of all branches in the 2D projection, and MPL2D is the longest path in the 2D projection. In Figure 2, a headless Mel tumbles in 3D space, and we have plotted four different 2D projections. We see that the TL2D of each projection depends on Mel's orientation in 3D; the TL2D is necessarily shorter than the TL3D, due to regions of the 3D structure that extend perpendicular to the plane of projection and are thus hidden from view. In addition, some projections hide branch points, and projections can create some apparent junctions that do not exist in the original object. Finally, we notice that the path associated with the MPL2D need not coincide with the MPL3D path (shown in black in Fig. 2), though the upper limit of the ensemble of MPL2D values can be used as a crude, though underestimated, approximation of MPL3D.
To examine how the 2D projections of 3D branched objects depend on the extent of branching, we compare the projected images of Mel to those of a second toy model with more branches. The second model, Bug, has the same total length in 3D (TL3D = 4.9 nm), but a significantly shorter maximum path length (MPL3D = 2.0 nm). Bug has six three-way junctions and two four-way junctions, and the arms off the longest path have lengths between 0.3 and 0.6 nm. For a detailed description of Mel and Bug, including coordinates, see Supplemental Material.
Figure 3A shows 64 randomly generated orientations of Mel, and the 2D skeletons of these images are shown in Figure 3B. (Since Fig. 3A is noise-free, the automatically derived skeletons in Fig. 3A,B should be identical.) Similarly, Figure 4A shows 64 randomly generated orientations of Bug, and Figure 4B shows the corresponding 2D skeletons. Note that the scales for Figures 3 and 4 are the same.
FIGURE 3.
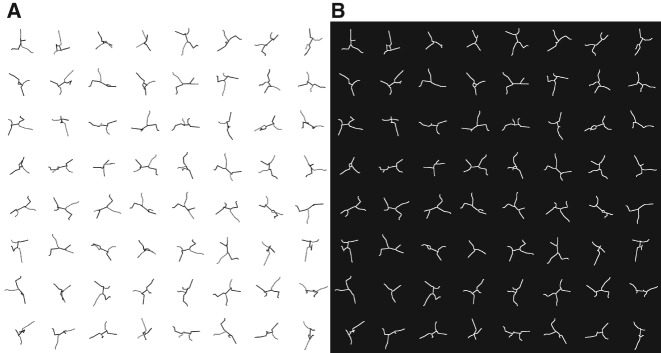
(A) Sixty-four randomly generated orientations of the 3D stickman, Mel (excluding his head and neck). The MPL3D is shown in black; it is 2.8 nm in length. (B) Each of the 64 orientations has been converted to a 2D-projected path skeleton using the algorithm described in Materials and Methods.
FIGURE 4.
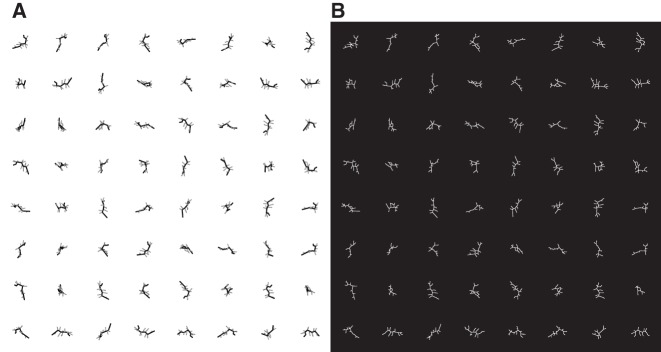
(A) Sixty-four randomly generated orientations of Bug, a branched object of the same total length as Mel (TL3D = 4.9 nm), but with significantly more branches. The MPL3D is shown in black, and measures 2.0 nm. (B) Each of the 64 orientations has been converted to a 2D-projected path skeleton. Scale is identical to that of Figure 3.
Figures 3B and 4B allow us to quantitatively demonstrate how increased 3D branching affects the 2D projections. Figure 5 compares a number of metrics for the projected images of Mel and Bug: the distribution of TL2D values, the number of apparent three- and four-way branch points (designated V3 and V4, respectively), the distribution of segment lengths, the longest segment length, and MPL2D. The differences in Figures 5B–E demonstrate that significant differences in the number and length of branches in Figures 3B and 4B can be detected by the characterization of 2D projections.
FIGURE 5.
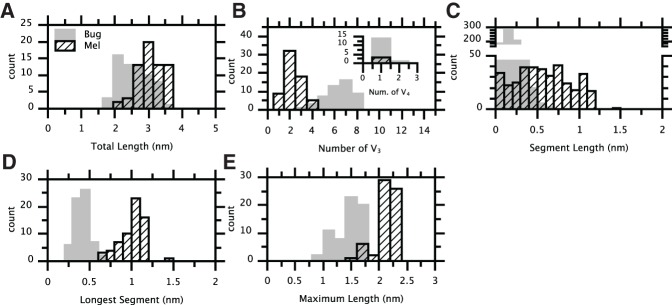
Analysis of the projections shown in Figures 3B and 4B. Values corresponding to Bug are plotted in gray, while those for Mel are plotted in hatched black. (A) The distributions of total length (TL2D). (B) The distributions of the number of apparent three-way branch points (V3) per skeleton; the inset shows the number of apparent four-way branch points (V4). (C) The distributions of segment lengths. Segments are defined as the paths spanning two neighboring branch points or a branch point and its neighboring endpoint. (D) The distributions of the length of each skeleton's longest segment. (E) Maximum projected length (MPL2D) distributions.
RESULTS
The secondary structure of the genomic RNA of STMV has been previously determined by two independent SHAPE analyses (Archer et al. 2013; Athavale et al. 2013), both of which find a structure very similar to that shown in Figure 1A. To verify the extendedness of the STMV genome, we compare cryo-EM images of the 1085-nt-long STMV RNA to those obtained from a comparable length (975-nt) control sequence from a nonprotein-coding region of chromosome XII of the yeast genome (Saccharomyces cerevisiae); we refer to this control molecule as “yeast RNA.” We choose yeast RNA as a reference structure with which to compare STMV RNA, because it is of roughly equal length and has a predicted secondary structure that closely resembles those of random sequence RNAs. As mentioned above, the yeast RNA has a predicted MLD of ∼100–150, depending on which prediction algorithm one uses. Thus, by comparing the cryo-EM-determined structure of STMV RNA to that of yeast RNA, we are effectively comparing STMV RNA to an equal-length random sequence.
One hundred twenty-one images of STMV RNA were obtained from 11 micrographs, along with 122 images of yeast RNA from 6 micrographs. Figure 6A shows a representative micrograph of STMV RNA. The branched and wispy images reflect double-helical segments connected by various kinds of junctions. The projected image of each molecule was converted to a one-pixel-wide skeleton (Fig. 6B) and the total length (TL2D) of each skeleton was measured. Only skeletons with TL2D values between 25 and 85 nm were analyzed (100 of each sequence). The lower bound for TL2D is rarely violated (Supplemental Material). This is consistent with native agarose gel electrophoresis assays, which were run immediately before the cryo-EM analyses. These revealed no evidence of small fragments, indicating that there is no significant RNA degradation. The small number of skeletons with TL2D <25 nm probably represent full-length RNAs, oriented with their long axes nearly perpendicular to the projection plane, making them unsuitable for further analysis. The upper bound was chosen by noting that ∼50%–65% of the nucleotides are paired in RNAs with compositions typical of viral genomes (Fang et al. 2011b). Taking 65% as the upper limit, an RNA with 1000 nt has a maximum of ∼325 bp. Using the rise of the A-form RNA double helix, 0.26 nm/bp, the maximum total base-paired length is 325 bp × 0.26 nm/bp ≈ 85 nm. Molecules with TL2D values above this value are probably aggregates, and they are also rare (Supplemental Material).
FIGURE 6.
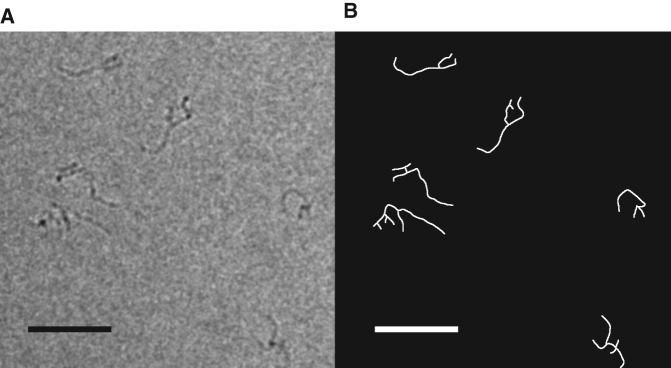
(A) Cryo-EM micrograph of STMV RNA. (B) The projected images were converted to skeletons in order to analyze the features of secondary structure. Scale bar represents 50 nm.
For each sequence we find a diverse ensemble of skeletons (Fig. 7), which we attribute to three main factors. First, RNA is flexible, so even molecules with identical branching will have different three-dimensional conformations at equilibrium. Second, 3D rotations of the imaged RNA act to shuffle the relative orientation of the branches as well as hide portions of the structure. Lastly, it is likely that the secondary structure varies at equilibrium. While flexibility and rotation alone may account for the structural differences between many pairs of skeletons (e.g., compare the yeast RNA skeleton found in row 1/column 6 of Figure 7 to that found in row 1/column 7), some pairs differ so dramatically in their branching that they suggest different secondary structures (e.g., compare the yeast RNA skeleton found in row 1/column 6 or 7 of Fig. 7 to that found in row 1/column 8). Examples of such strongly dissimilar pairs are present in both the viral and yeast RNA sequences and support the statistical—ensemble—interpretation of long ss-RNA secondary structures at equilibrium. Throughout the remainder of this study we focus on identifying the properties of the skeletons of Figure 7 that allow us to characterize the underlying ensembles of secondary structures.
FIGURE 7.
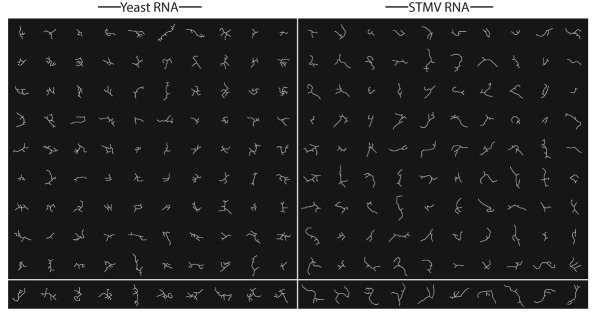
Two hundred skeletons of RNAs with TL2D values between 25 and 85 nm. The 100 skeletons on the left were obtained from micrographs of yeast RNA, and the 100 on the right from STMV RNA. The bottom row shows the 10 skeletons from each sequence with the highest accepted TL2D values, which are the most extended molecules in the plane of projection. To define a length scale, the skeletons have been positioned so that their centers form a simple square lattice, with 60 nm as the distance between the centers of each nearest-neighbor pair of skeletons.
The TL2D distributions for STMV RNA and yeast RNA overlap (Fig. 8A), with mean values of 59 ± 16 and 56 ± 15 nm (SD), respectively. Portions of the structure are obscured by projection, so the TL2D cannot be interpreted as the collective length of all branches within the secondary structure in three dimensions (TL3D). However, because the TL3D of long RNAs depends primarily on the fraction of base-pairing and less on the specific connectivity, the TL2D distributions from distinct populations of equal length RNAs should be roughly equivalent—irrespective of sequence or secondary structure—as long as the populations sample all possible spatial orientations with equal weight. The distributions of Figure 8A are consistent with this scenario.
FIGURE 8.
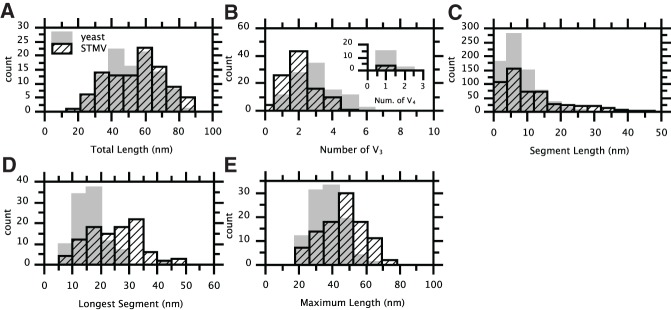
Analysis of the structures shown in Figure 7. Values corresponding to yeast RNA are plotted in gray; those for STMV are plotted in hatched black. (A) Distributions of total length (TL2D). (B) Distributions of the number of three-way branch points (V3) per skeleton; the inset shows the same for the number of four-way branch points (V4). (C) Distributions of segment lengths. (D) Distributions of the length of the longest segment of each skeleton. (E) Distributions of maximum projected length (MPL2D).
Analysis of the connectivity between segments of the skeletons of the two RNAs reveals average structural differences between them. On average, STMV contains only two three-way branch points (V3 vertices) per skeleton, while yeast RNA has three (Fig. 8B). Additionally, four-way branch points (V4 vertices) are less common in STMV RNA than in yeast RNA (Fig. 8B, inset). Limited spatial resolution and projection artifacts preclude the accurate determination of the true 3D-branching of each molecule, but the decreased number of vertices in the skeletons of STMV RNA relative to yeast RNA suggests a smaller number of junctions within the secondary structure (i.e., less branching). While the most common segment length for both RNAs is ∼6 nm, STMV RNA has a greater abundance of longer (>20 nm) segments (Fig. 8C). Plotting the distribution of the longest-segment length of each skeleton (Fig. 8D) shows that STMV RNA contains more longest-segment lengths over 20 nm than yeast RNA. In addition, the distribution of MPL2D values (Fig. 8E) also demonstrates the relative extendedness of STMV RNA compared with yeast RNA: Their mean MPL2D values are 46 ± 13 and 37 ± 9 nm (SD), respectively.
Lastly, we investigate the two subsets of 10 skeletons with the highest accepted TL2D values (i.e., the highest TL2D values <85 nm) for each sequence. We claim that these skeletons (Fig. 7, bottom row) most accurately represent the true secondary structures that are adopted in solution because the molecules were imaged in orientations that maximized the amount of resolvable structure (i.e., minimized the amount of hidden structure). Within this subset, we find good agreement with the previously reported vertex distributions of Figure 8B. Specifically, 20 three-way vertices and a single four-way vertex were found for STMV RNA, and 30 three-way vertices and six four-way vertices were found for yeast RNA.
The average TL2D values for these subsets of STMV RNA and yeast RNA are 82 ± 3 and 79 ± 3 nm (SD), respectively. These values—which should be the same for equal-length molecules—may reflect the slightly greater length of the STMV RNA (1058 nt) versus the yeast RNA control (975 nt). The average MPL2D values, on the other hand, are 63 ± 7 and 45 ± 7 nm (SD), respectively. These values are within the ranges of the physical length corresponding to the MLD of the SHAPE-derived STMV RNA secondary structure (51–71 nm, calculated from Fig. 1A, depending on whether or not one includes the approximate lengths of the unpaired regions), and that of the yeast RNA structure shown in Figure 1C (37–51 nm). (The physical length of the MLD of the non-SHAPE-constrained STMV RNA structure shown in Fig. 1B would be 25–35 nm.)
The data in Figure 8, A–E, all support the contention that STMV RNA is more extended than a control RNA of about the same length, thus supporting the SHAPE-restrained model (Fig. 1A). They also demonstrate that, even considering the inherent underestimation of 3D distances associated with 2D projection imaging, cryo-EM can distinguish the large-scale features of RNA secondary structure.
DISCUSSION
This work extends an earlier cryo-EM study on large ss-RNA molecules in solution (Gopal et al. 2012), demonstrating that the large-scale structural features of RNA can be observed by cryo-EM. The direct visualization of an in vitro transcript of genomic STMV RNA reveals an ensemble of highly extended secondary structures. Comparing the cryo-EM data to the STMV RNA models generated with and without SHAPE restraints (Fig. 1A,B, respectively) demonstrates that the SHAPE-derived model better represents the average features (i.e., the overall extendedness) of the conformations realized in solution. In particular, the relatively low degree of branching, the large MLD, and the viroid-like central arm were directly observed. Thus, our cryo-EM results support the strength of chemical probing techniques, at least those using the SHAPE technology (Watts et al. 2009; Archer et al. 2013; Athavale et al. 2013; Wu et al. 2013), as a method for determining the global secondary structure of viral RNAs.
At the same time, the variety of structures we observe with cryo-EM cautions against interpreting the SHAPE-derived secondary structure map as the only structure found in solution. While it is possible that we are observing different orientations of a single structure, we believe that the global architecture of the STMV genome is better described as a family of structures that, as a whole, closely resemble the SHAPE-derived model. This is consistent with previous cryo-EM evidence that a given sequence generates an ensemble of three-dimensional structures (Gopal et al. 2012). It is also consistent with a recent study in which the entire 4800 nt genome of the tomato bushy stunt virus was examined by SHAPE (Wu et al. 2013). The SHAPE analysis suggested a single secondary structure that contained only two of the six previously confirmed secondary structure motifs required for biological function. From this, the authors proposed that the global secondary structure acts as a basic scaffold for the dynamic development of distinct substructures. Our results are consistent with this scenario and may reflect a general strategy exploited by ss-RNA viruses. Schroeder et al. have previously emphasized that, when using experimental restraints to develop secondary structure models, there are generally many different models that will be consistent with those restraints (Schroeder et al. 2011). This represents an important direction for future research on RNA secondary structures.
STMV RNA is exceptionally extended, in contrast to the compactness predicted (Yoffe et al. 2008) and observed (Gopal et al. 2012, 2014) for the RNA genomes of other spherical viruses. Compactness facilitates packaging into the small volume of the capsid for some viruses (Yoffe et al. 2008; Cadena-Nava et al. 2012; Gopal et al. 2012; Garmann et al. 2014a,b), and compactness has also been suggested as a basis for protection against RNA interference and other innate intracellular responses. In particular it has been argued that compactness mediated by long-distance base-pairing helps establish the persistence of ssRNA viral infections (Simmonds et al. 2004; Davis et al. 2008). In contrast, STMV RNA uses an alternative strategy to avoid degradation by the host: Its highly extended structure is believed to provide resistance to degradation by RNA silencing (Athavale et al. 2013), in the same way that the long, rod-like structures of viroid RNAs resist silencing-mediated degradation (Wang et al. 2004). The cryo-EM visualizations reported here can be used to resolve such large-scale, whole-genome, issues of secondary-structure organization.
What is the origin of the highly extended secondary structure of STMV RNA? The composition is not particularly unusual (26.0% A, 21.5% C, 24.3% G, 28.2% U; G + C = 45.8%), and it does not differ remarkably from the composition of the yeast control (33.3% A, 18.1% C, 23.1% G, 25.5% U; G+C = 41.2%). In addition, we have previously shown (Athavale et al. 2013) that the SHAPE-restrained structure lies far outside the ensemble of secondary structures from thermodynamic predictions (P < 0.001) and the ensemble of secondary structures for shuffled sequences of the same composition (P < 0.004). Furthermore, the latter ensemble is not significantly different from the ensemble of predicted structures for random sequences of equimolar composition, [A] = [C] = [G] = [U] = 25%. Extendedness is therefore not due to composition; it is a consequence of the specific sequence of the STMV RNA.
Continual improvements in the detection hardware of electron microscopes (Faruqi and Henderson 2007) may soon allow for the 3D imaging of large RNAs by cryo-EM tomography. More sensitive detectors allow images to be acquired with less beam intensity and thus permit multiple exposures of the same RNA molecule, i.e., a tomographic tilt-series. These advancements will improve our ability to characterize the structure of viral RNAs by direct visualization.
Looking forward, it may be possible to incorporate cryo-EM-based measurements on branching as an additional experimental restraint within secondary structure prediction algorithms. Much as SHAPE has aided secondary structure prediction at the scale of single nucleotide base-pairing, cryo-EM can produce useful information about larger-scale secondary structure features such as the degree and nature of branching. The combination of these could allow the accurate determination of RNA secondary structures, including quantitative statements about the relative abundance of different structures and their conformational flexibilities.
MATERIALS AND METHODS
RNA synthesis and purification
Both RNAs were synthesized by in vitro transcription. After transcription and purification, RNA was equilibrated in low-ionic-strength buffer in order to facilitate visualization of the global structure by promoting electrostatic repulsions that keep branches from clumping together. STMV RNA was imaged in 5 mM Mg2+ to reflect the divalent cation concentration in vivo. We had previously shown that Mg2+ does not affect the SHAPE-restrained secondary structure of STMV RNA (Athavale et al. 2013), but it can induce tertiary interactions in other RNA molecules (Athavale et al. 2012), making them more compact when visualized by cryo-EM (Gopal et al. 2012). The yeast RNA was imaged in the absence of Mg2+ to minimize the possibility of such tertiary interactions; that is, we omitted Mg2+ from the yeast sample in an effort to make the control molecule as extended as possible. In spite of this, the STMV RNA is more extended than the yeast control by four different measures (Fig. 8B–E), confirming that STMV RNA has an anomalously extended secondary structure.
STMV RNA was prepared by in vitro transcription from an STMV DNA sequence within a pCR 2.1-TOPO plasmid, as previously described (Athavale et al. 2013), then lyophilized for storage. To rehydrate and refold the STMV RNA, the lyophilized sample was added to 50 mM HEPES, 50 mM sodium acetate (pH 8), heated to 90°C for 1 min, cooled on ice, then equilibrated at 37°C in the presence of 10 mM MgCl2 for 20 min. STMV RNA was then equilibrated at 4°C for 24 h. Directly before imaging, the sample was diluted twofold with dd-H2O to reduce the background noise caused by the buffer.
The 5′ end of the yeast RNA control corresponds to the 874,269th base of chromosome XII of S. cerevisiae (Cherry et al. 1997). Yeast RNA was generated by in vitro transcription and purified as previously described (Gopal et al. 2012), followed by equilibration in TE buffer at 4°C for 24 h before imaging.
Each RNA sample was assayed for degradation after transcription as well as directly before imaging by gel electrophoresis in a 1% native agarose gel run in TAE buffer. Small fragments are not seen, indicating that there is no significant degradation.
Cryo-EM
Both RNA molecules were imaged by conventional cryo-EM. Briefly, cryo-EM is performed by preparing thin films of RNA molecules in solution and rapidly cooling them to liquid nitrogen temperature. Rapid cooling vitrifies the solution and acts to lock in the structure of each tumbling, fluctuating RNA at the time of the quench. The process is so rapid that the water freezes to vitreous ice, which has the same density as liquid water; this prevents the formation of ice crystals that can disrupt the native structures of large RNAs, and that can hinder visualization in the electron microscope.
Cryo-EM experiments were performed as described by Gopal et al. (2012). Briefly, 3 µL of RNA solution was deposited on a Quantifoil holey carbon grid (200 mesh; R2/1) that had been previously glow-discharged. The grids were then blotted and flash-frozen by rapid plunging into liquid ethane cooled to liquid nitrogen temperature. Images of RNA molecules were recorded in transmission mode as 2D-projections. Micrographs were acquired using an FEI Tecnai G2 TF20 microscope operated at an accelerating voltage of 200 kV. Images were recorded at 3–4 microns underfocus with a TIETZ F415MP 4k × 4k pixel CCD camera. Total beam exposure was maintained between 20 and 40 e/Å2.
Image analysis
RNA images were converted to one-pixel-wide skeletons using the NeuronJ plugin (Meijering et al. 2004) within ImageJ (http://imagej.nih.gov/ij/) as previously described (Gopal et al. 2012). Skeletonization allows the automated determination of the total projected length, maximum projected length, length of each individual segment, and the frequency of three- and four-way junctions. Analysis was performed using the AnalyzeSkeleton plugin within ImageJ (Arganda-Carreras et al. 2010).
RNA secondary structure predictions
Secondary structures were predicted using three different algorithms, Mfold (Zuker 1989; Markham and Zuker 2008), UNAFold (Zuker 1989; Markham and Zuker 2008), and RNAstructure (Reuter and Mathews 2010; Bellaousov et al. 2013). MLDs for each structure were generated using a program developed by Aron Yoffe (Yoffe et al. 2008).
SUPPLEMENTAL MATERIAL
Supplemental material is available for this article.
Supplementary Material
ACKNOWLEDGMENTS
We are indebted to Loren Williams for critical discussions, and to Emily Norris for computational support. This work was supported by grant R01 GM70785 to S.C.H. from the National Institutes of Health. R.F.G. was supported by the US National Science Foundation, in the form of grant CHE 1051507 to W.M.G. and C.M.K. Additional funding for R.F.G. was provided by a University of California, Los Angeles Dissertation-Year Fellowship. TEM images were obtained in the California NanoSystems Institute (CNSI) Electron Imaging Center for Nano-Machines, supported by NIH (1S10RR23057).
Footnotes
Article published online ahead of print. Article and publication date are at http://www.rnajournal.org/cgi/doi/10.1261/rna.047506.114.
REFERENCES
- Archer EJ, Simpson MA, Watts NJ, O'Kane R, Wang B, Erie DA, McPherson A, Weeks KM 2013. Long-range architecture in a viral RNA genome. Biochemistry 52: 3182–3190. [DOI] [PMC free article] [PubMed] [Google Scholar]
- Arganda-Carreras I, Fernández-González R, Muñoz-Barrutia A, Ortiz-De-Solorzano C 2010. 3D reconstruction of histological sections: application to mammary gland tissue. Microsc Res Tech 73: 1019–1029. [DOI] [PubMed] [Google Scholar]
- Athavale SS, Gossett JJ, Hsiao C, Bowman JC, O'Neill E, Hershkovitz E, Preeprem T, Hud NV, Wartell RM, Harvey SC, et al. 2012. Domain III of the T. thermophilus 23S rRNA folds independently to a near-native state. RNA 18: 752–758. [DOI] [PMC free article] [PubMed] [Google Scholar]
- Athavale SS, Gossett JJ, Bowman JC, Hud NV, Williams LD, Harvey SC 2013. In vitro secondary structure of the genomic RNA of satellite tobacco mosaic virus. PLoS One 8: e54384. [DOI] [PMC free article] [PubMed] [Google Scholar]
- Barends S, Bink H, van den Worm SH, Pleij CW, Kraal B 2003. Entrapping ribosomes for viral translation: tRNA mimicry as a molecular Trojan horse. Cell 112: 123–129. [DOI] [PubMed] [Google Scholar]
- Bellaousov S, Reuter JS, Seetin MG, Mathews DH 2013. RNAstructure: web servers for RNA secondary structure prediction and analysis. Nucleic Acids Res 41: W471–W474. [DOI] [PMC free article] [PubMed] [Google Scholar]
- Bundschuh R, Hwa T 2002. Statistical mechanics of secondary structures formed by random RNA sequences. Phys Rev E Stat Nonlin Soft Matter Phys 65: 031903. [DOI] [PubMed] [Google Scholar]
- Bunka DH, Lane SW, Lane CL, Dykeman EC, Ford RJ, Barker AM, Twarock R, Phillips SE, Stockley PG 2011. Degenerate RNA packaging signals in the genome of Satellite Tobacco Necrosis Virus: implications for the assembly of a T=1 capsid. J Mol Biol 413: 51–65. [DOI] [PubMed] [Google Scholar]
- Cadena-Nava RD, Comas-Garcia M, Garmann RF, Rao AL, Knobler CM, Gelbart WM 2012. Self-assembly of viral capsid protein and RNA molecules of different sizes: requirement for a specific high protein/RNA mass ratio. J Virol 86: 3318–3326. [DOI] [PMC free article] [PubMed] [Google Scholar]
- Cherry JM, Ball C, Weng S, Juvik G, Schmidt R, Adler C, Dunn B, Dwight S, Riles L, Mortimer RK, et al. 1997. Genetic and physical maps of Saccharomyces cerevisiae. Nature 387: 67–73. [PMC free article] [PubMed] [Google Scholar]
- Choi YG, Dreher TW, Rao AL 2002. tRNA elements mediate the assembly of an icosahedral RNA virus. Proc Natl Acad Sci 99: 655–660. [DOI] [PMC free article] [PubMed] [Google Scholar]
- Damgaard CK, Andersen ES, Knudsen B, Gorodkin J, Kjems J 2004. RNA interactions in the 5′ region of the HIV-1 genome. J Mol Biol 336: 369–379. [DOI] [PubMed] [Google Scholar]
- Davis M, Sagan S, Pezacki J, Evans D, Simmonds P 2008. Bioinformatic and physical characterizations of genome-scale ordered RNA structure in mammalian RNA viruses. J Virol 82: 11824–11836. [DOI] [PMC free article] [PubMed] [Google Scholar]
- Day J, Kuznetsov YG, Larson SB, Greenwood A, McPherson A 2001. Biophysical studies on the RNA cores of satellite tobacco mosaic virus. Biophysic J 80: 2364–2371. [DOI] [PMC free article] [PubMed] [Google Scholar]
- Deigan KE, Li TW, Mathews DH, Weeks KM 2009. Accurate SHAPE-directed RNA structure determination. Proc Natl Acad Sci 106: 97–102. [DOI] [PMC free article] [PubMed] [Google Scholar]
- Dodds JA 1998. Satellite tobacco mosaic virus. Annu Rev Phytopathol 36: 295–310. [DOI] [PubMed] [Google Scholar]
- Fang LT, Gelbart WM, Ben-Shaul A 2011a. The size of RNA as an ideal branched polymer. J Chem Phys 135: 155105. [DOI] [PubMed] [Google Scholar]
- Fang LT, Yoffe AM, Gelbart WM, Ben-Shaul A 2011b. A sequential folding model predicts length-independent secondary structure properties of long ssRNA. J Phys Chem B 115: 3193–3199. [DOI] [PubMed] [Google Scholar]
- Faruqi AR, Henderson R 2007. Electronic detectors for electron microscopy. Curr Opin Struct Biol 17: 549–555. [DOI] [PubMed] [Google Scholar]
- Frank J 2009. Single-particle reconstruction of biological macromolecules in electron microscopy—30 years. Q Rev Biophys 42: 139–158. [DOI] [PMC free article] [PubMed] [Google Scholar]
- Frolov I, Hardy R, Rice C 2001. Cis-acting RNA elements at the 5′ end of Sindbis virus genome RNA regulate minus- and plus-strand RNA synthesis. RNA 7: 1638–1651. [DOI] [PMC free article] [PubMed] [Google Scholar]
- Garmann RF, Comas-Garcia M, Gopal A, Knobler CM, Gelbart WM 2014a. The assembly pathway of an icosahedral single-stranded RNA virus depends on the strength of inter-subunit attractions. J Mol Biol 426: 1050–1060. [DOI] [PMC free article] [PubMed] [Google Scholar]
- Garmann RF, Comas-Garcia M, Koay MS, Cornelissen JJ, Knobler CM, Gelbart WM 2014b. Role of electrostatics in the assembly pathway of a single-stranded RNA virus. J Virol 88: 10472–10479. [DOI] [PMC free article] [PubMed] [Google Scholar]
- Giro A, Bergia A, Zuccheri G, Bink HH, Pleij CW, Samorì B 2004. Single molecule studies of RNA secondary structure: AFM of TYMV viral RNA. Microsc Res Tech 65: 235–245. [DOI] [PubMed] [Google Scholar]
- Gopal A, Zhou ZH, Knobler CM, Gelbart WM 2012. Visualizing large RNA molecules in solution. RNA 18: 284–299. [DOI] [PMC free article] [PubMed] [Google Scholar]
- Gopal A, Egecioglu DE, Yoffe AM, Ben-Shaul A, Rao AL, Knobler CM, Gelbart WM 2014. Viral RNAs are unusually compact. PLoS One 9: e105875. [DOI] [PMC free article] [PubMed] [Google Scholar]
- Hofacker IL, Fontana W, Stadler PF, Bonhoeffer S, Tacker M, Schuster P 1994. Fast folding and comparison of RNA secondary structures. Monatsch Chem 125: 167–188. [Google Scholar]
- Kuznetsov Y, Daijogo S, Zhou J, Semler BL, McPherson A 2005. Atomic force microscopy analysis of icosahedral virus RNA. J Mol Biol 347: 41–52. [DOI] [PubMed] [Google Scholar]
- Larson SB, Koszelak S, Day J, Greenwood A, Dodds JA, McPherson A 1993. Double-helical RNA in satellite tobacco mosaic virus. Nature 361: 179–182. [DOI] [PubMed] [Google Scholar]
- Larson SB, Day J, Greenwood A, McPherson A 1998. Refined structure of satellite tobacco mosaic virus at 1.8 Å resolution. J Mol Biol 277: 37–59. [DOI] [PubMed] [Google Scholar]
- Lindenbach BD, Sgro JY, Ahlquist P 2002. Long-distance base pairing in flock house virus RNA1 regulates subgenomic RNA3 synthesis and RNA2 replication. J Virol 76: 3905–3919. [DOI] [PMC free article] [PubMed] [Google Scholar]
- Low JT, Weeks KM 2010. SHAPE-directed RNA secondary structure prediction. Methods 52: 150–158. [DOI] [PMC free article] [PubMed] [Google Scholar]
- Markham NR, Zuker M 2008. UNAFold: software for nucleic acid folding and hybridization. Methods Mol Biol 453: 3–31. [DOI] [PubMed] [Google Scholar]
- Meijering E, Jacob M, Sarria JC, Steiner P, Hirling H, Unser M 2004. Design and validation of a tool for neurite tracing and analysis in fluorescence microscopy images. Cytometry A 58: 167–176. [DOI] [PubMed] [Google Scholar]
- Mirkov TE, Kurath G, Mathews DM, Elliott K, Dodds JA, Fitzmaurice L 1990. Factors affecting efficient infection of tobacco with in vitro RNA transcripts from cloned cDNAs of satellite tobacco mosaic virus. Virology 179: 395–402. [DOI] [PubMed] [Google Scholar]
- Qu F, Morris TJ 1997. Encapsidation of turnip crinkle virus is defined by a specific packaging signal and RNA size. J Virol 71: 1428–1435. [DOI] [PMC free article] [PubMed] [Google Scholar]
- Reuter JS, Mathews DH 2010. RNAstructure: software for RNA secondary structure prediction and analysis. BMC Bioinformatics 11: 129. [DOI] [PMC free article] [PubMed] [Google Scholar]
- Routh G, Dodds JA, Fitzmaurice L, Mirkov TE 1995. Characterization of deletion and frameshift mutants of satellite tobacco mosaic virus. Virology 212: 121–127. [DOI] [PubMed] [Google Scholar]
- Schroeder SJ, Stone JW, Bleckley S, Gibbons T, Mathews DM 2011. Ensemble of secondary structures for encapsidated satellite tobacco mosaic virus RNA consistent with chemical probing and crystallography constraints. Biophys J 101: 167–175. [DOI] [PMC free article] [PubMed] [Google Scholar]
- Simmonds P, Tuplin A, Evans D 2004. Detection of genome-scale ordered RNA structure (GORS) in genomes of positive-stranded RNA viruses: implications for virus evolution and host persistence. RNA 10: 1337–1351. [DOI] [PMC free article] [PubMed] [Google Scholar]
- Stockley PG, Rolfsson O, Thompson GS, Basnak G, Francese S, Stonehouse NJ, Homans SW, Ashcroft AE 2007. A simple, RNA-mediated allosteric switch controls the pathway to formation of a T=3 viral capsid. J Mol Biol 369: 541–552. [DOI] [PMC free article] [PubMed] [Google Scholar]
- Swenson MS, Anderson J, Ash A, Gaurav P, Sükösd Z, Bader DA, Harvey SC, Heitsch CE 2012. GTfold: enabling parallel RNA secondary structure prediction on multi-core desktops. BMC Res Notes 5: 341. [DOI] [PMC free article] [PubMed] [Google Scholar]
- Tang L, Johnson KN, Ball LA, Lin T, Yeager M, Johnson JE 2001. The structure of Pariacoto virus reveals a dodecahedral cage of duplex RNA. Nat Struct Biol 8: 77–83. [DOI] [PubMed] [Google Scholar]
- Toropova K, Basnak G, Twarock R, Stockley PG, Ranson NA 2008. The three-dimensional structure of genomic RNA in bacteriophage MS2: implications for assembly. J Mol Biol 375: 824–836. [DOI] [PubMed] [Google Scholar]
- Turner DH, Mathews DH 2010. NNDB: the nearest neighbor parameter database for predicting stability of nucleic acid secondary structure. Nucleic Acids Res 38: D280–D282. [DOI] [PMC free article] [PubMed] [Google Scholar]
- Valegård K, Murray JB, Stockley PG, Stonehouse NJ, Liljas L 1994. Crystal structure of an RNA bacteriophage coat protein–operator complex. Nature 371: 623–626. [DOI] [PubMed] [Google Scholar]
- Wang MB, Bian XY, Wu LM, Liu LX, Smith NA, Isenegger D, Wu RM, Masuta C, Vance VB, Watson JM, et al. 2004. On the role of RNA silencing in the pathogenicity and evolution of viroids and viral satellites. Proc Natl Acad Sci 101: 3275–3280. [DOI] [PMC free article] [PubMed] [Google Scholar]
- Watts JM, Dang KK, Gorelick RJ, Leonard CW, Bess JW Jr, Swanstrom R, Burch CL, Weeks KM 2009. Architecture and secondary structure of an entire HIV-1 RNA genome. Nature 460: 711–716. [DOI] [PMC free article] [PubMed] [Google Scholar]
- Wilkinson KA, Merino EJ, Weeks KM 2006. Selective 2′-hydroxyl acylation analyzed by primer extension (SHAPE): quantitative RNA structure analysis at single nucleotide resolution. Nat Protoc 1: 1610–1616. [DOI] [PubMed] [Google Scholar]
- Wu B, Grigull J, Ore MO, Morin S, White KA 2013. Global organization of a positive-strand RNA virus genome. PLoS Pathog 9: e1003363. [DOI] [PMC free article] [PubMed] [Google Scholar]
- Wuchty S, Fontana W, Hofacker IL, Schuser P 1999. Complete suboptimal folding of RNA and the stability of secondary structures. Biopolymers 49: 145–165. [DOI] [PubMed] [Google Scholar]
- Xu W, Bolduc F, Hong N, Perreault JP 2012. The use of a combination of computer-assisted structure prediction and SHAPE probing to elucidate the secondary structures of five viroids. Mol Plant Pathol 13: 666–676. [DOI] [PMC free article] [PubMed] [Google Scholar]
- Yoffe AM, Prinsen P, Gopal A, Knobler CM, Gelbart WM, Ben-Shaul A 2008. Predicting the sizes of large RNA molecules. Proc Natl Acad Sci 105: 16153–16158. [DOI] [PMC free article] [PubMed] [Google Scholar]
- Zuker M 1989. On finding all suboptimal foldings of an RNA molecule. Science 244: 48–52. [DOI] [PubMed] [Google Scholar]
Associated Data
This section collects any data citations, data availability statements, or supplementary materials included in this article.