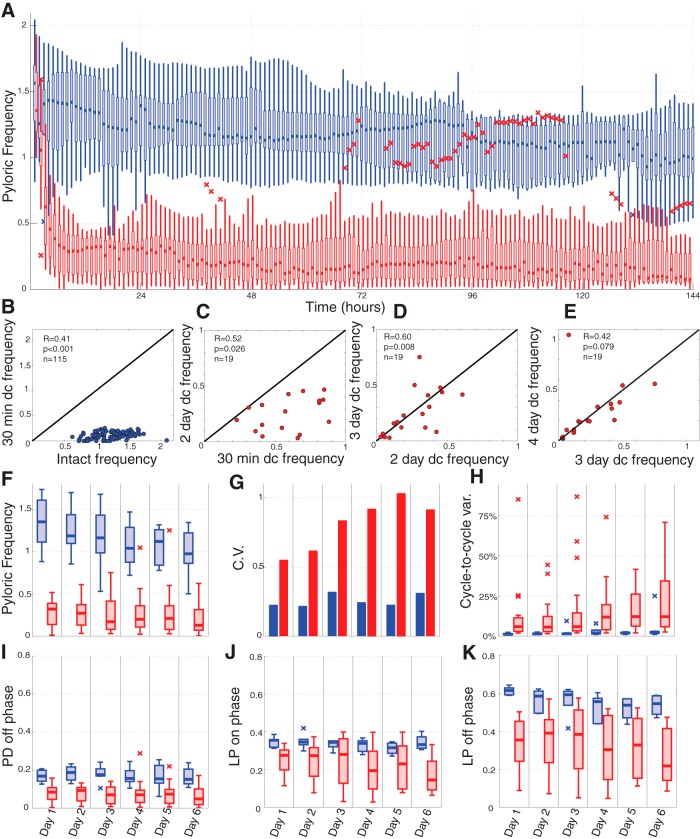
Figure 4.
Long-term population effects of decentralization on the pyloric rhythm. A, Population data for intact (n = 9) and decentralized (n = 19) preparations is shown for the first 6 d in culture. Data are plotted as box plots (see Materials and Methods) for each hour; data from intact preparations are shown in blue while decentralized preparations are shown in red. B−E, Cycle frequency correlations within preparations across time (dc, decentralized). Black diagonal line represents unity. Insets report R and p values of Pearson correlations. B, Following decentralization, all preparations exhibit a lower pyloric cycle frequency. C, All examined preparations also exhibit a lower frequency on the second day following decentralization (average frequency, 24−48 h). D, E, On subsequent days, preparations are more correlated, and show an equal tendency to increase or decrease frequency. F−K, Measures of frequency (F), across-preparation variability (coefficient of variation (C.V.), G), within-preparation variability (H), and pyloric phase relationships (I−K) are plotted for intact (blue) and decentralized (red) preparations. Box plots are created from population data consisting of the average value for each preparation in 24 h bins following decentralization.

