Abstract
Scope
This study evaluated the capacity of dietary catechin (C), quercetin (Q) and the combination of both (CQ), to attenuate adipose inflammation triggered by high fructose (HFr) consumption in rats and by tumor necrosis factor alpha (TNFα) in 3T3-L1 adipocytes.
Methods and results
In rats, HFr consumption for 6 wk caused dyslipidemia, insulin resistance, reduced plasma adiponectin, adiposity, and adipose tissue inflammation. Dietary supplementation with 20 mg/kg/d of C, Q and CQ improved all these parameters. In 3T3-L1 adipocytes, C and Q attenuated TNFα-induced elevated protein carbonyls, increased pro-inflammatory cytokine expression (MCP-1, resistin), and decreased adiponectin. The protective effects of C and Q on adipose inflammation are in part associated with their capacity to: i) decrease the activation of the mitogen activated kinases (MAPKs) JNK and p38; and ii) prevent the downregulation of PPARγ. In summary, C and Q, and to a larger extent the combination of both, attenuated adipose pro-inflammatory signaling cascades and regulated the balance of molecules that improve (adiponectin) or impair (TNFα, MCP-1, resistin) insulin sensitivity.
Conclusion
Together, these findings suggest that dietary Q and C may have potential benefits in mitigating MetS associated adipose inflammation, oxidative stress, and insulin resistance.
Keywords: Adipokines, Adipose tissue inflammation, Flavonoids, High fructose-diet, Metabolic Syndrome
INTRODUCTION
The metabolic syndrome (MetS) is a complex of interrelated metabolic abnormalities including hyperglycemia, dyslipidemia and hypertension, and constitutes a significant risk factor for insulin resistance, type 2 diabetes (T2D) and cardiovascular disease [1–3]. Fructose consumption has been shown to decrease insulin sensitivity, promote dyslipidemia, oxidative stress, and inflammation in rodent models of MetS and in humans [4–7]. Moreover, fructose consumption is proposed to contribute to increased visceral adiposity [8–10].
Increased visceral adiposity promotes adipose tissue dysfunction and plays a significant role in the development of MetS. In this regard, adiposity causes an increase in adipose tissue pro-inflammatory cytokines such as tumor necrosis factor alpha (TNFα), monocyte chemoattractant protein 1 (MCP-1), resistin, interleukin 6, among others and decrease release of the insulin sensitizing hormone adiponectin [11]. TNFα is a major activator of inflammatory signaling cascades in adipose tissue, including the mitogen-activated protein kinases (MAPKs) p38 and c-jun N-terminal kinase (JNK), and downstream of transcription factor activator protein-1 (AP-1). Activation of these pathways leads to the transcription of pro-inflammatory cytokines which contribute to a cycle of chronic inflammation [12]. Furthermore, JNK downregulates the nuclear receptor peroxisome proliferator-activated receptor γ (PPARγ), a major regulator of glucose and lipid metabolism in adipocytes [13]. Taken together, the events associated with adiposity contribute to inflammation in MetS and impairment of insulin signaling.
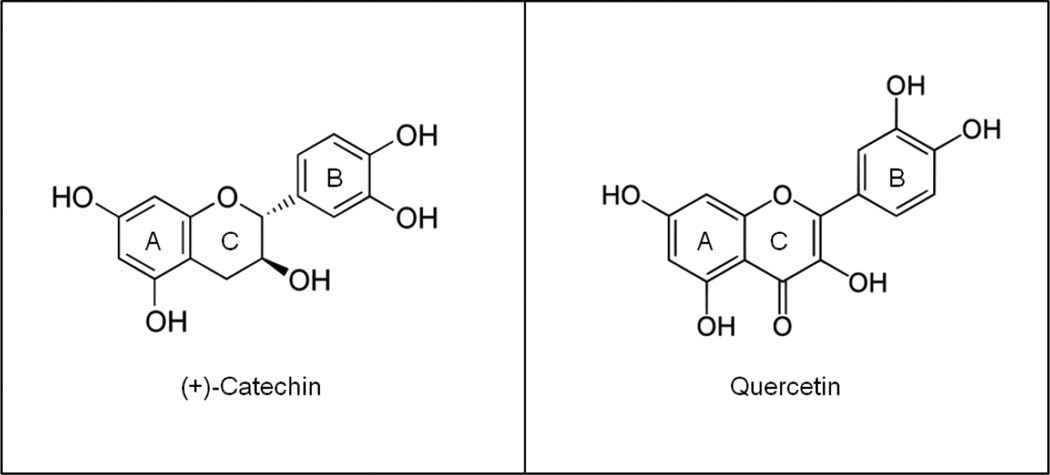
Recent studies have shown the potential benefits of consumption of flavonoids or flavonoids-rich foods or beverages in attenuating adipose inflammation and insulin resistance in experimental models of MetS [14, 15]. Catechin (C) and quercetin (Q) are among the major flavonoids in plant foods, including beverages such as tea, red wine, and cocoa. Flavonoids have a common structure that consists of 2 aromatic rings (A and B) linked by a 3-carbon chain usually organized as an oxygenated heterocyclic ring (C ring) [16, 17]. Catechin belongs to the flavan family characterized by two benzene rings and a dihydropyran heterocycle with a hydroxyl group on carbon 3 (Fig. 1). On the other hand, quercetin is a flavonol characterized by (3,3ʹ,4ʹ,5,7-pentahydroxyflavone (Fig. 1). Quercetin (0.1% w/w in diet) has been shown to reduce inflammatory cardiovascular risk factors in transgenic models of cardiovascular disease [18]. On the other hand, consumption of daily green tea containing 582.8 mg of catechins for 12 wk decreases waist circumference and visceral adiposity in T2D patients [19]. In addition, both in vivo [20] and in vitro [21], the C isomer (−)-epicatechin, inhibits adipose inflammation and mitigates insulin resistance in high fructose-induced MetS in rats and in 3T3-L1 adipocytes treated with TNFα. Furthermore, we previously observed increased adipose tissue inflammation in high fructose-fed rats which was mitigated by chronic administration of red wine, may be attributed in part to its polyphenols content [15]. Importantly, food normally contains a variety of flavonoids that may act synergistically in the prevention of adipose tissue inflammation and insulin resistance. We hypothesized, that supplementation with C and Q and in particular both compounds could attenuate adipose inflammation in high-fructose diet induced MetS. Thus, this study investigated the effect of dietary C and Q, two abundant flavonoids in fruits and vegetables, and the potential synergistic action of both flavonoids to mitigate MetS-associated adipose tissue inflammation. We assessed if dietary chronic supplementation with C, Q and the combination of both flavonoids, could prevent adipose tissue inflammation and impaired insulin sensitivity associated with chronic high fructose-feeding in rats. The underlying protective action of C and Q were investigated in vitro using 3T3-L1 adipocytes.
Figure 1. Chemical structure of C and Q.
MATERIALS AND METHODS
Materials
Fructose was purchased from Saporiti Labs., Buenos Aires, Argentina. 3T3-L1 cells were obtained from the American Type Culture Collection (Rockville, MA, USA). Cell culture media and reagents were obtained from Invitrogen Life Technologies (Carlsbad, CA, USA). Antibodies for heterogeneous nuclear ribonucleoprotein A1 (sc-32301), JNK (sc-572), p-JNK (sc-6254), PPARγ (sc-7273), MCP-1 (sc-1785), TNFα (sc-1351), visfatin (sc-46439), β-tubulin (sc-5274); and the oligonucleotide containing the consensus sequence for PPAR were from Santa Cruz Biotechnology (Santa Cruz, CA, USA). The antibody for adiponectin (ADI-905-714-100) was obtained from Stressgen (Farmingdale, NY, USA); p-p38 (9211) was obtained from Cell Signaling Technology (Danvers, MA, USA), and resistin (AB 3371P) was from Millipore (Billerica, MA, USA). PVDF membranes were obtained from BIO-RAD (Hercules, CA, USA) and Chroma Spin-10 columns were from Clontech (Palo Alto, CA, USA). The ECL Western blotting system was from Pierce (Thermo Scientific, Rocford, IL, USA). The oligonucleotides containing the consensus sequence for AP-1 and the reagents for the electrophoretic mobility shift assays (EMSA) were from Promega (Madison, WI, USA). Quercetin, (+)-catechin, TNFα, β-actin, and all other reagents were from the highest quality available and were purchased from Sigma (St. Louis, MO, USA).
Animal studies
All animals studies were conducted in accordance with the Guiding Principles in the Care and Use of Animals of the US National Institute of Health. All procedures were approved by the Institutional Animal Care and Use Committee of the School of Medical Science, University of Cuyo (Protocol approval N° 36/2014). Thirty-day-old male Wistar rats, weighing 100–130 g were housed during the experimental period of 6 wk under conditions of controlled temperature (21–25°C) and humidity with a 12 hour light/dark cycle.
Rats were randomly assigned to the following 5 groups (6 rats per group): a control group (Ctrl), a HFr group that received 10% (w/v) fructose solution in drinking water, and three groups in which HFr rats received diets supplemented with either (+)-catechin (C), quercetin (Q) or both catechin and quercetin (CQ) in doses of 20 mg/kg body weight of each. Flavonoids were added to standard chow, which was prepared three times a week adjusting flavonoids amount according to the weight of the animals. All groups were fed the same standard chow rat diet (Gepsa-Feeds, Buenos Aires, Argentina) and water ad libitum. The dose of flavonoids was chosen based on previous studies in experimental models of MetS [14, 20, 22].
Food intake and liquid consumption were recorded twice per week. After 6 wk of dietary interventions, and after an overnight fast, rats were weighed and anesthetized with ketamine (50 mg/kg) and acepromazine (1 mg/kg). Blood was collected from the abdominal aorta into heparinized tubes. Plasma was obtained after centrifugation at 1,000 × g for 15 min at 4°C. Epididymal adipose tissue was collected, weighed, and stored frozen at −80°C until assayed.
Biochemical determinations
Plasma glucose and triglyceride concentrations were determined by enzymatic colorimetric methods using commercial kits (GTLab, Buenos Aires, Argentina). Insulin was measured by RIA (Coat-A-Count, Siemens, CA, USA) and insulin resistance was assessed using the homeostasis model assessment (HOMA-IR) parameter originally described by Mathew et al. [23]. HOMA-IR was calculated using the following formula: HOMA-IR (mmol/L × µU/ml) = fasting glucose (mmol/L) × fasting insulin (µU/ml) / 22.5.
Plasma thiobarbituric acid reactive substances (TBARS) were determined as previously described [15]. This method is based on the reaction between malondialdehyde, a product of lipid oxidation, and thiobarbituric acid. ELISA kits against rat and mouse adiponectin (Millipore) were used to determine rat plasma and 3T3-L1 secreted adiponectin levels according to manufacturer’s protocol.
Cell culture and treatments
3T3-L1 preadipocytes were differentiated as previously described [21]. Briefly, cells were maintained in DMEM containing 25 mM glucose, 10% (v/v) fetal bovine serum, 50 U/ml penicillin, and 50 µg/ml streptomycin. Confluent cells were then switched to differentiation medium containing 20% (v/v) fetal bovine serum, 20 nM insulin and 1 nM triiodothyronine for 48 h. Adipocyte differentiation was induced by treating cells for 48 h in differentiation medium supplemented with 0.5 µM dexamethasone, 0.5 mM isobutylmethylxanthine, and 0.125 mM indomethacin. Then, cells were returned to differentiation medium, exhibiting at day 12 a fully differentiated phenotype with massive accumulation of fat droplets. 3T3-L1 adipocytes were treated with 1 and 10 µM catechin, quercetin or both during 4 h, and subsequently treated with TNFα (20 ng/ml) for 15 min-24 h depending on the experiment.
Western blots
Epididymal adipose tissue and cell homogenates were prepared as previously described [15, 21] and protein concentration was measured using the Bradford method [24]. Aliquots of rat and cell homogenates containing 25–40 µg protein were denatured with Laemmli buffer, separated by reducing 10–12.5% (w/v) polyacrylamide gel electrophoresis, and electroblotted to PVDF membranes. Membranes were blotted for 2 h in 5% (w/v) non-fat milk, and subsequently incubated in the presence of the corresponding primary antibodies (1:1,000 dilution for all the antibodies except for TNFα (1:500)) overnight at 4°C. After incubation for 90 min at room temperature in the presence of the secondary antibody (HRP conjugated) (1:10,000 dilution), the conjugates were visualized and quantified by chemiluminescence detection. Densitometry analysis was performed using the US National Institute of Health Image 1.66 software (Rasband Wayner et al. Division of Computer Research and Technology NIH, Bethesda, Maryland, USA).
Protein carbonyl content
Protein carbonyls were determined as previously described [25] with modifications. Briefly, cell lysates were mixed with 12% SDS, derivatized by addition of 20 mM 2,4-dinitrophenylhydrazine (DNP) in 10% (w/v) trifluoroacetic acid. After pH neutralization, proteins were resolved using 4–15% Mini-PROTEAN® TGX™ Gel (BioRad), and then transferred to PVDF membranes. Immunoblotting of carbonyl groups was performed using an anti-DNP antibodies (Sigma). A duplicate membrane was immunoblotted to measure β-tubulin content to control for loading.
RNA isolation and real-time PCR
RNA was extracted from cells using TRIzol reagent (Invitrogen). cDNA was generated using high-capacity cDNA reverse transcriptase and the results were normalized to TATA-Box binding protein (TBP) as previously described [20]. The following primers were used: adiponectin primers, GTTGCAAGCTCTCCTGTTCC (forward), TCTCCAGGAGTGCCATCTCT (reverse); visfatin primers, CTGTGTCTGTGGTCAGCGAT (forward), ACATAACAACCCGGCCACAT (reverse); MCP-1 primers GCCCCACTCACCTGCTGCTACT (forward), CCTGCTGCTGGTGATCCTCTTGT (reverse); resistin primers CAGAAGGCACAGCAGTCTTG (forward), GACCGGAGGACATCAGACAT (reverse); TBP primers, CAGCCTTCCACCTTATGCTC (forward), TGCTGCTGTCTTTGTTGCTC (reverse).
Electrophoretic mobility shift assay (EMSA)
Nuclear fractions were isolated as previously described [21]. For the EMSA, the oligonucleotides containing the consensus sequences for AP-1 and PPARγ were end-labelled with [γ-32P] ATP using T4 polynucleotide kinase, and purified using Chroma Spin-10 columns. Samples were incubated with the labelled oligonucleotide (20,000–30,000 cpm) for 20 min at room temperature in 1× binding buffer [5× binding buffer: 50 mM Tris-HCl buffer, pH 7.5, containing 20% (v/v) glycerol, 5 mM MgCl2, 2.5 mM EDTA, 2.5 mM DTT, 250 mM NaCl, and 0.25 mg/ml poly(dI-dC)]. The products were separated by electrophoresis in a 6% (w/v) non-denaturing polyacrilamide gel using 0.5 X TBE (Tris/borate 45 mM, EDTA 1mM) as the running buffer. The gels were dried and the radioactivity quantified in a Phosphoimager 840 (Amersham Pharmacia Biotech. Inc., Piscataway, NJ).
Statistical Analysis
Data were expressed as mean ± SEM. The statistical significance was assessed by one-way ANOVA followed by Bonferroni´s Multiple Comparison post-test. GraphPad Prism version 5.00 for Windows (GraphPad Software, San Diego, CA, USA) was used for all statistical analysis. Differences were considered significant at p<0.05.
RESULTS
In vivo studies
Animal outcome and metabolic variables
To assess the effects of catechin and quercetin supplementation on MetS thirty-day-old rats were fed HFr with or without 20 mg/Kg/d of C, Q, and the combination of both (CQ) during 6 wk. At the end of the study, metabolic parameters were determined as shown in Table 1. Daily food consumption was comparable among groups, while daily water intake was higher in the HFr groups than in Ctrl rats (p<0.01). Similar to previous studies [15, 20] caloric intake was higher in the four groups receiving fructose than in the Ctrl group (p<0.05). No differences were observed in body weight among groups. However, HFr diet induced significant increase in epididymal adipose tissue compared with the Ctrl group, which was markedly alleviated by co-administration of C, Q and the combination of both compounds (Table 1).
Table 1.
Effect of dietary supplementation with C, Q and both compounds on metabolic parameters in a rat model of MetS. Body weight and metabolic parameters in rats fed control diets without (Crtl) or with (HFr) 10% (w/v) fructose in the water, or HFr diets supplemented with catechin (C), quercetin (Q) or both (CQ) (20 mg/Kg/d). Glucose, insulin, tryglicerides, TBARS and adiponectin levels were measured in plasma.
| Parameter | Groups | ||||
|---|---|---|---|---|---|
| Ctrl | HFr | HFr+C | HFr−Q | HFr+CQ | |
| Food intake (g/d) | 16.3 ± 0.5 | 15.7 ± 0.5 | 14.3 ± 0.4 | 15.4 ± 0.6 | 14.5 ± 0.6 |
| Water intake (ml/d) | 43.3 ± 0.9a | 52.5 ± 0.8b | 53.0 ± 0.9b | 54.0 ± 1.0b | 52.6 ± 0.9b |
| Energy intake (Kcal/d) | 45.4 ± 1.4a | 64.6 ± 1.7b | 61.0 ± 1.5b | 64.3 ± 1.8b | 61.3 ± 2.1b |
| Body weight (BW) (g) | 295 ± 8 | 290 ± 8 | 261 ± 8 | 288 ± 12 | 279 ± 12 |
| Epididymal adipose tissue (mg)/BW (g) | 4.3 ± 0.3a | 6.4 ± 1.4b | 4.4 ± 0.5a | 4.3 ± 0.6a | 4.0 ± 0.9a |
| Glucose (mM) | 4.5 ± 0.2 | 4.8 ± 0.4 | 4.0 ± 0.1 | 4.4 ± 0.1 | 4.7 ± 0.2 |
| Insulin (µU/mL) | 10.9 ± 1.0a | 24.8 ± 2.4b | 15.7 ± 0.9a | 16.6 ± 1.0a | 15.2 ± 0.9a |
| HOMA IR (mmol/L × µU/ml) | 2.2 ± 0.2a | 5.3 ± 0.5b | 2.8 ± 0.3a | 3.2 ± 0.3a | 3.2 ± 0.3a |
| Triglycerides (mM) | 0.65 ± 0.02a | 1.21 ± 0.08b | 0.81 ± 0.06a,c | 0.89 ± 0.02c | 0.64 ± 0.03a |
| TBARS (µM) | 0.9 ± 0.0a | 1.3 ± 0.1b | 1.0 ± 0.0a,b | 0.8 ± 0.1a | 0.71 ± 0.1a |
| Adiponectin (ng/ml) | 24.5 ± 2.1a | 9.7 ± 2.0b | 20.5 ± 4.3a | 19.6 ± 2.8a | 29.5 ± 1.0a |
Values are mean ± SEM, n = 6. Values with different superscripts are significantly different, P < 0.05. HOMA-IR, homeostatic model assessment-insulin resistance.
Fructose consumption during 6 wk led to the development of metabolic alterations characteristic of MetS. HFr group exhibited increased plasma triglycerides, insulin concentrations, and higher index of insulin resistance (HOMA-IR) compared to Ctrl rats. The adverse effects of fructose consumption on these metabolic parameters were mitigated by C, Q, and CQ supplementation. In addition, HFr-fed rats exhibited increased plasma levels of TBARS, a marker of lipid oxidation and lower concentration of adiponectin that were significantly alteretd by C, Q and CQ treatment. Moreover, the combination of C and Q had stronger effects on triglycerides and TBARS than C and Q individually.
C and Q attenuate epididymal adipose tissue inflammation in HFr-fed rats
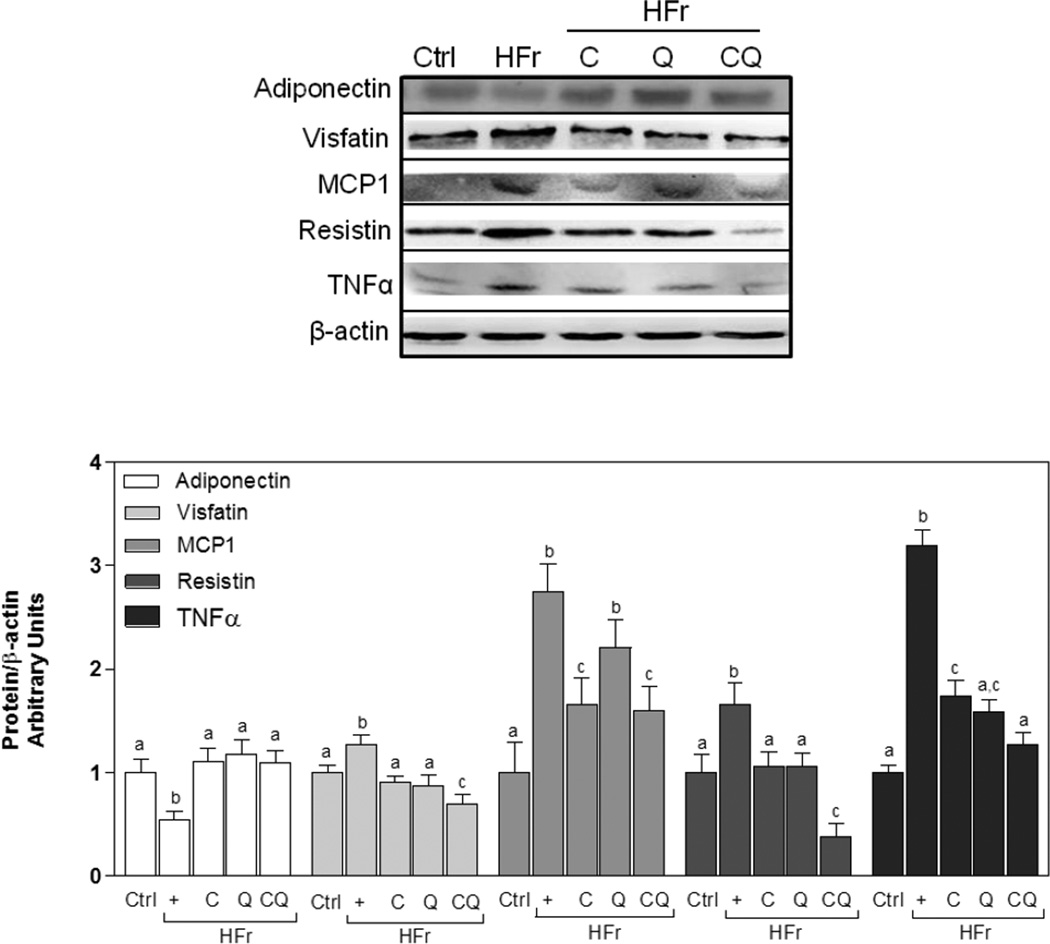
To evaluate inflammation in adipose tissue we measured protein levels of adiponection, resistin, visfatin, TNFα, and MCP1 in epididymal adipose tissue. Concentrations of all these cytokines were significantly higher in adipose tissue from HFr-fed rats compared with the Ctrl group (Fig. 2). Supplementation with both C and Q caused a significantly greater reduction in resistin and visfatin protein levels than C and Q separately. In addition, only C supplementation attenuated MCP1 increase, and the combination of both had no further effect, suggesting that the combinatorial effect was due to C. C and Q, and to a greater extent CQ significantly decreased HFr-mediated TNFα increase. Moreover, adiponectin protein expression was lower in HFr-fed rats than in the Ctrl group, while C, Q and the combination of both inhibited this decrease (Fig. 2).
Figure 2. Effects of C and Q on adipocytokine protein expression in epididymal adipose tissue from high fructose-fed rats.
Proteins involved in metabolic regulation and in inflammation were measured in rats fed control diets without (Ctrl) or with (HFr) 10% (w/v) fructose in the water, or HFr diets supplemented with catechin (C), quercetin (Q) or both (CQ) (20 mg/Kg/d). Adiponectin, visfatin, MCP1, resistin, and TNFα protein levels were determined in epididymal adipose tissue. Bands were quantified and results were referred to β-actin as loading control, and expressed relative to control values. Data represent means ± SEM of 6 rats per group. Values having different superscripts are significantly different, p < 0.05, one way ANOVA test.
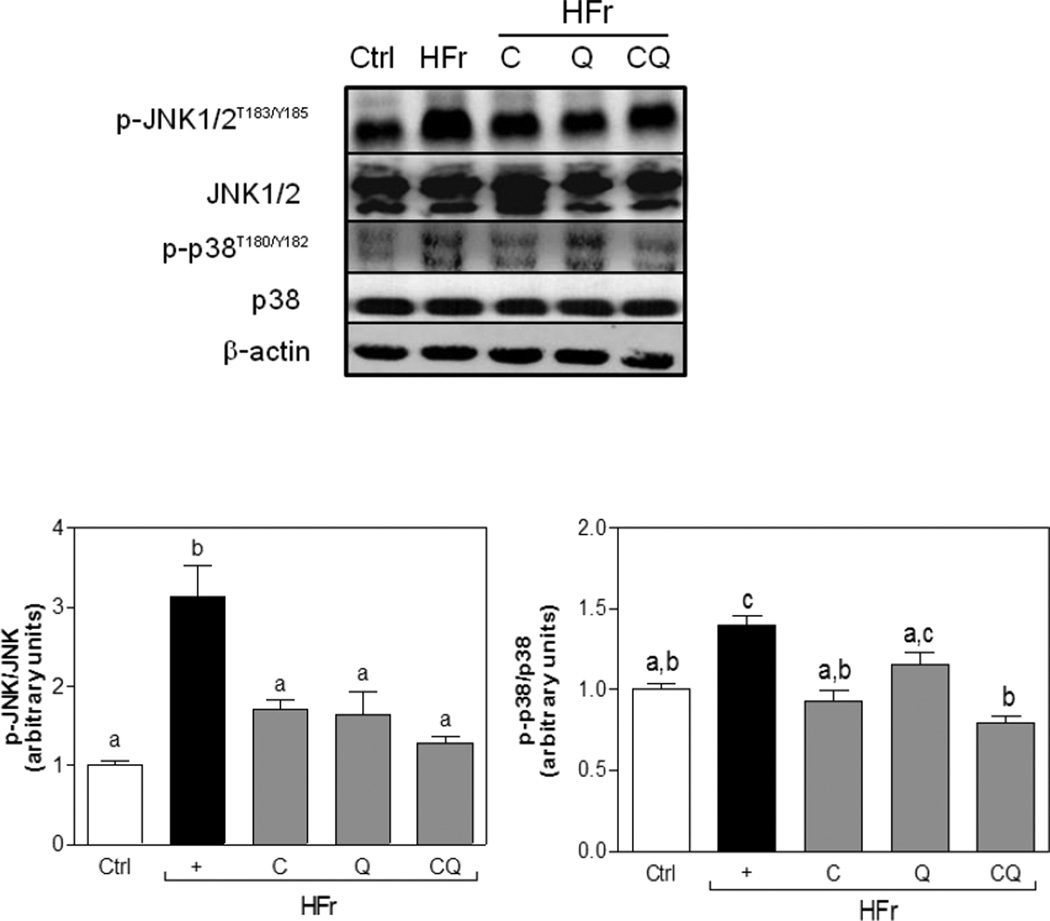
The MAPKs p38 and JNK are activated by oxidative stress, and play a major role in chronic inflammation [26]. Accordingly, we evaluated the effects of C and Q supplementation on the activation of this pathway in HFr-fed animals. Fructose consumption caused an increase in JNK (Thr183, Tyr185) and p38 (Thr180, Tyr182) phosphorylation. Supplementation with C, Q and both compounds simultaneously attenuated p-JNK increase, while C and both compounds significantly reduced p38 phosphorylation (Fig. 3).
Figure 3. Effects of C and Q on the activation of the MAPKs p38 and JNK in epididymal adipose tissue from high fructose-fed rats.
Phosphorylated and total JNK1/2, and p38 protein levels were measured in epididymal adipose tissue from rats fed control diets without (Ctrl) or with (HFr) 10% (w/v) fructose in the water, or HFr diets supplemented with catechin (C), quercetin (Q) or both (CQ) (20 mg/Kg/d). Bands were quantified and results expressed as phosphorylated/total protein content and expressed relative to control values. Data represent means ± SEM of three-four rats per group. Values having different superscripts are significantly different, p < 0.05, one way ANOVA test.
In vitro studies
To explore the underling mechanism by which dietary C and Q can attenuate inflammation in adipose tissue, we used adipocytes challenged with TNFα as a pro-inflammatory stimulus. TNFα is one of the main systemic cytokines that is increased in MetS.
C and Q prevent TNFα-reduced adiponectin secretion
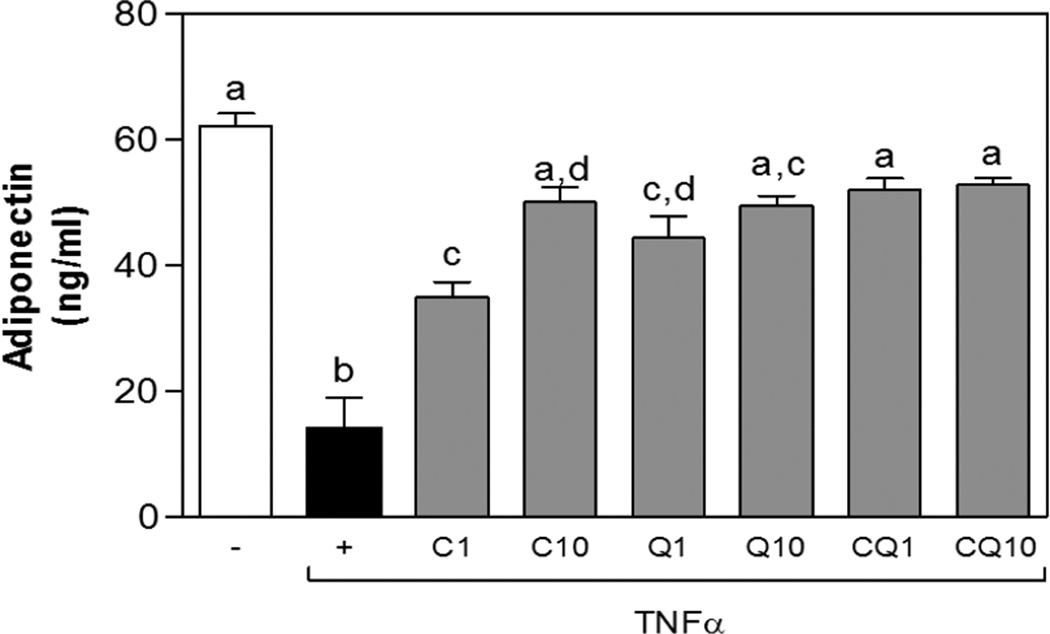
3T3-L1 adipocytes were differentiated as indicated in methods and adiponectin concentration is serum was determined. Stimulation with TNFα for 24 h significantly reduced adiponectin concentration (Fig. 4). In addition, treatment with C and Q (1–10 µM) restored adiponectin concentrations in a dose-dependent manner. Moreover, incubation with both compounds at 1 and 10 µM, prevented TNFα-mediated decrease in adiponectin and levels were comparable to control cells (Fig.4A).
Figure 4. C and Q prevent TNFα-mediated reduced adiponectin secretion from 3T3-L1 adipocytes.
3T3-L1 adipocytes were incubated without or with catechin (C), quercetin (Q) or both compounds (Q) (1 and10 µM) for 4 h, and subsequently in the absence or presence of 20 ng/ml TNFα for further 24 h. Medium adiponectin levels were measured. Data represent means ± SEM of three independent experiments. Values having different superscripts are significantly different, p < 0.05, one way ANOVA test.
Effects of C and Q on pro-inflammatory and anti-inflammatory cytokines in 3T3-L1 adipocytes
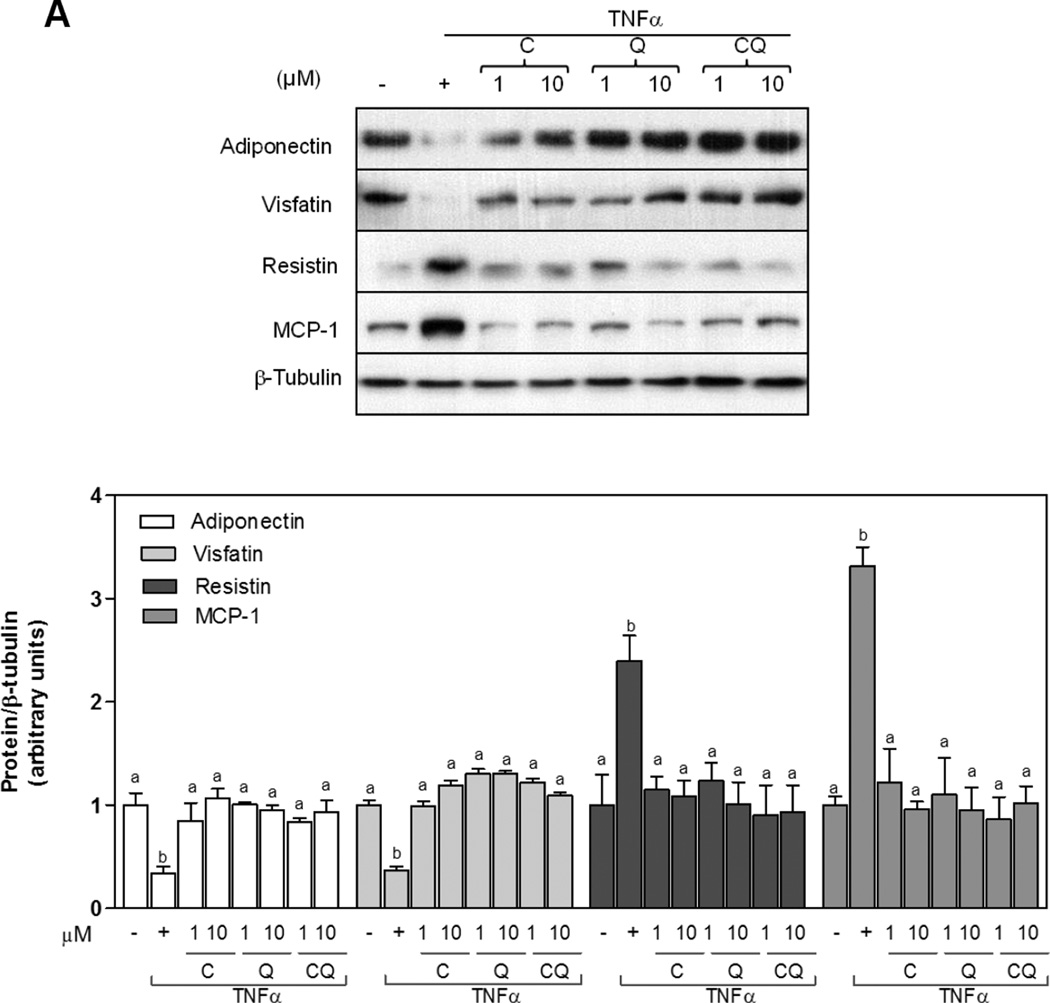
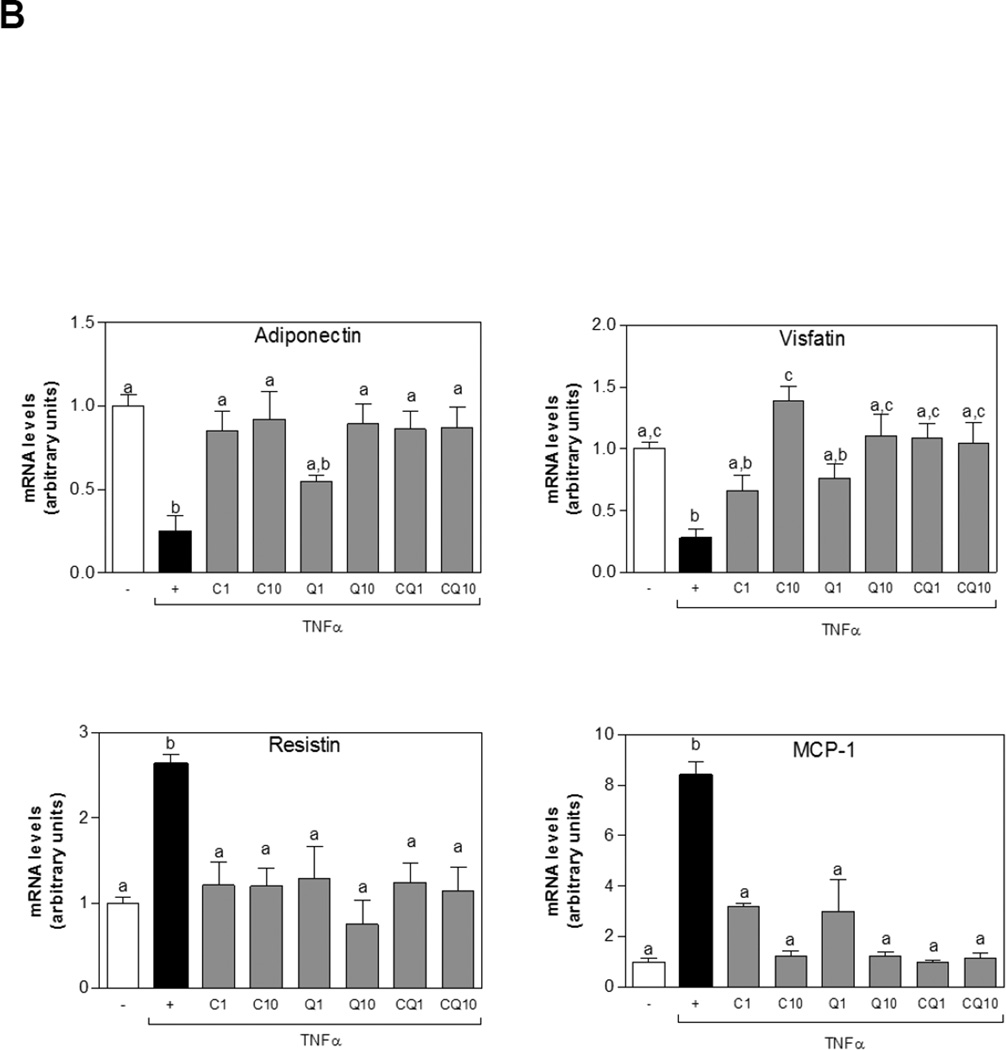
The capacity of C and Q to modulate mRNA and protein expression of adiponectin, resistin, visfatin, and MCP1 in 3T3-L1 adipocytes stimulated with TNFα was investigated. After incubation with TNFα adiponectin and visfatin protein levels were significantly decreased. On the other hand, MCP1 and resistin protein levels were higher than controls. Importantly, incubation of cells with either C, Q or both flavonoids, attenuated TNFα-induced adiponectin and visfatin decrease and MCP1 and resistin increase (Fig.5 A). A similar pattern for mRNA levels was observed for these cytokines (Fig. 5B).
Figure 5. Effects of C and Q on adipokines proteins and gene expression in 3T3-L1 adipocytes.
3T3-L1 adipocytes were incubated without or with catechin (C), quercetin (Q) or both compounds (CQ) (1and10 µM) for 4 h, and subsequently in the absence or presence of 20 ng/ml TNFα for further 24 h. (A) Adiponectin, visfatin, resistin and MCP1protein levels were measured by Western blot. Bands were quantified and results were expressed as the ratio protein/β-tubulin protein levels, and referred to untreated cell values (1). (B) mRNA levels for adiponectin, visfatin, resistin, and MCP-1 were measured by quantitative real-time PCR, normalized against TATA-Box binding protein (TBP) and expressed relative to control cells (Arbitrary unit = 1). Data represent means ± SEM of three independent experiments. Values having different superscripts are significantly different, p < 0.05, one way ANOVA test.
C and Q decreased TNFα-induced oxidative stress, and MAPKs and AP-1 activation in 3T3-L1
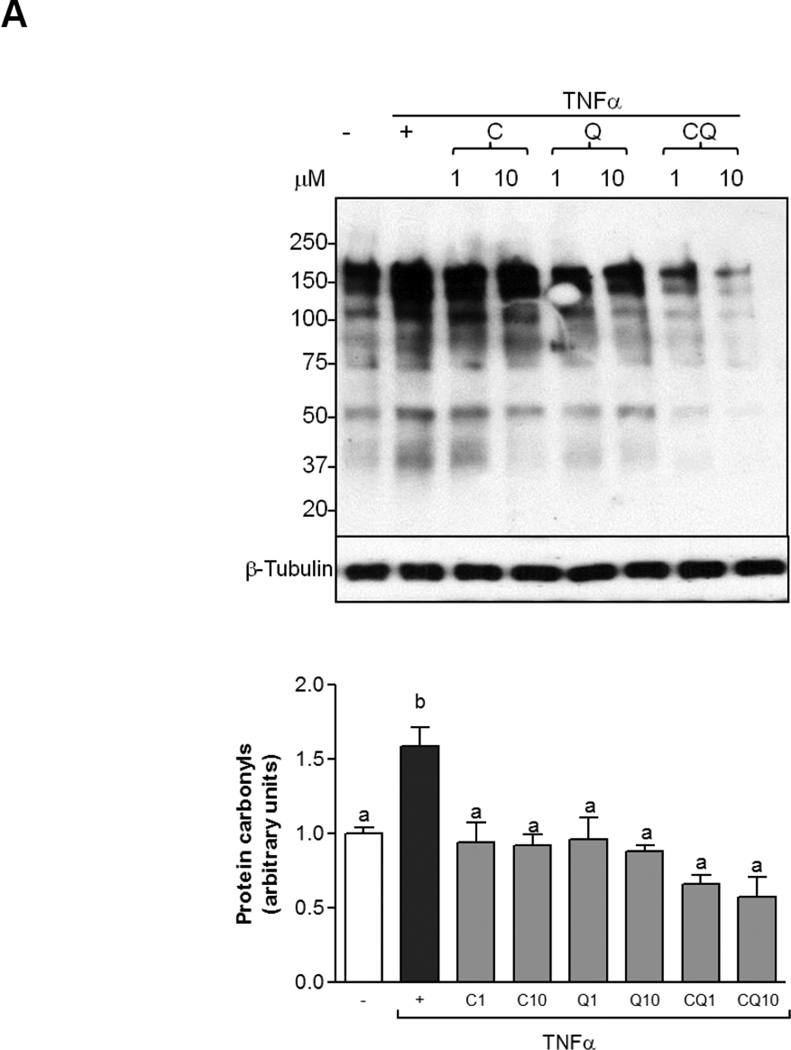
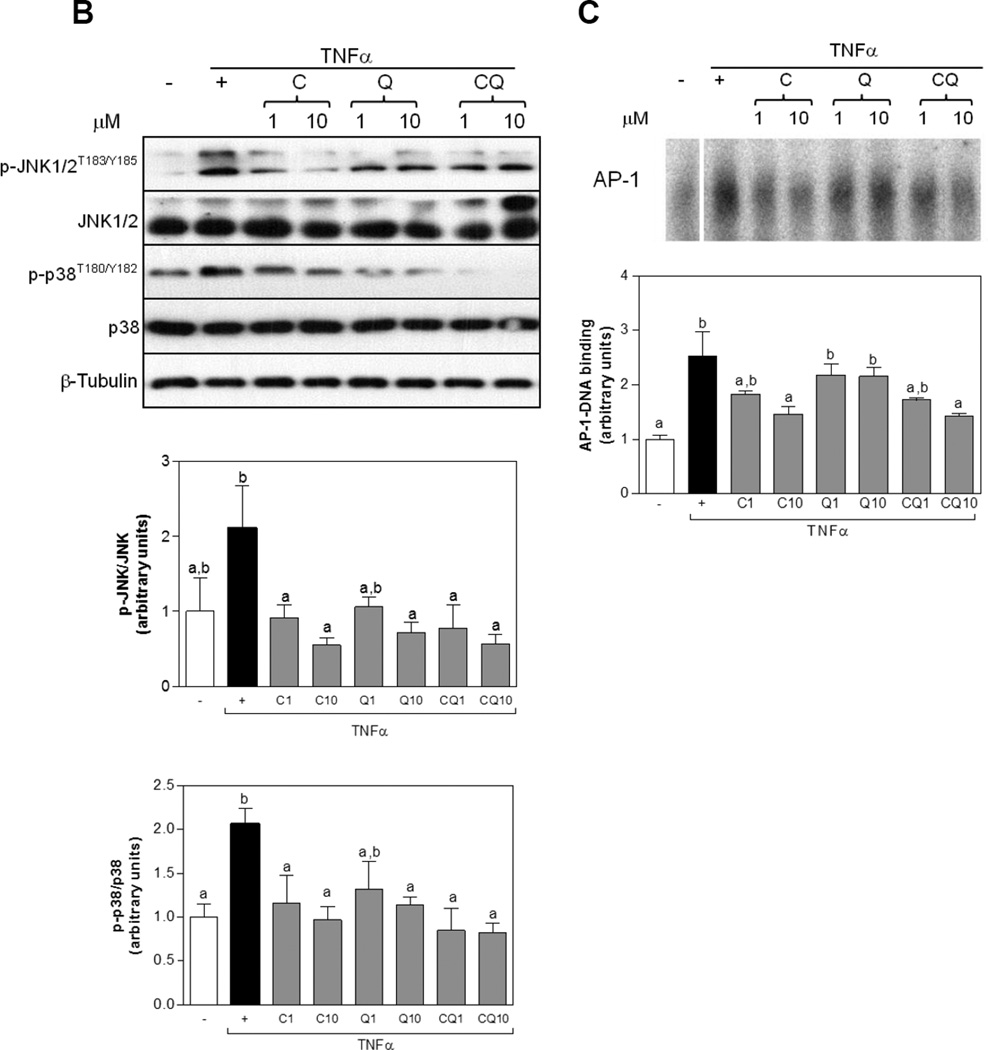
MAPK/AP-1 pathway is in part activated by oxidative stress and contributes to the upregulation of expression of pro-inflammatory cytokines and downregulates adiponectin. In order to measure an oxidative stress parameter we evaluated the oxidative modification of proteins. TNFα increased protein carbonyl in adipocytes, while co-incubation with C, Q and CQ attenuates this increase (Fig. 6 A). In addition, TNFα caused 2.1-fold increase of JNK and p38 phosphorylation in differentiated adipocytes (Fig. 6 B). Incubation with C at 1 and 10 µM, and Q at 10 µM prevented TNFα-induced JNK1/2 and p38 phosphorylation. No further effects were observed by treatment with both C and Q. Downstream of p38 and JNK, TNFα increased AP-1-DNA binding in nuclear fractions which peaked after 2 h of treatment (Fig. 6 C). While, Q (1 and 10 µM) did not affect TNFα-induced AP-1 activation, co-incubation with C, and the combination of both flavonoids at 10 µM decreased AP-1-DNA nuclear binding to a similar extent than Ctrl alone, indicating that the combinatorial effect was likely due to C (Fig. 6 C).
Figure 6. C and Q prevent TNFα-induced oxidative stress, MAPKs and AP-1 activation in 3T3-L1 adipocytes.
3T3-L1 adipocytes were incubated without or with catechin (C), quercetin (Q) or both compounds (CQ) (1 and 10 µM) for 4 h, and subsequently in the absence or presence of 20 ng/ml TNFα for further 24h to measure protein carbonyls, 15 min (MAPKs) or 2 h (AP-1). (A) protein carbonyls were measured as described in methods; (B) phosphorylated and total JNK1/2 and p38 protein levels in total cell extracts; (C) AP-1-DNA binding in nuclear fractions as determined by EMSA. Bands were quantified and results were referred to untreated cell values (Arbitrary unit = 1). For Western blots (B) results were expressed as the ratio phosphorylated/total protein levels. Data represent means ± SEM of three to five independent experiments. Values having different superscripts are significantly different, p < 0.05, one way ANOVA test.
C and Q attenuate TNFα-mediated suppression of PPARγ in 3T3-L1 adipocytes
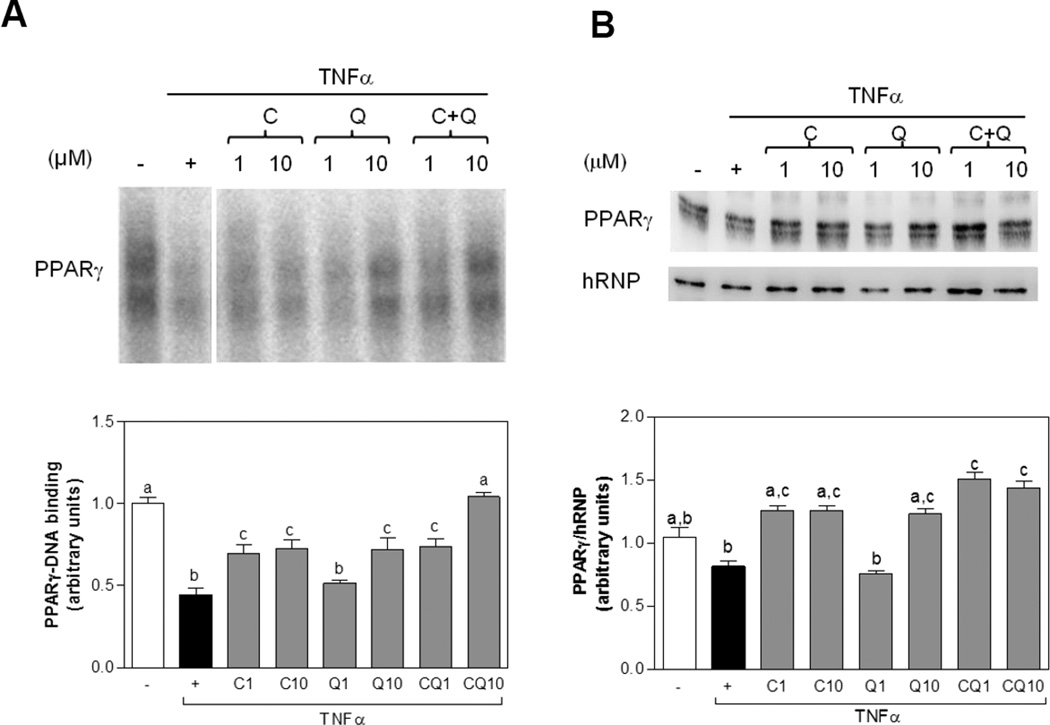
PPARγ plays a central role in the regulation of inflammation and insulin resistance. Incubation with TNFα for 2 h decreased (56%) PPARγ-DNA binding in nuclear fractions compared with control cells (Fig. 7). C (1 and10 µM) and Q (10 µM), and to a larger extent the combination of both flavonoids at 10 µM increased PPARγ-DNA binding (Fig. 7 A). Incubation for 24 h with C (1 and 10 µM), Q (10 µM), and the combination of both compounds (1 and10 µM) increased nuclear PPARγ protein levels as compared with Ctrl and TNFα-treated cells (Fig. 7 B). Together, these findings establish that C and Q could attenuate adipokine deregulation through the modulation of the MAPKs p38 and JNK, AP-1, and PPARγ signaling pathways.
Figure 7. C and Q prevent TNFα-induced PPARγ downregulation in 3T3-L1 adipocytes.
3T3-L1 adipocytes were incubated without or with catechin (C), quercetin (Q) or both compounds (CQ) (1–10 µM) for 4 h, and subsequently in the absence or presence of 20 ng/ml TNFα for further 2 h (PPARγ-DNA binding) or 24 h (PPARγ). (A) PPAR-DNA binding in nuclear fractions as determined by EMSA, and (B) nuclear PPARγ protein levels referred to the nuclear content of heterogeneous nuclear ribonucleoprotein (hRNP). (A and B) Bands were quantified and results were referred to untreated cell values (Arbitrary unit = 1). Results are shown as mean ± SEM of three independent experiments. Values having different superscripts are significantly different, p < 0.05, one way ANOVA test.
DISCUSSION
This study demonstrated that rat dietary supplementation with C, Q and to a greater extent the combination of both flavonoids attenuated the adverse metabolic effects associated with high fructose consumption: insulin resistance, adiposity, and adipose tissue inflammation. In 3T3-L1 adipocytes, C, Q, and the combination of both, inhibited TNFα-mediated: i- activation of MAPK/AP-1 and expression of pro-inflammatory cytokines; and ii- downregulation of major modulators of glucose and lipid metabolism (PPARγ and adiponectin)
Consumption of high dietary fructose leads to visceral adiposity and insulin resistance in humans and in rats, which is associated to local and systemic inflammation [9, 27, 28]. In addition, exposure of primary human preadipocytes to high fructose leads to early development of lipid vesicles [29]. HFr-fed rats supplemented with C, Q, and the combination of both flavonoids, exhibited decreased visceral adipose tissue and reduced adipose inflammation. Indeed C and Q supplementation decreased abdominal obesity in human and animal models of MetS [22, 30–32]. These protective effects could be attributed to decreased lipid absorption [33], increased fat oxidation [34], modulation of signaling pathways involved in inflammation, lipid and glucose metabolism, as well as other mechanisms [35, 36].
Adipose inflammation is recognized as a contributor to decreased insulin sensitivity. TNFα is the main activator of pro-inflammatory signaling cascades, which regulate the transcription of pro-inflammatory genes such as TNFα, MCP1, and resistin, leading to a self-feeding inflammatory cycle. Secreted by adipocytes, MCP1 contributes to chronic inflammation by stimulating macrophage recruitment into the adipose tissue [37]. Resistin is proposed to be a pro-inflammatory cytokine linking obesity with insulin resistance [38]. It is also considered an important risk factor for cardiovascular disease in T2D patients [39]. We observed an increased expression of TNFα, MCP1 and resistin in the adipose tissue from HFr-fed rats, and of MCP1 and resistin in TNFα-treated 3T3-L1 adipocytes. Importantly, the observed in vivo and in vitro elevation in cytokines was mitigated by C, Q, and CQ. In addition, HFr consumption caused an increase in visfatin expression that was attenuated by C and Q supplementation, while in 3T3-L1 adipocytes, TNFα decreased visfatin protein expression and mRNA levels. C, Q, and the combination of both, prevented these alterations. Visfatin expression increases during adipocyte differentiation, and correlates with adiposity in obesity and T2D [40]. However, current evidence on the effects of visfatin on inflammation and insulin resistance is controversial and contradictory [41, 42]. MAPKs p38 and JNK are in part activated by oxidative stress and are contributors to obesity-associated insulin resistance and inflammation [26, 43, 44]. In our current in vivo and in vitro models of adiposity and inflammation we observed high levels of plasma TBARS, cell (protein carbonyls) oxidation, and JNK/p38/AP-1 activation, which were mitigated by C,Q and CQ supplementation. This is in agreement with previous findings in 3T3-L1 and human adipocytes [21, 45]. Overall, the above results support an anti-inflammatory effect for both C and Q which could be in part mediated by their capacity to diminish oxidative stress-associated JNK/p38/AP-1 activation.
JNK is a negative modulator of insulin signaling in part throughphosphorylation of IRS1 [44], and through downregulation of PPARγ [46]. PPARγ is essential for adipose tissue development and metabolism and for the regulation of insulin sensitivity and lipogenesis. In this regard, exposure of 3T3-L1 adipocytes to high-fructose concentrations suppresses adiponectin expression [47]. PPARγ also promotes the transcription of adiponectin, which modulates glucose metabolism, fatty acid oxidation and exerts anti-inflammatory actions. Also, PPARγ decreases macrophage adipose tissue infiltration and promotes macrophages conversion from M1 into an anti-inflammatory M2 phenotype [48]. We observed that TNFα downregulated PPARγ, and decreased adiponectin levels in 3T3 adipocytes, effects that were mitigated by C and Q. In rats, HFr feeding also caused a decrease in adipose and plasma adiponectin levels that was prevented by supplementation with Q, C and the combination of both. In line with these findings, we recently observed that (−)-epicatechin, a catechin isomer, inhibits TNFα-mediated MAPK activation, PPARγ downregulation, and the expression of proteins involved in inflammation in 3T3-L1 adipocytes [21]. Although the positive effects of C and Q on PPARγ and adiponectin are consistent, the exact underlying mechanisms are still unclear. Several studies report that C and Q supplementation promotes adiponectin secretion by PPARγ activation [45, 49, 50], while other showed that quercetin enhances adiponectin secretion independently of PPARγ activation [51].
Catechin and quercetin are among the most abundant flavonoids present in the human diet, and to date there are no studies evaluating the interaction of these two flavonoids on adipose inflammation in animal models of diet-induced MetS. Some in vitro studies have shown a synergistic effect of catechin and quercetin on the inhibition of collagen-induced platelet aggregation and platelet adhesion [52]. C and Q also synergistically inhibit angiotensin II-induced redox-dependent signaling pathways in vascular smooth muscle cells from hypertensive rats [53], while no synergistic effects were observed in pulmonary vascular smooth muscle [54]. Other study that evaluated the anti-proliferative effects of quercetin, catechin and epicatechin in three different cancer cell lines, showed that only quercetin possess anti-proliferative activity [55], suggesting that these compounds may have different mechanisms of action. In this regard, dietary flavonoids could exert additive and/or synergistic effects through one or more signaling and transcriptional mechanisms [50]. We observed both additive and synergistic effects between C and Q. Differences in C and Q effects in the in vivo and in vitro models could be due to their in vivo conversion metabolites which can have higher or lower activities than the parent compounds.
Our current findings suggest that dietary C and Q, and to a greater extent the combination of both flavonoids, can mitigate MetS-associated visceral adipose tissue accumulation and adipose inflammation, improving metabolic parameters related to insulin sensitivity. In vitro studies (3T3-L1 adipocytes) suggest that these beneficial effects can be in part due to the ability of C and Q to attenuate adipokine deregulation through the modulation of the MAPKs p38 and JNK, AP-1, and PPARγ signaling pathways. Diets rich in C and Q may have a preventive impact in the development of MetS as a consequence of their capacity to regulate cell redox status and to exert anti-inflammatory actions. The selection of dietary elements (e.g. fruit, vegetables) enriched in particular flavonoids, could help design diets with beneficial effects on MetS development.
Acknowledgments
This work was supported by Programa I+D 2010 Universidad Nacional de Cuyo and PIP CONICET to M.V.P and R.M.M.; PICT-2011-1957 to M.V.P.; NIFA-USDA (CA-D*-xxx-7244-H) to P.I.O; NIH (R01DK090492 and R01DK095359) to F.G.H. and K99DK100736 to A.B. The authors thank Susana Gonzalez and Cristina Lama for their technical assistance.
Abreviations
- AP-1
activator protein 1
- C
catechin
- Ctrl
control
- CQ
catechin and quercetin
- HFr
high fructose
- JNK
c-jun N-terminal kinase
- MAPK
mitogen-activated protein kinase
- MCP-1
monocyte chemoattractant protein 1
- MetS
metabolic syndrome
- PPARγ
peroxisome proliferator-activator receptor gamma
- Q
quercetin
- ROS
reactive oxygen species
- TBARS
thiobarbituric acid reactive substances
- TNFα
tumor necrosis factor alpha
- T2D
type 2 diabetes
Footnotes
M.V.P., C.R.G., R.M.M. and P.I.O. designed research; M.V.P., A.B., C.R.L.; V.C.S and D.J.P. conducted research; M.V.P., A.B., R.M.M., and P.I.O. analyzed data; M.V.P., F.G.H and P.I.O wrote the paper; M.V.P. and P.I.O had primary responsibility for final content. All authors read and approved the final manuscript.
The authors have declared no conflict of interest.
REFERENCES
- 1.Ford ES, Giles WH, Dietz WH. Prevalence of the metabolic syndrome among US adults: findings from the third National Health and Nutrition Examination Survey. Jama. 2002;287:356–359. doi: 10.1001/jama.287.3.356. [DOI] [PubMed] [Google Scholar]
- 2.Tappy L, Le KA. Metabolic effects of fructose and the worldwide increase in obesity. Physiol Rev. 2010;90:23–46. doi: 10.1152/physrev.00019.2009. [DOI] [PubMed] [Google Scholar]
- 3.Cameron AJ, Shaw JE, Zimmet PZ. The metabolic syndrome: prevalence in worldwide populations. Endocrinol Metab Clin North Am. 2004;33:351–375. doi: 10.1016/j.ecl.2004.03.005. [DOI] [PubMed] [Google Scholar]
- 4.Cummings BP, Stanhope KL, Graham JL, Evans JL, et al. Dietary fructose accelerates the development of diabetes in UCD-T2DM rats: amelioration by the antioxidant, alpha-lipoic acid. Am J Physiol Regul Integr Comp Physiol. 2010;298:10. doi: 10.1152/ajpregu.00468.2009. [DOI] [PMC free article] [PubMed] [Google Scholar]
- 5.Cox CL, Stanhope KL, Schwarz JM, Graham JL, et al. Circulating concentrations of monocyte chemoattractant protein-1, plasminogen activator inhibitor-1, and soluble leukocyte adhesion molecule-1 in overweight/obese men and women consuming fructose- or glucose-sweetened beverages for 10 weeks. J Clin Endocrinol Metab. 2011;96:2011–1050. doi: 10.1210/jc.2011-1050. [DOI] [PMC free article] [PubMed] [Google Scholar]
- 6.Vazquez-Prieto MA, Rodriguez Lanzi C, Lembo C, Galmarini CR, Miatello RM. Garlic and onion attenuates vascular inflammation and oxidative stress in fructose-fed rats. J Nutr Metab. 2011;475216:25. doi: 10.1155/2011/475216. [DOI] [PMC free article] [PubMed] [Google Scholar]
- 7.Bantle JP. Dietary fructose and metabolic syndrome and diabetes. J Nutr. 2009;139:29. doi: 10.3945/jn.108.098020. [DOI] [PMC free article] [PubMed] [Google Scholar]
- 8.Pollock NK, Bundy V, Kanto W, Davis CL, et al. Greater fructose consumption is associated with cardiometabolic risk markers and visceral adiposity in adolescents. J Nutr. 2012;142:251–257. doi: 10.3945/jn.111.150219. [DOI] [PMC free article] [PubMed] [Google Scholar]
- 9.Stanhope KL, Schwarz JM, Keim NL, Griffen SC, et al. Consuming fructose-sweetened, not glucose-sweetened, beverages increases visceral adiposity and lipids and decreases insulin sensitivity in overweight/obese humans. J Clin Invest. 2009;119:1322–1334. doi: 10.1172/JCI37385. [DOI] [PMC free article] [PubMed] [Google Scholar]
- 10.Vos MB, Kimmons JE, Gillespie C, Welsh J, Blanck HM. Dietary fructose consumption among US children and adults: the Third National Health and Nutrition Examination Survey. Medscape J Med. 2008;10:160. [PMC free article] [PubMed] [Google Scholar]
- 11.Matsuzawa Y. The metabolic syndrome and adipocytokines. FEBS Lett. 2006;580:2917–2921. doi: 10.1016/j.febslet.2006.04.028. [DOI] [PubMed] [Google Scholar]
- 12.Gregor MF, Hotamisligil GS. Inflammatory mechanisms in obesity. Annu Rev Immunol. 2011;29:415–445. doi: 10.1146/annurev-immunol-031210-101322. [DOI] [PubMed] [Google Scholar]
- 13.Lefterova MI, Haakonsson AK, Lazar MA, Mandrup S. PPARgamma and the global map of adipogenesis and beyond. Trends Endocrinol Metab. 2014 Apr 29; doi: 10.1016/j.tem.2014.04.001. pii: S1043-2760(14)00071-X. [DOI] [PMC free article] [PubMed] [Google Scholar]
- 14.Rivera L, Moron R, Sanchez M, Zarzuelo A, Galisteo M. Quercetin ameliorates metabolic syndrome and improves the inflammatory status in obese Zucker rats. Obesity. 2008;16:2081–2087. doi: 10.1038/oby.2008.315. [DOI] [PubMed] [Google Scholar]
- 15.Vazquez-Prieto MA, Renna NF, Diez ER, Cacciamani V, et al. Effect of red wine on adipocytokine expression and vascular alterations in fructose-fed rats. Am J Hypertens. 2011;24:234–240. doi: 10.1038/ajh.2010.214. [DOI] [PubMed] [Google Scholar]
- 16.Fraga CG, Galleano M, Verstraeten SV, Oteiza PI. Basic biochemical mechanisms behind the health benefits of polyphenols. Mol Aspects Med. 2010;31:435–445. doi: 10.1016/j.mam.2010.09.006. [DOI] [PubMed] [Google Scholar]
- 17.Beecher GR. Overview of dietary flavonoids: nomenclature, occurrence and intake. J Nutr. 2003;133:3248S–3254S. doi: 10.1093/jn/133.10.3248S. [DOI] [PubMed] [Google Scholar]
- 18.Kleemann R, Verschuren L, Morrison M, Zadelaar S, et al. Anti-inflammatory, anti-proliferative and anti-atherosclerotic effects of quercetin in human in vitro and in vivo models. Atherosclerosis. 2011;218:44–52. doi: 10.1016/j.atherosclerosis.2011.04.023. [DOI] [PubMed] [Google Scholar]
- 19.Nagao T, Meguro S, Hase T, Otsuka K, et al. A catechin-rich beverage improves obesity and blood glucose control in patients with type 2 diabetes. Obesity. 2009;17:310–317. doi: 10.1038/oby.2008.505. [DOI] [PubMed] [Google Scholar]
- 20.Bettaieb A, Vazquez Prieto MA, Rodriguez Lanzi C, Miatello RM, et al. (−)-Epicatechin mitigates high-fructose-associated insulin resistance by modulating redox signaling and endoplasmic reticulum stress. Free Radic Biol Med. 2014;16:00171–00173. doi: 10.1016/j.freeradbiomed.2014.04.011. [DOI] [PMC free article] [PubMed] [Google Scholar]
- 21.Vazquez-Prieto MA, Bettaieb A, Haj FG, Fraga CG, Oteiza PI. (−)-Epicatechin prevents TNFalpha-induced activation of signaling cascades involved in inflammation and insulin sensitivity in 3T3-L1 adipocytes. Arch Biochem Biophys. 2012;527:113–118. doi: 10.1016/j.abb.2012.02.019. [DOI] [PMC free article] [PubMed] [Google Scholar]
- 22.Panchal SK, Poudyal H, Brown L. Quercetin ameliorates cardiovascular, hepatic, and metabolic changes in diet-induced metabolic syndrome in rats. J Nutr. 2012;142:1026–1032. doi: 10.3945/jn.111.157263. [DOI] [PubMed] [Google Scholar]
- 23.Matthews DR, Hosker JP, Rudenski AS, Naylor BA, et al. Homeostasis model assessment: insulin resistance and beta-cell function from fasting plasma glucose and insulin concentrations in man. Diabetologia. 1985;28:412–419. doi: 10.1007/BF00280883. [DOI] [PubMed] [Google Scholar]
- 24.Bradford MM. A rapid and sensitive method for the quantitation of microgram quantities of protein utilizing the principle of protein-dye binding. Anal Biochem. 1976;72:248–254. doi: 10.1016/0003-2697(76)90527-3. [DOI] [PubMed] [Google Scholar]
- 25.Wehr NB, Levine RL. Quantification of protein carbonylation. Methods Mol Biol. 2013;965:265–281. doi: 10.1007/978-1-62703-239-1_18. [DOI] [PubMed] [Google Scholar]
- 26.Henriksen EJ, Diamond-Stanic MK, Marchionne EM. Oxidative stress and the etiology of insulin resistance and type 2 diabetes. Free Radic Biol Med. 2011;51:993–999. doi: 10.1016/j.freeradbiomed.2010.12.005. [DOI] [PMC free article] [PubMed] [Google Scholar]
- 27.Stanhope KL, Havel PJ. Fructose consumption: potential mechanisms for its effects to increase visceral adiposity and induce dyslipidemia and insulin resistance. Curr Opin Lipidol. 2008;19:16–24. doi: 10.1097/MOL.0b013e3282f2b24a. [DOI] [PMC free article] [PubMed] [Google Scholar]
- 28.Alzamendi A, Giovambattista A, Raschia A, Madrid V, et al. Fructose-rich diet-induced abdominal adipose tissue endocrine dysfunction in normal male rats. Endocrine. 2009;35:227–232. doi: 10.1007/s12020-008-9143-1. [DOI] [PubMed] [Google Scholar]
- 29.Robubi A, Huber KR, Krugluger W. Extra fructose in the growth medium fuels lipogenesis of adipocytes. J Obes. 2014;647034:19. doi: 10.1155/2014/647034. [DOI] [PMC free article] [PubMed] [Google Scholar]
- 30.Kobori M, Masumoto S, Akimoto Y, Oike H. Chronic dietary intake of quercetin alleviates hepatic fat accumulation associated with consumption of a Western-style diet in C57/BL6J mice. Mol Nutr Food Res. 2011;55:530–540. doi: 10.1002/mnfr.201000392. [DOI] [PubMed] [Google Scholar]
- 31.Wang H, Wen Y, Du Y, Yan X, et al. Effects of catechin enriched green tea on body composition. Obesity. 2010;18:773–779. doi: 10.1038/oby.2009.256. [DOI] [PubMed] [Google Scholar]
- 32.Stanhope KL, Havel PJ. Endocrine and metabolic effects of consuming beverages sweetened with fructose, glucose, sucrose, or high-fructose corn syrup. Am J Clin Nutr. 2008;88 doi: 10.3945/ajcn.2008.25825D. [DOI] [PMC free article] [PubMed] [Google Scholar]
- 33.Muramatsu K, Fukuyo M, Hara Y. Effect of green tea catechins on plasma cholesterol level in cholesterol-fed rats. J Nutr Sci Vitaminol. 1986;32:613–622. doi: 10.3177/jnsv.32.613. [DOI] [PubMed] [Google Scholar]
- 34.Grove KA, Lambert JD. Laboratory, epidemiological, and human intervention studies show that tea (Camellia sinensis) may be useful in the prevention of obesity. J Nutr. 2010;140:446–453. doi: 10.3945/jn.109.115972. [DOI] [PMC free article] [PubMed] [Google Scholar]
- 35.Galleano M, Calabro V, Prince PD, Litterio MC, et al. Flavonoids and metabolic syndrome. Ann N Y Acad Sci. 2012 doi: 10.1111/j.1749-6632.2012.06511.x. [DOI] [PubMed] [Google Scholar]
- 36.Babu PV, Liu D, Gilbert ER. Recent advances in understanding the anti-diabetic actions of dietary flavonoids. J Nutr Biochem. 2013;24:1777–1789. doi: 10.1016/j.jnutbio.2013.06.003. [DOI] [PMC free article] [PubMed] [Google Scholar]
- 37.Osborn O, Olefsky JM. The cellular and signaling networks linking the immune system and metabolism in disease. Nat Med. 2012;18:363–374. doi: 10.1038/nm.2627. [DOI] [PubMed] [Google Scholar]
- 38.Rajala MW, Qi Y, Patel HR, Takahashi N, et al. Regulation of resistin expression and circulating levels in obesity, diabetes, and fasting. Diabetes. 2004;53:1671–1679. doi: 10.2337/diabetes.53.7.1671. [DOI] [PubMed] [Google Scholar]
- 39.Menzaghi C, Bacci S, Salvemini L, Mendonca C, et al. Serum resistin, cardiovascular disease and all-cause mortality in patients with type 2 diabetes. PLoS One. 2013;8 doi: 10.1371/journal.pone.0064729. [DOI] [PMC free article] [PubMed] [Google Scholar]
- 40.Fukuhara A, Matsuda M, Nishizawa M, Segawa K, et al. Visfatin: a protein secreted by visceral fat that mimics the effects of insulin. Science. 2005;307:426–430. doi: 10.1126/science.1097243. [DOI] [PubMed] [Google Scholar]
- 41.Romacho T, Azcutia V, Vazquez-Bella M, Matesanz N, et al. Extracellular PBEF/NAMPT/visfatin activates pro-inflammatory signalling in human vascular smooth muscle cells through nicotinamide phosphoribosyltransferase activity. Diabetologia. 2009;52:2455–2463. doi: 10.1007/s00125-009-1509-2. [DOI] [PubMed] [Google Scholar]
- 42.Lim SY, Davidson SM, Paramanathan AJ, Smith CC, et al. The novel adipocytokine visfatin exerts direct cardioprotective effects. J Cell Mol Med. 2008;12:1395–1403. doi: 10.1111/j.1582-4934.2008.00332.x. [DOI] [PMC free article] [PubMed] [Google Scholar]
- 43.Hirosumi J, Tuncman G, Chang L, Gorgun CZ, et al. A central role for JNK in obesity and insulin resistance. Nature. 2002;420:333–336. doi: 10.1038/nature01137. [DOI] [PubMed] [Google Scholar]
- 44.Aguirre V, Uchida T, Yenush L, Davis R, White MF. The c-Jun NH(2)-terminal kinase promotes insulin resistance during association with insulin receptor substrate-1 and phosphorylation of Ser(307) J Biol Chem. 2000;275:9047–9054. doi: 10.1074/jbc.275.12.9047. [DOI] [PubMed] [Google Scholar]
- 45.Chuang CC, Martinez K, Xie G, Kennedy A, et al. Quercetin is equally or more effective than resveratrol in attenuating tumor necrosis factor-{alpha}-mediated inflammation and insulin resistance in primary human adipocytes. Am J Clin Nutr. 2010;92:1511–1521. doi: 10.3945/ajcn.2010.29807. [DOI] [PubMed] [Google Scholar]
- 46.Hotamisligil GS, Shargill NS, Spiegelman BM. Adipose expression of tumor necrosis factor-alpha: direct role in obesity-linked insulin resistance. Science. 1993;259:87–91. doi: 10.1126/science.7678183. [DOI] [PubMed] [Google Scholar]
- 47.Carvalho CR, Bueno AA, Mattos AM, Biz C, et al. Fructose alters adiponectin, haptoglobin and angiotensinogen gene expression in 3T3-L1 adipocytes. Nutr Res. 2010;30:644–649. doi: 10.1016/j.nutres.2010.06.012. [DOI] [PubMed] [Google Scholar]
- 48.Wellen KE, Hotamisligil GS. Inflammation, stress, and diabetes. J Clin Invest. 2005;115:1111–1119. doi: 10.1172/JCI25102. [DOI] [PMC free article] [PubMed] [Google Scholar]
- 49.Cho SY, Park PJ, Shin HJ, Kim YK, et al. (−)-Catechin suppresses expression of Kruppel-like factor 7 and increases expression and secretion of adiponectin protein in 3T3-L1 cells. Am J Physiol Endocrinol Metab. 2007;292:12. doi: 10.1152/ajpendo.00436.2006. [DOI] [PubMed] [Google Scholar]
- 50.Wang S, Moustaid-Moussa N, Chen L, Mo H, et al. Novel insights of dietary polyphenols and obesity. J Nutr Biochem. 2014;25:1–18. doi: 10.1016/j.jnutbio.2013.09.001. [DOI] [PMC free article] [PubMed] [Google Scholar]
- 51.Wein S, Behm N, Petersen RK, Kristiansen K, Wolffram S. Quercetin enhances adiponectin secretion by a PPAR-gamma independent mechanism. Eur J Pharm Sci. 2010;41:16–22. doi: 10.1016/j.ejps.2010.05.004. [DOI] [PubMed] [Google Scholar]
- 52.Pignatelli P, Pulcinelli FM, Celestini A, Lenti L, et al. The flavonoids quercetin and catechin synergistically inhibit platelet function by antagonizing the intracellular production of hydrogen peroxide. Am J Clin Nutr. 2000;72:1150–1155. doi: 10.1093/ajcn/72.5.1150. [DOI] [PubMed] [Google Scholar]
- 53.Redondo A, Estrella N, Lorenzo AG, Cruzado M, Castro C. Quercetin and catechin synergistically inhibit angiotensin II-induced redox-dependent signalling pathways in vascular smooth muscle cells from hypertensive rats. Free Radic Res. 2012;46:619–627. doi: 10.3109/10715762.2012.660527. [DOI] [PubMed] [Google Scholar]
- 54.Menendez C, Jimenez R, Moreno L, Galindo P, et al. Lack of synergistic interaction between quercetin and catechin in systemic and pulmonary vascular smooth muscle. Br J Nutr. 2011;105:1287–1293. doi: 10.1017/S0007114510004952. [DOI] [PubMed] [Google Scholar]
- 55.Delgado L, Fernandes I, Gonzalez-Manzano S, de Freitas V, et al. Anti-proliferative effects of quercetin and catechin metabolites. Food Funct. 2014;5:797–803. doi: 10.1039/c3fo60441a. [DOI] [PubMed] [Google Scholar]


