

Abstract
High adiposity in midlife might increase risk for late-life brain pathology, including dementia. Using data from the prospective Age, Gene/Environment Susceptibility-Reykjavik Study of men and women (born 1907–1935), we studied the associations of overweight and obesity at midlife (mean age, 50 (standard deviation, 4.7) years) with 1.5-T brain magnetic resonance imaging measures of infarct-like brain lesions, cerebral microbleeds, total brain volume, and white matter lesions volume, as well as dementia, in late life (mean age, 76 (standard deviation, 5.2) years). We used linear and Poisson models to estimate associations in 3,864 persons after adjustment for sociodemographic, health, and lifestyle characteristics. In midlife, the prevalence of overweight was 39% and that of obesity was 8%. After a mean follow-up of 26.2 (standard deviation, 4.9) years, midlife overweight and obesity were not associated with infarct-like brain lesions (relative risk (RR) = 0.82, 95% confidence interval (CI): 0.61, 1.10), cerebral microbleeds (RR = 0.69, 95% CI: 0.37, 1.32), total brain volume (β = 0.05, 95% CI: −0.34, 0.45), white matter lesions volume (β = −0.10, 95% CI: −0.20, 0.01), or dementia (RR = 0.91, 95% CI: 0.49, 1.72) compared with normal weight. These findings do not support the hypothesis that high body mass index in midlife modulates the risk for dementia.
Keywords: brain MRI, brain vascular lesions, cohort study, dementia, epidemiology, mortality, obesity
Dementia cannot be treated, and steep increases in prevalence are anticipated as the average age of the population increases (1). Primary prevention is key, but evidence on modifiable risk factors remains inconclusive (2). The rates of overweight and obesity are increasing to epidemic proportions worldwide, with the highest levels typically peaking in midlife (3). It is hypothesized that high adiposity might contribute to neurodegenerative and cerebrovascular changes through vascular and metabolic pathways (4). These changes underlie late-life dementia and are well-captured with brain imaging and postprocessing techniques that provide information on brain tissue volume, as well as small and large focal and diffuse vascular damage (5, 6).
Metabolic and vascular pathologic changes might start occurring in midlife or earlier, making it imperative to understand whether there is a link between high adiposity in midlife and late-life dementia. To date, epidemiologic evidence that midlife body mass index (BMI), a clinical measure of total adiposity, is a potential risk factor for subsequent dementia is mixed, with a positive association in some studies (7–9) and no association in others after accounting for potential confounders (10–14). Nevertheless, weight management has been suggested as one intervention to reduce the risk of dementia (4).
Investigating the association of BMI with markers of brain damage (e.g., brain structure volume and diffuse and focal vascular damage) that precede or are part of the clinical expression of dementia can provide important evidence about the association of BMI with dementia (5), but epidemiologic evidence is lacking. In the present article, we examined the association of BMI measured in midlife with markers of brain damage, such as brain atrophy and vascular disease, measured using magnetic resonance imaging (MRI) in late life. We also report on the association of BMI with dementia in this same cohort.
METHODS
Study population
Late-life data are from the baseline wave of the Age, Gene/Environment Susceptibility-Reykjavik (AGES-Reykjavik) Study, a follow-up of the Reykjavik Study initiated in 1967 by the Icelandic Heart Association to monitor the cardiovascular health of the Icelandic population. Both studies have been described previously (15, 16). Briefly, the Reykjavik Study cohort was identified by randomly sampling community-dwelling men and women who were born in 1907–1935 and lived in the Reykjavik area in 1967. In 2002, there were 11,549 participants of the Reykjavik Study who were still alive, and 7,995 were invited to participate in the follow-up AGES-Reykjavik Study (2002–2006). A total of 5,764 subjects were examined (the response rate to the AGES-Reykjavik Study was 72%).
Standard protocol approvals and patient consents
This study was approved (VSN00-063) by the National Bioethics Committee in Iceland and the Institutional Review Board of the Intramural Research Program of the National Institute on Aging. All participants provided written informed consent.
Midlife BMI
Weight (to the nearest 0.1 kg) and height (in centimeters) were measured using the same standardized methods throughout the Reykjavik Study. To center the measurement to midlife, we used the BMI (weight in kilograms divided by height in meters squared) taken closest to age 50 years (mean age, 49.9 (standard deviation, 4.7) years) and excluded participants who were older than 60 years of age (n = 289) at the time of measurement. For the analysis, we categorized BMI according to the World Health Organization criteria (BMI <18.5 was classified as underweight, BMI of 18.5–24.9 was classified as normal weight, BMI of 25–29.9 was classified as overweight; and BMI ≥30 was classified as obese).
Outcomes assessments
Markers of brain damage assessed via MRI
All participants in the late-life AGES-Reykjavik Study who had no contraindications were eligible for the MRI brain scans acquired on a study-dedicated 1.5-T Signa Twinspeed system (General Electric Medical Systems, Waukesha, Wisconsin). The image protocol, which has been described previously (17), included an axial T1-weighted 3D, T2*-weighted gradient echo type echo planar, a proton density T2-weighted fast spin echo, and a fluid attenuated inversion recovery sequence. Cerebrospinal fluid, gray matter, white matter, and white matter lesion volumes were segmented automatically with the AGES-Reykjavik Study algorithm, which has been described previously (18). Intracranial volume was calculated by summing all segmented areas. The percentage of total brain volume (TBV), a proxy measure of brain atrophy, was calculated as a percentage of the sum of gray matter, white matter, and white matter lesions volumes relative to the intracranial volume. The percentage of white matter lesion volume (WMLV) was also calculated relative to the intracranial volume and was log-transformed to obtain a normal distribution. A radiologist identified the presence of infarct-like brain lesions (BIs) and cerebral microbleeds (CMBs) by slice location, and trained radiographers further characterized the lesions. BIs were defined as defects in the brain parenchyma with associated hyperintensity on T2 and fluid-attenuated inversion recovery images with a maximal diameter of at least 4 mm. No size criterion was applied for BIs in the cerebellum or the brain stem or for BIs with cortical involvement (19). Focal areas of signal void within the brain parenchyma that were visible on T2* images and were smaller or not detectable on T2 images were identified as CMBs if they did not contain any other structure or were not bordering a parenchymal defect (20). Blind re-reading of 5% of all scans yielded intra-rater reliability scores of 0.9 and 1.0 for the detection of BIs and CMBs, respectively, and an average inter-rater reliability of 0.7 (Cohen's weighted κ) for both.
Dementia diagnosis
Dementia diagnosis was based on a 3-phase procedure that has been described previously (15). Briefly, the whole cohort was screened using the Mini-Mental State Examination (21) and the Digit Symbol Substitution test (22). Subjects with Mini-Mental State Examination scores of 23 or less or Digit Symbol Substitution test scores of 17 or less went on to phase 2, which included a comprehensive battery of neuropsychological tests. Subjects who received high positive scores on Trail Making Tests A and B (23) or the Rey Auditory Verbal Learning tests (24) went on to a third phase, which included a proxy interview and a neurologic examination. All relevant data were reviewed by a panel composed of a geriatrician, neurologist, neuroradiologist, and neuropsychologist who reached a clinical consensus diagnosis based on international criteria from the Diagnostic and Statistical Manual of Mental Disorders, Fourth Edition (25).
Covariates
We considered covariates and confounders previously found to be associated with BMI, dementia, or brain measures (13, 26). Measurements from the original Reykjavik Study (midlife) included age, educational level (primary school, secondary school, college, or university), moderate/vigorous physical activity (5 hours per week or more), systolic and diastolic blood pressures, and total serum cholesterol. Measurements from the AGES-Reykjavik Study (late life) included years since midlife assessment, presence of the Apolipoprotein E ε4 allele, drinking and smoking status (never, former, or current), total serum cholesterol, coronary artery calcium measured in Agatston units using computed tomography, presence of coronary heart disease (Rose Angina Questionnaire (27) or electrocardiographic evidence of myocardial infarction), hypertension (systolic blood pressure ≥140 mm Hg, diastolic blood pressure ≥90 mm Hg, or self-reported clinical diagnosis or use of antihypertensive medications), diabetes (fasting blood glucose level >7 mmol/L, use of glucose-lowering medications, or self-reported clinical diagnosis), and depressive symptomatology based on the 15-point version of the Geriatric Depression Scale (the cutoff for depression was ≥6) (28).
Statistical analysis
Of the 5,764 participants included in the AGES-Reykjavik Study, we excluded those without a midlife BMI measure (n = 314) and, because of small numbers, those who were underweight at midlife (n = 56). Of the 5,394 remaining participants, those who did not have complete brain MRI data (n = 1,043), a dementia diagnosis (n = 42), or complete data for all covariates (n = 445) were further excluded. Most subjects who were missing covariate data (n = 364) did not have data on midlife physical activity level and late-life Geriatric Depression Scale variables. The remaining 3,864 subjects (1,656 men and 2,208 women; 67% of the eligible sample) had complete data for all variables of interest and formed our analytic sample (Figure 1). Compared with the participants who were excluded (n = 1,900), participants who were included were significantly younger at the midlife assessment (P < 0.001) and had a better cardiovascular risk profile. All analyses were carried out using STATA, version 12 (StataCorp LP, College Station, Texas), with data on men and women combined (9).
Figure 1.
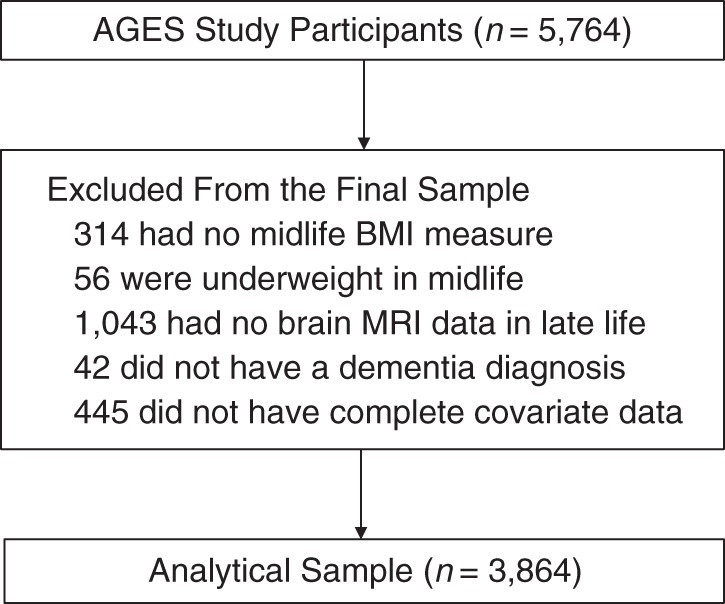
Derivation of the analytic sample, the Age, Gene/Environment Susceptibility-Reykjavik Study, 1967–2006. BMI, body mass index; MRI, magnetic resonance imaging.
We compared participants’ characteristics across BMI categories using analysis of variance and χ2 tests, and we calculated Spearman's correlations (at a 0.05 significance level) among MRI measures. We dichotomized BI and CMB into categories of either 0 or 1 defect (null or very minimal focal damage) or 2 or more defects after preliminary analyses confirmed that persons with no lesions and those with 1 lesion had similar risks. In the main analyses, we used the World Health Organization BMI categories in Poisson models with robust 95% confidence intervals for BI and CMB (dichotomous) outcomes and in multivariate linear regression models for the percentage of TBV and the log of percentage of WMLV (β coefficients for the latter were back-transformed). Participants who had normal-weight BMIs served as the reference group. In addition, using Poisson and linear regression models, we examined the associations of brain MRI measures and dementia with the continuous measure of BMI, and we formally tested for departures from linearity by including the BMI quadratic terms in the models.
Three models were estimated. In model 1, we adjusted for age in midlife, sex, intracranial volume, and number of follow-up years; in model 2, we adjusted for the variables in model 1 and the presence of the Apolipoprotein E ε4 allele, educational level, and midlife physical activity level and cardiovascular risk factors; and in model 3, we adjusted for the variables in model 2 with the addition of drinking and smoking habits and health characteristics measured in late life. The association between midlife BMI and dementia was assessed using Poisson models with the same adjustments. Model 3 was further adjusted for BI in regression models of the percentage of TBV and for BI and percentage of WMLV in dementia models.
In sensitivity analyses, we checked the effect modification by sex (9), age at midlife (≤50 vs. >50 years of age) (11), and presence of the Apolipoprotein E ε4 allele (29). To explore the robustness of our models, we repeated the analysis for the MRI outcomes after excluding cases with dementia. We also ran an analysis of the association of BMI with dementia using the larger sample for whom we had complete BMI and dementia data (n = 4,478 vs. n = 3,864 for the analytical sample), that is, including those previously excluded because of missing covariate MRI data. Finally, we formally tested the influence of attrition-related selection bias on the association of midlife overweight and obesity with late-life brain measures and dementia.
Taking full advantage of mid- to late-life mortality data from the Reykjavik Study (i.e., before the AGES-Reykjavik Study examination), we explored potential differential survival by midlife BMI level, which could explain the absence or presence of a BMI association with dementia and/or brain damage (12). Specifically, we re-ran our main models using inverse probability of censoring weighting (i.e., the probability of being included in the analytic sample) that was calculated based on mid- and late-life relevant covariates. In weighted models, participants with characteristics associated with a lower probability of being included in the analytic sample are assigned larger weights to “compensate” for being under-represented, thus accounting for potential selection bias due to attrition (30).
RESULTS
There was an average of 26.2 (standard deviation, 4.8) years (range, 12–38 years) between the mid- and late-life measurements. At midlife, 39% (n = 1,504) of the sample was overweight and 8% (n = 314) was obese. Participants grouped by midlife BMI categories differed across a number of factors (Table 1). In general, compared with overweight and obese subjects, those with BMIs in the normal-weight range were younger and slightly more educated and had lower mean cholesterol levels and lower blood pressure in midlife. In late life, compared to heavier participants, those with BMIs in the normal-weight range had a lower prevalence of CHD and more favorable CVD risk factor profile and were more likely to be current smokers and alcohol drinkers (Table 1). The prevalence of having had 2 or more BIs was 14.9% and that of having had 2 or more CBMs was 4.3%. The prevalence of dementia was 4.9%, the mean percentage of TBV was 72.1, and the mean percentage of WMLV in late life was 1.3. All MRI measures were significantly correlated (all Spearman's r < 0.25; P < 0.05).
Table 1.
Demographic and Health Characteristics of the Cohort at Midlife and Late Life (n = 3,864), AGES-Reykjavik Study, 1967–2006
| Characteristic | Weight Categorya |
||||||||
|---|---|---|---|---|---|---|---|---|---|
| Normal Weight (n = 2,046) |
Overweight (n = 1,504) |
Obese (n = 314) |
|||||||
| Mean (SD) | No. | % | Mean (SD) | No. | % | Mean (SD) | No. | % | |
| No. of follow-up years | 26.5 (4.7) | 26.2 (4.9) | 24.8 (5.2) | ||||||
| APOE ε4 allele carriers | 595 | 29.1 | 423 | 28.1 | 77 | 24.5 | |||
| Educational level | |||||||||
| Primary school | 461 | 22.5 | 341 | 22.7 | 88 | 28.0 | |||
| Secondary school | 996 | 48.7 | 767 | 51.0 | 161 | 51.3 | |||
| College | 351 | 17.2 | 222 | 14.8 | 38 | 12.1 | |||
| University | 238 | 11.6 | 174 | 11.6 | 27 | 8.6 | |||
| Midlife measures | |||||||||
| Age, years | 49.4 (4.8) | 50.1 (4.7) | 51 (4.4) | ||||||
| Physically activeb | 428 | 20.9 | 285 | 19.0 | 55 | 17.5 | |||
| Systolic BP, mm Hg | 128.4 (15.4) | 134.5 (16.3) | 140.1 (19.2) | ||||||
| Diastolic BP, mm Hg | 81.2 (8.8) | 85.6 (9.4) | 87.8 (10.8) | ||||||
| Cholesterol, mg/dL | 242.4 (42.3) | 247.6 (43.2) | 243.2 (39.4) | ||||||
| Late-life measures | |||||||||
| Age, years | 75.9 (5.2) | 76.3 (5.2) | 75.8 (4.9) | ||||||
| Prevalent CHD | 358 | 17.5 | 380 | 25.3 | 66 | 21.0 | |||
| Type 2 diabetes | 132 | 6.5 | 225 | 15.0 | 75 | 23.9 | |||
| CAC, Agatston units | 0.6 | 0.9 | 0.8 | 1.2 | 0.9 | 1.4 | |||
| Hypertension | 1555 | 76.0 | 1263 | 84.0 | 278 | 88.5 | |||
| Cholesterol, mg/dL | 222.2 (44.6) | 212.3 (44.5) | 208.3 (41.6) | ||||||
| Depression | 145 | 7.1 | 99 | 6.6 | 22 | 7.0 | |||
| Smoking status | |||||||||
| Never smoker | 855 | 41.8 | 633 | 42.1 | 151 | 48.1 | |||
| Former smoker | 910 | 44.5 | 727 | 48.3 | 128 | 40.8 | |||
| Current smoker | 281 | 13.7 | 144 | 9.6 | 35 | 11.2 | |||
| Drinking status | |||||||||
| Abstainer | 413 | 20.2 | 339 | 22.5 | 95 | 30.3 | |||
| Former drinker | 223 | 10.9 | 199 | 13.2 | 39 | 12.4 | |||
| Current drinker | 1410 | 68.9 | 966 | 64.2 | 180 | 57.3 | |||
Abbreviations: APOE, apolipoprotein E; BP, blood pressure; CAC, coronary artery calcium; CHD, coronary heart disease; SD, standard deviation.
a Normal weight was defined as a body mass index (measured as weight in kilograms divided by height in meters squared) of 18.5–24.9; overweight was defined as a body mass index of 25–29.9; and obese was defined as a body mass index ≥30.
b Physically active subjects were those who reported 5 hours or more of exercise per week.
Associations of overweight and obesity in midlife with CMB, BI, percentage of TBV, and percentage of WMLV were not significant (Table 2 and Figures 2 and 3). Compared with being normal weight, being overweight (relative risk (RR) = 1.22; 95% confidence interval (CI): 0.92, 1.63) or obese (RR = 0.91; 95% CI: 0.49, 1.72) at midlife was also not significantly associated with dementia in the unadjusted or fully adjusted models (Table 2 and Figure 2). Associations were also not significant before or after adjustment when we entered the continuous BMI variable into the model (for dementia, RR = 1.27, 95% CI: 0.89, 1.81; for BI, RR =1.17, 95% CI: 0.92, 1.50; for CMB, RR = 1.16, 95% CI: 0.75, 1.79; and for percentage of WMLV, β = −0.04, 95% CI: −0.12, 0.03) (fully adjusted estimates) (Table 2). The relationship between BMI and percentage of TBV was not linear (for the BMI quadratic term in the model, P < 0.024), and graphical inspection confirmed a polynomial relationship (β = 0.29, 95% CI: 0.03, 0.56), which is interpreted in the categorical analysis (Table 2).
Table 2.
Associations of Midlife Overweight and Obesity With Measures of Brain Structure and Vascular Damage Assessed via Magnetic Resonance Imaging 26 Years Later in Late Life (n = 3,864), the AGES-Reykjavik Study, 1967–2006
| Model and Weight Categorya | % TBV |
% WMLV |
BI |
CMB |
Dementia |
|||||||
|---|---|---|---|---|---|---|---|---|---|---|---|---|
| Meanb (SE) | βc | 95% CI | Meanb (SE) | βc | 95% CI | RRd | 95% CI | RRd | 95% CI | RRd | 95% CI | |
| Model 1e | ||||||||||||
| Normal weight | 72.19 (0.07) | 0.92 (0.02) | 1.00 | Referent | 1.00 | Referent | 1.00 | Referent | ||||
| Overweight | 72.10 (0.06) | 0.90 (0.02) | 1.21 | 1.04, 1.41 | 1.04 | 0.76, 1.41 | 1.24 | 0.93, 1.65 | ||||
| Obese | 72.02 (0.13) | 0.89 (0.03) | 1.06 | 0.79, 1.41 | 0.90 | 0.50, 1.62 | 0.86 | 0.46, 1.59 | ||||
| BMI, continuous | 0.29 | 0.03, 0.56 | −0.02 | −0.09, 0.04 | 1.21 | 0.95, 1.55 | 1.20 | 0.78, 1.84 | 1.27 | 0.9, 1.79 | ||
| Model 2f | ||||||||||||
| Normal weight | 72.14 (−0.07) | 0.93 (0.02) | 1.00 | Referent | 1.00 | Referent | 1.00 | Referent | ||||
| Overweight | 72.14 (0.06) | 0.89 (0.02) | 1.16 | 0.99, 1.36 | 0.98 | 0.72, 1.33 | 1.23 | 0.92, 1.64 | ||||
| Obese | 72.13 (0.13) | 0.86 (0.03) | 0.97 | 0.72, 1.29 | 0.82 | 0.44, 1.50 | 0.85 | 0.46, 1.57 | ||||
| BMI, continuous | 1.13 | −0.38, 2.64 | −0.04 | −0.11, 0.03 | 1.20 | 0.95, 1.53 | 1.17 | 0.77, 1.79 | 1.26 | 0.89, 1.78 | ||
| Model 3g | ||||||||||||
| Normal weight | 72.11 (0.07) | 0.94 (0.02) | 1.00 | Referent | 1.00 | Referent | 1.00 | Referent | ||||
| Overweight | 72.17 (0.06) | 0.89 (0.02) | 1.08 | 0.92, 1.27 | 0.91 | 0.67, 1.25 | 1.22 | 0.92, 1.63 | ||||
| Obese | 72.22 (0.13) | 0.84 (0.03) | 0.82 | 0.61, 1.10 | 0.69 | 0.37, 1.32 | 0.91 | 0.49, 1.72 | ||||
| BMI, continuous | 0.90 | −0.58, 2.38 | −0.04 | −0.11, 0.03 | 1.17 | 0.92, 1.50 | 1.16 | 0.75, 1.79 | 1.27 | 0.89, 1.81 | ||
Abbreviations: BI, infarct-like brain lesion; BMI, body mass index; CI, confidence interval; CMB, cerebral microbleed; RR, relative risks; SE, standard error; TBV, total brain volume; WMLV, white matter lesions volume.
a Normal weight was defined as a body mass index (measured as weight in kilograms divided by height in meters squared) of 18.5–24.9; overweight was defined as a body mass index of 25–29.9; and obese was defined as a body mass index ≥30.
b Mean of brain volumes were adjusted for intracranial volume and for the covariates included in models.
c β coefficients from linear regression models of percentage of TBV and percentage of WMLV per unit difference in body mass index.
d Relative risks representing the risk of ≥2 BIs, ≥2 CMBs, and dementia from Poisson models with robust 95% confidence intervals.
e Model 1 was adjusted for sex, age in midlife, no. of years of follow-up, and intracranial volume.
f Model 2 was adjusted for the variables in model 1 and Apolipoprotein ε4 allele, educational level, physical activity level, systolic and diastolic blood pressures, and serum cholesterol level in midlife.
g Model 3 was adjusted for the variables in model 2 and coronary artery calcium, prevalent coronary heart disease, hypertension, diabetes, and depression, alcohol drinking status, and smoking habits in late life. The models for percentage of TBV were further adjusted for BI, and the models for dementia were also adjusted for percentage of WMLV.
Figure 2.
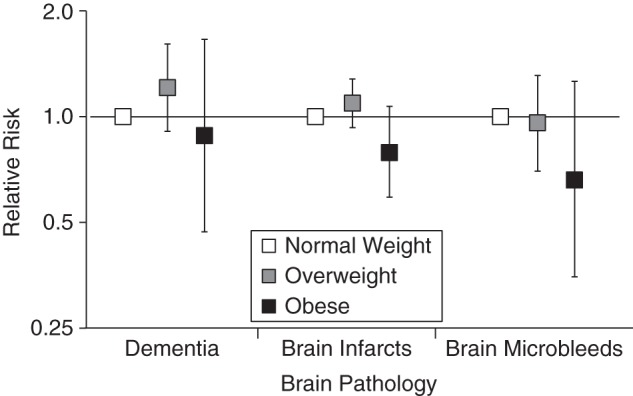
Relative risks of dementia, brain infarcts, and brain microbleeds by midlife by body mass index (weight in kilograms divided by height in meters squared; BMI), the Age, Gene/Environment Susceptibility-Reykjavik Study, 1967–2006 (n = 3,864). Relative risks (on an arithmetic scale) for overweight (BMI of 25–29.9) and obese (BMI ≥30) participants were compared with those of normal-weight (BMI 18.5–24.9) participants using Poisson models that were adjusted for sex, age in midlife, number of follow-up years, presence of the Apolipoprotein ε4 allele, educational level, intracranial volume, physical activity level, systolic and diastolic blood pressures, and serum cholesterol level in midlife and for coronary artery calcium, prevalent coronary heart disease, hypertension, diabetes, depression, and drinking and smoking habits in late life. The models for dementia were further adjusted for brain infarcts and percentage of white matter lesion volume. Bars, 95% confidence intervals.
Figure 3.
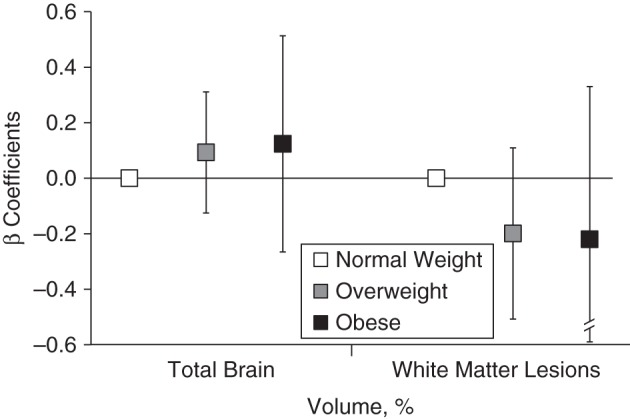
Associations of midlife overweight, obesity, and normal weight with total brain volume and white matter lesion volume relative to intracranial volume, the Age, Gene/Environment Susceptibility-Reykjavik Study, 1967–2006 (n = 3,864). β coefficients represent the unit changes in percentage of total brain volume and percentage of white matter lesion volume for overweight (body mass index (weight (kg)/height (m)2 of 25–29.9) and obese (body mass index ≥30) participants compared with normal weight (body mass index of 18.5–24.9) participants from multivariate linear regression models that were adjusted for sex, age in midlife, number of follow-up years, Apolipoprotein ε4 allele, educational level, intracranial volume, physical activity level, systolic and diastolic blood pressure, and serum cholesterol level in midlife and for coronary artery calcium, prevalent coronary heart disease, hypertension, diabetes, depression, and drinking and smoking status in late life. The models for percentage of total brain volume are further adjusted for infarct-like brain lesions. Bars, 95% confidence intervals.
In the larger sample that included persons with missing MRI data, we found that compared to normal weight, the relative risk of dementia was 1.16 (95% CI: 0.89, 1.53) for midlife overweight and 0.92 (95% CI: 0.54, 1.58) for obesity in the fully adjusted models. No results were modified by age in midlife (≤50 vs. >50 years of age), the presence of the Apolipoprotein E ε4 allele, or sex (all P for interaction > 0.11). Results for associations of BMI with the markers of brain damage assessed via MRI were unchanged after the exclusion of participants with dementia (n = 188; results not shown).
Finally, we found the mortality rates before the start of the AGES- Reykjavik Study (2002) increased with increasing BMI, from 36% in normal-weight participants to 45% in participants who were obese (Web Table 1, available at http://aje.oxfordjournals.org/). However, when we accounted for potential selection bias by adding inverse probability weights to our models, all results remained unchanged (Web Table 2).
DISCUSSION
In a large population-based sample of men and women, we found that being overweight or obese in midlife was not significantly associated with lower total brain volume, focal brain vascular damage, or dementia. These results were robust to advanced alternative model specifications in our sensitivity analyses.
Strengths of the study include the large, well-described cohort; the availability of mid- and late-life data, including standardized height and weight measures; clinical measures and information on potential confounders measured both in midlife and late life; MRI measures of percentage of TBV and percentage of WMLV obtained using a previously validated automated segmentation algorithm (18); standardized criteria for diagnosing BIs and CMBs; dementia diagnosis established through clinical consensus; mortality data on the total original cohort; and formal correction for potential selective attrition.
Several issues related to the interpretation of our findings should be noted. Central rather than overall adiposity might be a more valid indicator of the resultant metabolic changes (12, 31), but those measures were not taken at the midlife examination. However, BMI is widely used in adults to reliably capture both total and central adiposity (32). Further, we investigated the percentage of TBV as measure of global brain atrophy by inferring it from cross-sectional data. It is possible that a high BMI could have specific localized effects on smaller regional brain volumes, for instance hippocampal volume (26). Hypothesis-generating follow-up studies are needed to assess this issue. We took several steps to investigate whether bias from selective participant loss might have influenced our results. Participation rates were higher and mortality rates were lower in normal-weight participants than in those who were overweight or obese in midlife. Further, compared with participants who were excluded, those in the analytic sample had a slightly better cardiovascular risk profile. However, to affect the study conclusions, survival bias would have to be in the direction of missing data on obese participants with a lower risk of dementia and brain damage, and this is likely minimal or unlikely.
Within the analytic sample, overweight and obese participants had significantly worse mid- and late-life cardiovascular risk factor profiles for mortality and brain damage than normal-weight participants (including higher blood pressure and higher rates of diabetes). When those variables were included in the models, their effect was very modest. Moreover, our results did not change when we applied inverse probability weighting to our models to formally account for the potential influence of selective attrition on the association of midlife overweight and obesity with dementia and brain damage. Further, results were unchanged for dementia when participants with missing MRI data were included in the sample. However, these additional analyses cannot completely account for the selected attrition. Across the categories of BMI and brain outcomes, there is a small but relatively consistent tendency for obese participants to have less risk for cerebral vascular pathology than overweight or normal-weight participants. Persons with a high BMI and low vascular disease burden might have a different risk for cardiovascular disease–related outcomes or other outcomes also associated with cerebral lesions.
Prospective evidence of the association of midlife BMI with brain atrophy and brain vascular damage (the structural changes underlying dementia) in late life is patchy. Our mid- to late-life prospective analyses of brain structural measures assessed via MRI (including brain atrophy and both focal (BI and CMB) and diffuse (WMLV) vascular damage), dementia, and mortality in a single population-based study have not been reported elsewhere. In addition, no prior studies on the association of overweight and obesity in midlife with dementia have formally accounted for the potential influence of selective attrition.
In a younger cohort, associations of midlife BMI with structural brain measures assessed via MRI were not significant after controlling for covariates comparable to the ones that we considered in the present study (26). In a smaller sample of relatively healthy older adults, neither central nor global midlife obesity was associated with brain atrophy, and measures of vascular brain damage were not available (33). Recently, in a meta-analysis, Anstey et al. (34) suggested that there was a positive association between BMI and dementia risk. However, those results were largely driven by 2 large studies that relied upon available medical records to ascertain dementia. This might have introduced bias. Higher BMI is plausibly associated with greater morbidity and higher rates of hospitalization; therefore, dementia detection among participants who were leaner might have been lower because of less frequent health care use (8, 35). Moreover, there might be issues related to residual confounding and measurement bias in studies in which investigators did not adjust for education level (8) or when BMI calculations are based on self-reported height and weight (7). Further, not included in the meta-analysis were 3 studies that found no significant association between overweight and obesity measured in midlife and dementia in late life after adjustment for sociodemographic and health characteristics (12–14). Our results on the lack of a significant association of midlife overweight and obesity with dementia are consistent with those of studies that accounted for similar potential confounders (10–14), and the prevalence of midlife overweight and obesity in the present study did not differ from those observed in samples from previous studies (7–14).
It is biologically possible that excess adipose tissue plays a role in the long-term development of cerebral diseases. Mechanisms might include insulin resistance, glucose intolerance, and diabetes; adipocyte-produced hormones and proinflammatory cytokines (i.e., tumor necrosis factor-α and interleukin-6); and vascular risk factors and diseases (4). Moreover, the association of the risk variant of the fat mass and obesity-associated protein (FTO) gene with reduced brain volume but not with diffuse cerebrovascular damage (which is consistent with our findings on percentage of WMLV) provides indirect evidence of a possible unfavorable effect of high adiposity on the brain in late life (36). Nevertheless, other studies suggest that there are mechanisms that support a more complex association. For example, there might be neuropathological changes in the brain that build up several years before the clinical onset of dementia and might be associated with weight loss decades before old age (37). In recent studies, a reduced risk of dementia has been reported with increasing levels of leptin (38, 39), a cytokine that is produced in the adipose tissue and known to enhance cognitive function and to exert neuroprotective effects (40). In this context, our results are consistent with a recent hypothesis, which posits that the association of obesity with dementia and brain damage could be largely confounded by genotype and life circumstances that may influence lifelong adiposity levels and vascular risk profile, as well as late-life cognitive ability and neuropathology (41).
The identification of modifiable factors on the pathway to dementia is key for prevention. Our results suggest that a clinical marker of high total adiposity in midlife might not be associated with a higher risk of brain pathology and dementia at a later age. Therefore, weight management interventions might not be effective for prevention of dementia. Nevertheless, the maintenance of a healthy body weight should be encouraged because excess body weight is associated with poorer health.
Supplementary Material
ACKNOWLEDGMENTS
Authors affiliations: Laboratory of Epidemiology and Population Sciences, National Institute on Aging, National Institutes of Health, Bethesda, Maryland (Emiliano Albanese, Benjamin Davis, Melissa Garcia, Tamara Harris, Lenore J. Launer); Department of Mental Health and Psychiatry, University Hospitals of Geneva, Geneva, Switzerland (Emiliano Albanese); Faculty of Medicine, University of Geneva, Geneva, Switzerland (Emiliano Albanese); Department of Geriatrics, Landspitali National University Hospital, Landspitali University Hospital, Reykjavik, Iceland (Palmi V. Jonsson); Faculty of Medicine, University of Iceland, Reykjavik, Iceland (Palmi V. Jonsson, Thor Aspelund, Vilmundur Gudnason); Geriatric Research Center, Landspitali University Hospital, Reykjavik, Iceland (Milan Chang); and Icelandic Heart Association, Kopavogur, Iceland (Thor Aspelund, Vilmundur Gudnason).
This study was funded by the National Institutes of Health (contract N01-AG-12100), the National Institute on Aging Intramural Research Program, the Icelandic Heart Association, and the Icelandic Parliament.
We thank the Icelandic Heart Association clinic staff for their invaluable contribution.
The funding source had no role in the design of the study; analysis and interpretation of the data; preparation, review, or approval of the manuscript; or decision to submit the manuscript for publication.
Conflict of interest: none declared.
REFERENCES
- 1.Prince M, Bryce R, Albanese E, et al. The global prevalence of dementia: a systematic review and metaanalysis. Alzheimers Dement. 2013;91:63–75.e2. [DOI] [PubMed] [Google Scholar]
- 2.Daviglus ML, Bell CC, Berrettini W, et al. NIH state-of-the-science conference statement: preventing Alzheimer's disease and cognitive decline. NIH Consens State Sci Statements. 2010;274:1–30. [PubMed] [Google Scholar]
- 3.Finucane MM, Stevens GA, Cowan MJ, et al. National, regional, and global trends in body-mass index since 1980: systematic analysis of health examination surveys and epidemiological studies with 960 country-years and 9.1 million participants. Lancet. 2011;3779765:557–567. [DOI] [PMC free article] [PubMed] [Google Scholar]
- 4.Luchsinger JA, Gustafson DR. Adiposity and Alzheimer's disease. Curr Opin Clin Nutr Metab Care. 2009;121:15–21. [DOI] [PMC free article] [PubMed] [Google Scholar]
- 5.Jagust W. What can imaging reveal about obesity and the brain? Curr Alzheimer Res. 2007;42:135–139. [DOI] [PubMed] [Google Scholar]
- 6.Jagust WJ, Zheng L, Harvey DJ, et al. Neuropathological basis of magnetic resonance images in aging and dementia. Ann Neurol. 2008;631:72–80. [DOI] [PMC free article] [PubMed] [Google Scholar]
- 7.Hassing LB, Dahl AK, Thorvaldsson V, et al. Overweight in midlife and risk of dementia: a 40-year follow-up study. Int J Obes (Lond). 2009;338:893–898. [DOI] [PMC free article] [PubMed] [Google Scholar]
- 8.Rosengren A, Skoog I, Gustafson D, et al. Body mass index, other cardiovascular risk factors, and hospitalization for dementia. Arch Intern Med. 2005;1653:321–326. [DOI] [PubMed] [Google Scholar]
- 9.Whitmer RA, Gunderson EP, Barrett-Connor E, et al. Obesity in middle age and future risk of dementia: a 27 year longitudinal population based study. BMJ. 2005;3307504:1360. [DOI] [PMC free article] [PubMed] [Google Scholar]
- 10.Beydoun MA, Lhotsky A, Wang Y, et al. Association of adiposity status and changes in early to mid-adulthood with incidence of Alzheimer's disease. Am J Epidemiol. 2008;16810:1179–1189. [DOI] [PMC free article] [PubMed] [Google Scholar]
- 11.Fitzpatrick AL, Kuller LH, Lopez OL, et al. Midlife and late-life obesity and the risk of dementia: cardiovascular health study. Arch Neurol. 2009;663:336–342. [DOI] [PMC free article] [PubMed] [Google Scholar]
- 12.Gustafson DR, Backman K, Waern M, et al. Adiposity indicators and dementia over 32 years in Sweden. Neurology. 2009;7319:1559–1566. [DOI] [PMC free article] [PubMed] [Google Scholar]
- 13.Kivipelto M, Ngandu T, Fratiglioni L, et al. Obesity and vascular risk factors at midlife and the risk of dementia and Alzheimer disease. Arch Neurol. 2005;6210:1556–1560. [DOI] [PubMed] [Google Scholar]
- 14.Tolppanen AM, Ngandu T, Kåreholt I, et al. Midlife and late-life body mass index and late-life dementia: results from a prospective population-based cohort. J Alzheimers Dis. 2014;381:201–209. [DOI] [PubMed] [Google Scholar]
- 15.Harris TB, Launer LJ, Eiriksdottir G, et al. Age, Gene/Environment Susceptibility-Reykjavik Study: multidisciplinary applied phenomics. Am J Epidemiol. 2007;1659:1076–1087. [DOI] [PMC free article] [PubMed] [Google Scholar]
- 16.Sigurdsson E, Thorgeirsson G, Sigvaldason H, et al. Prevalence of coronary heart disease in Icelandic men 1968–1986. The Reykjavik Study. Eur Heart J. 1993;145:584–591. [DOI] [PubMed] [Google Scholar]
- 17.Sigurdsson S, Aspelund T, Forsberg L, et al. Brain tissue volumes in the general population of the elderly: the AGES-Reykjavik. Neuroimage. 2012;594:3862–3870. [DOI] [PMC free article] [PubMed] [Google Scholar]
- 18.Zijdenbos AP, Forghani R, Evans AC. Automatic “pipeline” analysis of 3-D MRI data for clinical trials: application to multiple sclerosis. IEEE Trans Med Imaging. 2002;2110:1280–1291. [DOI] [PubMed] [Google Scholar]
- 19.Vidal JS, Sigurdsson S, Jonsdottir MK, et al. Coronary artery calcium, brain function and structure: the AGES-Reykjavik Study. Stroke. 2010;415:891–897. [DOI] [PMC free article] [PubMed] [Google Scholar]
- 20.Sveinbjornsdottir S, Sigurdsson S, Aspelund T, et al. Cerebral microbleeds in the population based AGES-Reykjavik: prevalence and location. J Neurol Neurosurg Psychiatry. 2008;799:1002–1006. [DOI] [PMC free article] [PubMed] [Google Scholar]
- 21.Folstein MF, Folstein SE, McHugh PR. “Mini-mental state”. A practical method for grading the cognitive state of patients for the clinician. J Psychiatr Res. 1975;123:189–198. [DOI] [PubMed] [Google Scholar]
- 22.Weschler D, ed. Administration and Scoring Manual for the Weschler Adult Intelligence Scale-III. London, UK: Psychological Corporation; 2008. [Google Scholar]
- 23.Reitan RM, Wolfson D. The Halstead-Reitan Neuropsychological Test Battery: Theory and Clinical Interpretation. Tucson, AZ: Neuropsychology Press; 1993. [Google Scholar]
- 24.Rey A. L'examen Clinique en Psychologie. Paris, France: Presses Universitaires de France; 1964. [Google Scholar]
- 25.American Psychiatric Association. Diagnostic and Statistical Manual of Mental Disorders, Fourth Edition. Washington, DC: American Psychiatric Association; 1994. [Google Scholar]
- 26.Debette S, Seshadri S, Beiser A, et al. Midlife vascular risk factor exposure accelerates structural brain aging and cognitive decline. Neurology. 2011;775:461–468. [DOI] [PMC free article] [PubMed] [Google Scholar]
- 27.Rose GA. The diagnosis of ischaemic heart pain and intermittent claudication in field surveys. Bull World Health Organ. 1962;27:645–658. [PMC free article] [PubMed] [Google Scholar]
- 28.Yesavage JA, Brink TL, Rose TL, et al. Development and validation of a geriatric depression screening scale: a preliminary report. J Psychiatr Res. 1982;171:37–49. [DOI] [PubMed] [Google Scholar]
- 29.Keller L, Xu W, Wang HX, et al. The obesity related gene, FTO, interacts with APOE, and is associated with Alzheimer's disease risk: a prospective cohort study. J Alzheimers Dis. 2011;233:461–469. [DOI] [PubMed] [Google Scholar]
- 30.Weuve J, Tchetgen Tchetgen EJ, Glymour MM, et al. Accounting for bias due to selective attrition: the example of smoking and cognitive decline. Epidemiology. 2012;231:119–128. [DOI] [PMC free article] [PubMed] [Google Scholar]
- 31.Whitmer RA, Gustafson DR, Barrett-Connor E, et al. Central obesity and increased risk of dementia more than three decades later. Neurology. 2008;7114:1057–1064. [DOI] [PubMed] [Google Scholar]
- 32.Taylor RW, Keil D, Gold EJ, et al. Body mass index, waist girth, and waist-to-hip ratio as indexes of total and regional adiposity in women: evaluation using receiver operating characteristic curves. Am J Clin Nutr. 1998;671:44–49. [DOI] [PubMed] [Google Scholar]
- 33.Driscoll I, Beydoun MA, An Y, et al. Midlife obesity and trajectories of brain volume changes in older adults. Hum Brain Mapp. 2012;339:2204–2210. [DOI] [PMC free article] [PubMed] [Google Scholar]
- 34.Anstey KJ, Cherbuin N, Budge M, et al. Body mass index in midlife and late-life as a risk factor for dementia: a meta-analysis of prospective studies. Obes Rev. 2011;125:e426–e437. [DOI] [PubMed] [Google Scholar]
- 35.Whitmer RA, Gunderson EP, Quesenberry CP, Jr, et al. Body mass index in midlife and risk of Alzheimer disease and vascular dementia. Curr Alzheimer Res. 2007;42:103–109. [DOI] [PubMed] [Google Scholar]
- 36.Ho AJ, Stein JL, Hua X, et al. A commonly carried allele of the obesity-related FTO gene is associated with reduced brain volume in the healthy elderly. Proc Natl Acad Sci U S A. 2010;10718:8404–8409. [DOI] [PMC free article] [PubMed] [Google Scholar]
- 37.Stewart R, Masaki K, Xue QL, et al. A 32-year prospective study of change in body weight and incident dementia: the Honolulu-Asia Aging Study. Arch Neurol. 2005;621:55–60. [DOI] [PubMed] [Google Scholar]
- 38.Lieb W, Beiser AS, Vasan RS, et al. Association of plasma leptin levels with incident Alzheimer disease and MRI measures of brain aging. JAMA. 2009;30223:2565–2572. [DOI] [PMC free article] [PubMed] [Google Scholar]
- 39.Gustafson DR, Bäckman K, Lissner L, et al. Leptin and dementia over 32 years-The Prospective Population Study of Women. Alzheimers Dement. 2012;84:272–277. [DOI] [PubMed] [Google Scholar]
- 40.Holden KF, Lindquist K, Tylavsky FA, et al. Serum leptin level and cognition in the elderly: findings from the Health ABC Study. Neurobiol Aging. 2009;309:1483–1489. [DOI] [PMC free article] [PubMed] [Google Scholar]
- 41.Corley J, Gow AJ, Starr JM, et al. Is body mass index in old age related to cognitive abilities? The Lothian Birth Cohort 1936 Study. Psychol Aging. 2010;254:867–875. [DOI] [PubMed] [Google Scholar]
Associated Data
This section collects any data citations, data availability statements, or supplementary materials included in this article.