Abstract
Anemia, a condition characterized by insufficient hemoglobin, affects 56.2% of pregnant women and 66.1% of children under five in low-resource countries. Though hemoglobin concentration measurement is the most common laboratory test in the world, the high cost of disposables (>$1.00 per test in Malawi) limits its availability in these settings. We have demonstrated a spectrophotometric method that reduces the per-test cost of anemia diagnosis to under $0.01 by using chromatography paper as the only disposable. Improvements in the hand-held reader, including using laser modules and a reference photodiode, enabled repeatable results within and across devices. We evaluated this method by analyzing capillary blood samples from 70 patients in the pediatric ward of Queen Elizabeth Central Hospital, Blantyre, Malawi. ~90% of these samples were within 2 g/dL of the standard value, with higher accuracy on more anemic samples. Current work aims to improve this accuracy by converting the hemoglobin in the sample to the more stable form methemoglobin.
I. Introduction
Anemia, an insufficient concentration of hemoglobin, can lead to decreased productivity, fatigue, delayed development, and an increased mortality risk. It is diagnosed by measuring the concentration of hemoglobin in the blood and can be treated with iron supplementation, blood transfusions, or treating an underlying infection such as malaria. In countries classified as least developed by the UN Human Development Index, anemia affects 66.1% of preschool-aged children and 56.2% of pregnant women [1]. In Malawi, it is estimated that 73.2% of the population has hemoglobin levels below 11 g/dL [2]. The cutoff hemoglobin concentration for defining anemia depends on the patient’s age, sex, and location, but is generally between 11 and 13 g/dL for people living at sea level [1]. Despite the great need for accurate anemia diagnostics, the high cost of disposables prevents widespread use of methods like the HemoCue 201+ (approximately $1.00/cuvette when purchased in Malawi).
Previously, we have demonstrated a low-cost method for hemoglobin concentration assessment using treated chromatography paper as the only disposable (<$0.01/test) [3]. A low-cost, handheld reader measures the paper cuvettes. Briefly, blood is applied to the chromatography paper where the cells are lysed with dried sodium deoxycholate. The paper is placed inside a reusable plastic holder and inserted into the reader. The handheld, battery-powered reader (“HemoSpec”) measures the transmission of the blood at a green wavelength (where hemoglobin absorbs strongly) and a red wavelength (where hemoglobin does not absorb strongly). The difference in absorbance of the blood between the green and red wavelengths correlates with the hemoglobin concentration as determined by a reference standard.
The handheld reader has been modified to give more reliable results and a field trial has been conducted in Blantyre, Malawi to assess the accuracy of the method.
II. Methods
A. Device
In preparation for field trials of the method, we modified the device to give more reliable device-to-device readings, to be easy for users to calibrate, and to measure more accurately the optical density of the sample.
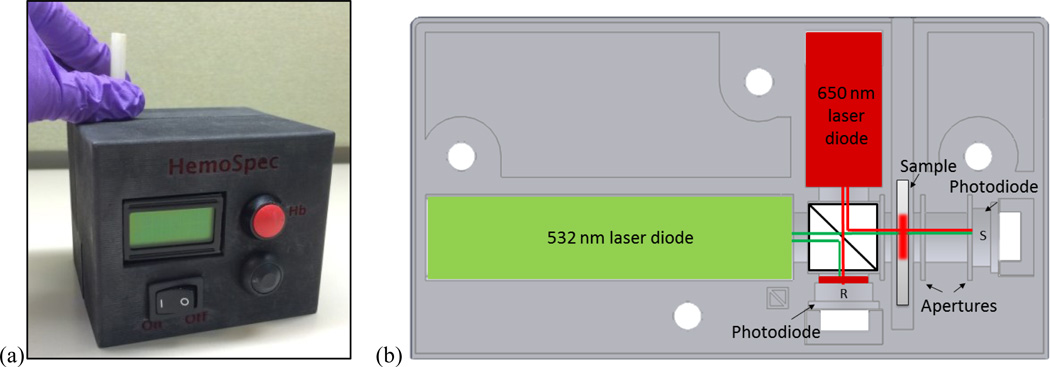
In order to improve device-to-device reliability, we used laser modules instead of LEDs and improved optical component mounts so that devices were less sensitive to misalignment during transport. Laser modules (532 nm DPSS-B from Z-Bolt, 650 nm 38-1003-ND from DigiKey) have a low divergence angle (1.2mrad and 1.6mrad, respectively), and thus the beams do not interact with the walls of the optical holder like the beams of wide-angle LEDs do. The optical components (laser modules, beam splitter BS010 from ThorLabs, photodetectors FDS100 from ThorLabs, and custom-made aluminum apertures) were held securely in two halves of a 3D printed holder (Figure 1). The two halves of the holder were bolted together to minimize movement of the parts between measurements. A second, reference detector was added to correct for any temporal variation in the laser output.
Figure 1.
(a) Photograph of assembled HemoSpec. (b) Schematic of optical holder. Light comes from green and red laser modules, through a 50/50 beamsplitter, and either into a reference photodetector (R) or through the sample and into the sample photodetector (S). The reference detector is protected from intense green light with red cellophane. Slots around sample indicate space for aluminum apertures. Four holes allow the two halves of the optical holder to be bolted together securely.
The optical density of the sample is calculated as
| (1) |
where transmitted is the voltage measured by the sample detector and incident is the adjusted voltage measured by the reference detector. The detectors have different levels of gain due to the reduced amount of light reaching the sample detector, so the incident signal must be corrected to be comparable to the signal received by the sample detector.
Correction factors are calculated during calibration, in which the user inserts a series of three neutral density filters of known optical density following prompts on the device screen. Calibration takes less than 1 minute and should be performed at the start of each day’s measurements or when the device is moved to a new location.
Additionally, apertures were added to the optical train to enable more accurate calculation of optical density. Because paper is highly scattering, without apertures, a detector placed close to the sample receives more light (transmitted plus scattered) than a detector placed far away from the sample. We added two 3 mm diameter apertures placed 1 mm from the sample and 6 mm from each other to reduce the amount of scattered light that reaches the sample detector. A 5 mm diameter aperture was placed 1 mm before the sample to ensure that all light passes through the region of the paper where blood has been applied.
The assembled unit is controlled with a custom-programmed Arduino Nano microcontroller (Gravitech, Minden, NV, USA), is powered with a rechargeable 7.4V lithium-poly battery, and displays results on a 16 character LCD screen.
B. Malawi
To test this method and device in the field, we recruited 70 patients from the pediatric ward of the Queen Elizabeth Central Hospital (QECH) in Blantyre, Malawi. The protocol was approved by the Rice IRB and Malawi COMREC. Patients aged 0–15 years were eligible for the study if the treating physician requested a hemoglobin concentration measurement and the parents provided informed consent.
Previous research has shown significant variability in the hemoglobin concentration of capillary blood drawn simultaneously from the right and left hands [4] and as compared to venous blood [5]. Our own experiments (data not shown) have suggested that there is also significant variation in the hemoglobin concentration of successive drops of blood collected from a fingerprick. To remove these effects from our assessment of the accuracy of the device, we collected approximately 20 µL of blood from a fingerstick into an EDTA-coated collection tube. This blood was thoroughly mixed with a pipette, and then 10 µL was measured using the HemoSpec and 10 µL using the HemoCue 201+ (HemoCue AB, Ängelholm, Sweden), our gold standard. Both devices thus received blood with the same hemoglobin concentration.
The HemoCue 201+ is an appropriate gold standard for this study in a low-resource setting because it was portable, battery-powered, and required only cuvettes to operate. Numerous studies have demonstrated the accuracy of the HemoCue in the lab [6]–[8], and our own measurements (data not shown) demonstrate that the HemoCue compares well to an Act-Diff 2 hematology analyzer (Beckman Coulter, Irving, Tx, USA) using well-mixed venous blood in the lab.
For analysis on the HemoSpec, 10 µL of whole blood were pipetted directly onto a square of chemically treated chromatography paper contained in a reusable plastic holder. The holder and blood-spotted paper were then placed into the HemoSpec, which returns a hemoglobin concentration in approximately 20 seconds.
70 samples were collected in Malawi. 19 samples were removed from analysis due to clotting, insufficient volume, or sitting for more than approximately 30 minutes before measurement, leaving 51 samples for analysis.
III. Results/Discussion
A. Device
To assess the consistency of results across multiple devices, neutral density filters were measured on all devices. Table I shows the mean and standard deviation of five measurements of the difference between the optical density evaluated at 532 nm and 656 nm made by three different devices for a 2.5 and 3.0 OD neutral density filter. (Neutral density filters do not have a perfectly flat spectrum, so there is a measurable difference in optical density between 532 nm and 656 nm.) A change of 0.02 in difference of optical density (for example, the difference between devices 1 and 2 measuring the 2.5 OD filter) corresponds to a change in reported hemoglobin concentration of 0.09 g/dL, a clinically insignificant change.
TABLE I.
Repeatability Across Devices
| Neutral Density Filter |
OD at 532 nm – OD at 656 nm | ||
|---|---|---|---|
| Device 1 | Device 2 | Device 3 | |
| 2.5 OD | 0.18 ± 0.00 | 0.16 ± 0.01 | 0.14 ± 0.00 |
| 3.0 OD | 0.14 ± 0.00 | 0.17 ± 0.00 | 0.15 ± 0.00 |
Data represent average ± standard deviation for 5 measurements.
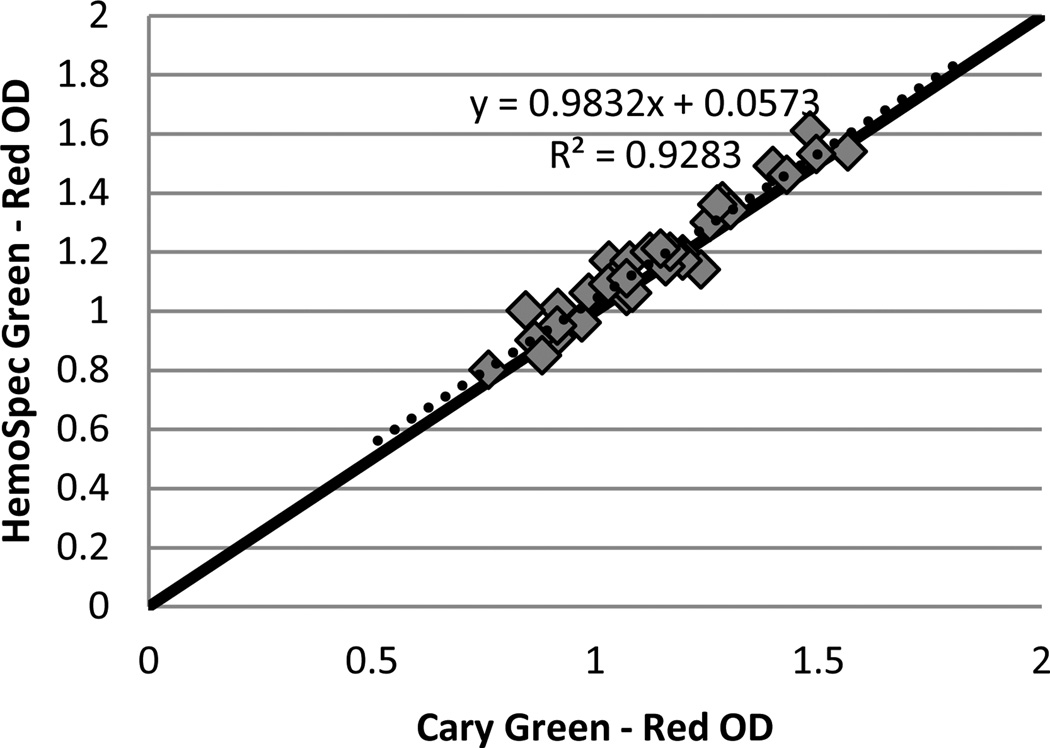
Figure 2 compares the difference in optical density between 523 nm and 650 nm as determined by the HemoSpec to that determined by a Cary 5000 UV-VIS spectrophotometer (Aglient, Santa Clara, CA, USA) for 34 blood samples of varying hemoglobin concentration spotted onto chromatography paper. The two apertures after the sample in the HemoSpec reduce the amount of scattered light reaching the sample detector, and thus give an optical density comparable to that measured by the spectrophotometer, which measures almost exclusively transmitted light. A good concordance between OD measurements on the two devices allows for easy verification of the HemoSpec’s performance without concern for the effect of the device performing the measurement.
Figure 2.
The difference in optical density (OD at 532 nm – OD at 650 nm) of blood samples of varying hemoglobin concentration determined on a Cary 5000 spectrophotometer against that determined by the HemoSpec. Solid line represents equality; dashed line represents linear fit
The materials cost for one HemoSpec is approximately $450, including materials for 3D-printing the plastic holder. This cost can decrease considerably with bulk production.
B. Malawi
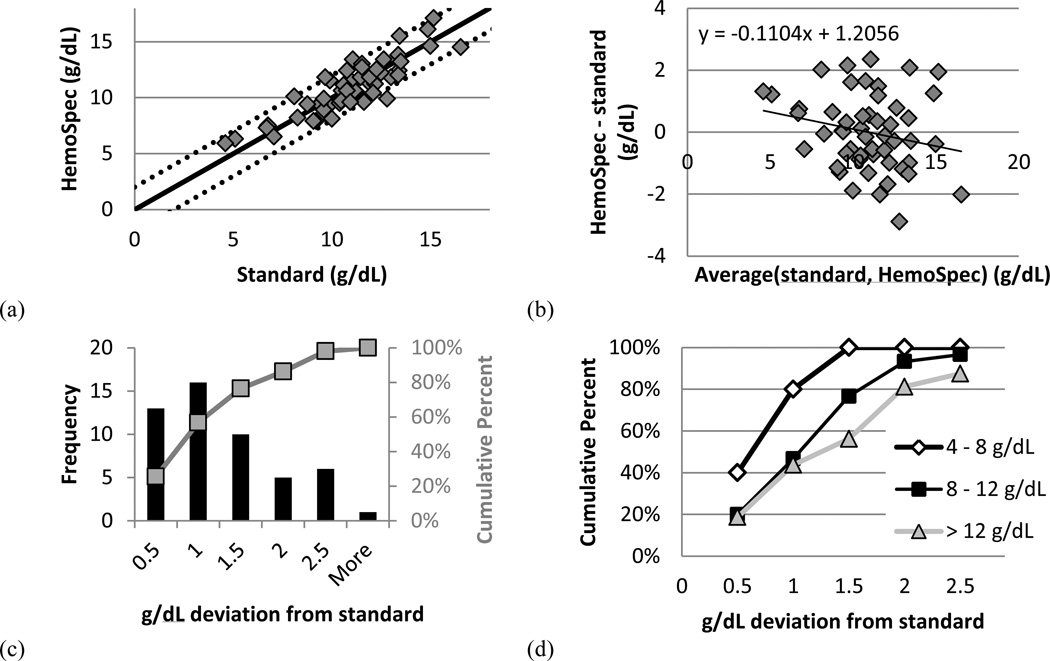
Results from the study in Malawi are shown in Figure 3. Figure 3a compares the hemoglobin concentration determined by the HemoSpec to that determined by the HemoCue (standard). Figure 3b shows these results on a Bland-Altman plot. As seen in Fig. 3c, 86% of samples are within 2 g/dL of the reference standard. This value correlates well with the 95% of samples within 2 g/dL in an assessment of the method performed in laboratory conditions [3].
Figure 3.
(a) Hemoglobin concentration determined by the HemoSpec and the HemoCue (standard). Solid line represents equivalence; dotted lines represent ± 2 g/dL deviation from equivalence. (b) Bland-Altman plot showing the average of hemoglobin concentration determined by each device against the difference in hemoglobin concentration between the two devices. (c) Histogram showing the number of samples (left axis) and the cumulative percent of samples (right axis) achieving the given deviation from the standard. (d) Breakdown of the cumulative percent of (c) according to hemoglobin concentration as determined by the standard. n = 5 for 4 – 8 g/dL (open diamonds), n = 30 for 8 – 12 g/dL (solid squares), and n = 16 for > 12 g/dL (shaded triangles).
Figure 3d shows the cumulative percent of samples reaching a given deviation from the standard, broken down by hemoglobin value as determined by the standard. These results suggest that the method is more accurate for more anemic samples, though analysis with a greater number of samples is necessary (n = 5 for 4 – 8 g/dL, n = 30 for 8 – 12 g/dL, and n = 16 for > 12 g/dL). Clinicians at QECH use a cutoff of 5 g/dL when deciding to transfuse a patient, so higher accuracy around this value is desirable. We believe this higher accuracy at lower concentrations is due to the more even spreading of anemic blood on paper as compared to normal blood and the lower optical density of anemic blood at 532 nm.
IV. Conclusion
We have demonstrated a reliable, low-cost handheld reader for anemia diagnosis. The HemoSpec readers give consistent results on different devices for standard samples. The difference in optical density between 532 nm and 656 nm determined by the HemoSpec for samples of blood on paper corresponds well to the difference in optical density determined by a lab spectrophotometer.
The HemoSpec method was tested with 70 fingerstick blood samples in the Queen Elizabeth Central Hospital of Blantyre, Malawi, and achieved 86% of samples within 2 g/dL of the standard method. This accuracy was higher for more anemic samples.
While 2 g/dL accuracy in the field represents better accuracy than other low-cost methods of hemoglobin determination such as the WHO color scale [7], [9], it is not sufficient for clinical use. Clinicians in Malawi request accuracy of within 1 g/dL of a standard, and in the United States, CLIA (Clinical Laboratory Improvement Amendments) requires ±7% accuracy. We are working to improve the accuracy by incorporating chemistry into the disposable to convert the oxy- and deoxyhemoglobin into more stable methemoglobin. Preliminary results suggest that achieving these improvements in a single paper cuvette will improve our accuracy to within 1 g/dL of the standard value. Further field studies will assess the accuracy of this improved method.
Acknowledgments
Research funded by a grant from the Bill & Melinda Gates Foundation through the Grand Challenges in Global Health Initiative, Grant #2013138 from the Doris Duke Charitable Foundation, and the National Science Foundation Graduate Research Fellowship under Grant No. 0940902.
Contributor Information
Meaghan Bond, Email: Meaghan.Mc.Bond@rice.edu, Rice University, Houston, TX 77005 USA.
Jessica Mvula, College of Medicine and Queen Elizabeth Central Hospital, Blantyre, Malawi.
Elizabeth Molyneux, College of Medicine and Queen Elizabeth Central Hospital, Blantyre, Malawi.
Rebecca Richards-Kortum, Rice University, Houston, TX 77005 USA.
REFERENCES
- 1.McLean E, Cogswell M, Egli I, Wojdyla D, de Benoist B. Worldwide prevalence of anaemia, WHO Vitamin and Mineral Nutrition Information System, 1993–2005. Public Health Nutr. 2009 Apr.12(4):444–454. doi: 10.1017/S1368980008002401. [DOI] [PubMed] [Google Scholar]
- 2.McLean E, Cogswell M, Egli I, Wojdyla D. Worldwide prevalence of anaemia 1993–2005. Glob. database anaemia. Geneva WHO, CDC. 2008 doi: 10.1017/S1368980008002401. [DOI] [PubMed] [Google Scholar]
- 3.Bond M, Elguea C, Yan JS, Pawlowski M, Williams J, Wahed A, Oden M, Tkaczyk TS, Richards-Kortum R. Chromatography paper as a low-cost medium for accurate spectrophotometric assessment of blood hemoglobin concentration. Lab Chip. 2013 Jun.13(12):2381–2388. doi: 10.1039/c3lc40908b. [DOI] [PubMed] [Google Scholar]
- 4.Morris SS, Ruel MT, Cohen RJ, Dewey KG, de la Brière B, Hassan MN. Precision, accuracy, and reliability of hemoglobin assessment with use of capillary blood. Am. J. Clin. Nutr. 1999 Jun.69(6):1243–1248. doi: 10.1093/ajcn/69.6.1243. [DOI] [PubMed] [Google Scholar]
- 5.Neufeld L, García-Guerra A, Sánchez-Francia D, Newton-Sánchez O, Ramírez-Villalobos MD, Rivera-Dommarco J. Hemoglobin measured by Hemocue and a reference method in venous and capillary blood: a validation study. Salud Publica Mex. 2002;44(3):219–227. doi: 10.1590/s0036-36342002000300005. [DOI] [PubMed] [Google Scholar]
- 6.Gehring H, Hornberger C, Dibbelt L, a Rothsigkeit, Gerlach K, Schumacher J, Schmucker P. Accuracy of point-of-caretesting (POCT) for determining hemoglobin concentrations. Acta Anaesthesiol. Scand. 2002 Sep.46(8):980–986. doi: 10.1034/j.1399-6576.2002.460809.x. [DOI] [PubMed] [Google Scholar]
- 7.Paddle JJ. Evaluation of the Haemoglobin Colour Scale and comparison with the HemoCue haemoglobin assay. Bull. World Health Organ. 2002 Jan.80(10):813–816. [PMC free article] [PubMed] [Google Scholar]
- 8.Patel KP, Hay GW, Cheteri MK, Holt DW. Hemoglobin test result variability and cost analysis of eight different analyzers during open heart surgery. J. Am. Soc. Extra- Corporeal Technol. 2007;39:10–17. [PMC free article] [PubMed] [Google Scholar]
- 9.van den Broek NR, Ntonya C, Mhango E, White Sa. Diagnosing anaemia in pregnancy in rural clinics: assessing the potential of the Haemoglobin Colour Scale. Bull. World Health Organ. 1999 Jan.77(1):15–21. [PMC free article] [PubMed] [Google Scholar]


