Abstract
Conventional magnetic resonance imaging (MRI) allows investigators and clinicians to observe the anatomy and injuries of the cerebral white matter (CWM) in dogs. However, dynamic images based on the diffusion tensor (DT) technique are required to assess fiber tract integrity of the CWM. Diffusion tensor tractography (DTT) produces a three-dimensional representation in which data are displayed on a colored map obtained from the anisotropy of water molecules in the CWM tracts. Fractional anisotropy (FA) is a value that measures changes in water diffusion, which can occur if the CWM tracts are displaced, disrupted, or infiltrated. The goal of this study was to determine the feasibility of DTT for in vivo examination of the normal appearance of CWM in dogs through visual and quantitative analysis of the most representative CWM tracts. Nine tractographies were performed on healthy dogs using a 3T MRI scanner. T1- and T2-weighted images and DTI were acquired at different planes. Using DTT, three-dimensional reconstructions were obtained. Fractional ansisotropy and apparent diffusion coefficient (ADC) values of the right and left corticospinal tracts, corpus callosum, cingulum, and right and left fronto-occipital fasciculus were determined. Tract reconstructions were similar in 8/9 healthy dogs. Values for FA and ADC were similar in all the dogs. In one dog, tract reconstructions were inhomogeneous; these were displaced because it had larger lateral ventricles. Findings indicated that DTT is a feasible technique for in vivo study of CWM in dogs and that it complements information from conventional MRI.
Keywords: cerebral white matter, diffusion tensor, dog, in vivo, tractography
Introduction
Magnetic resonance imaging (MRI) is increasingly considered to be the tool of choice for diagnosing central nervous system diseases in both humans and animals, especially diseases affecting cerebral white matter.1–3 However, a disadvantage of conventional MRI is that it does not allow visualization of cerebral white matter constituent fiber tracts and their connectivity.4 Previously, the anatomy of cerebral white matter tracts could be studied only through invasive methods, and such methods could reveal only a few tracts in vivo (neurosurgery) or in anatomical specimens; none could be observed with imaging studies.1,5,6 Diffusion tensor tractography (DTT) is a widely used imaging technique that is effective for several human central nervous system disorders, and the images generated with this technique surpass those generated by structural imaging.7 However, there are no reports on DTT use in veterinary medicine for either diagnostic imaging or for studying cerebral white matter in dogs in vivo. The objective of this study was to establish the feasibility of DTT for in vivo visualization and evaluation of the normal appearance of canine cerebral white matter using visual and quantitative analyses of the most representative tracts in this species. Diffusion tensor tractography is a noninvasive technique that can identify and represent fibers of the cerebral white matter, and their connections in the brain in vivo. In addition to displaying specific cerebral white matter fibers, this technique can also improve the quantification of diffusion characteristics within these fibers.8 This technique provides a three-dimensional representation of diffusion tensor imaging (DTI), and data can be displayed on a colored map obtained from information on the directionality of the movement of water molecules along the main fiber tracts of cerebral white matter. In DTT, colors are assigned to nerve fiber tracts depending on the direction of water displacement. The colors represent the predominant orientation of the fibers in a three-dimensional coordinate system in the three axes of space (x, y, and z); where red indicates a right-left direction, green indicates a dorsoventral direction, and blue indicates a rostrocaudal direction. This type of representation is called an anisotropic map.9,10 In human medicine, this technique has great potential for studying numerous diseases because the results of DTT and clinical symptoms can be compared directly. This technique is commonly used to study the anatomy and maturation of the normal, aging brain, but it also can be used to help diagnose neurological conditions, including brain ischemia, multiple sclerosis, diffuse axonal injury, epilepsy, metabolic disorders, certain mental illnesses, and brain tumors, as well as establish a prognosis for patients with these conditions.11,12 Though DTI has been extensively used to investigate brains of the dogs ex vivo,13–15 there are no reports on the in vivo use of DTT to study cerebral white matter in dogs. The ability to trace cerebral white matter fibers in the dog generates a number of opportunities for potential clinical applications, and has both diagnostic and prognostic utility for various central nervous system pathologies6 affecting the canine species.
Principle of DTI
It is possible to study global cerebral white matter connections in vivo through diffusion-weighted imaging (DWI). The images generated by this technique are obtained by measuring the restricted diffusion of water molecules in brain tissue. Diffusion-weighted imaging assumes that water diffusivity is represented by an ellipsoid tensor in each voxel, that determines the main direction of diffusion, apparent diffusion coefficient (ADC), and fractional anisotropy (FA); this method is known as DTI.3,4,16 Diffusion tensor imaging is a relatively new MRI method that has been used successfully in human medicine and in some animal species.9,10,12,17 Diffusion tensor imaging is a mathematical model of three-dimensional diffusion consisting of a matrix of numbers from diffusion measurements in at least six different directions, but can be up to 128 directions; from these, the diffusion in any arbitrary direction or the direction of maximum diffusivity can be determined in any plane. Diffusion tensor imaging can map the degree of anisotropy and the direction of a local fiber, voxel-by-voxel, thus providing a new and unique opportunity to study cerebral white matter architecture in vivo.11,18 Diffusion tensor imaging uses the anisotropy of water diffusion in the brain and can be used to analyze and monitor cerebral white matter fibers, provide useful anatomical and microstructural information of major brain regions in animal models both in vivo and ex vivo, and assess brain damage.3,11,13 Anisotropy is a property of normal brain tissue that depends on the directionality of water molecules and the integrity of white matter fibers. Fractional anisotropy is the most commonly used parameter to detect alterations in water diffusion, which can occur if the cerebral white matter tracts are displaced, disrupted, or infiltrated. It is a numeric variable with values ranging from 0 to 1. A value of 0 corresponds to maximum isotropy; such a value can be observed in subarachnoid spaces and in normal ventricles where water is mobilized freely (a process known as isotropic diffusion). A value of one corresponds to maximum anisotropy or restriction in the movement of tissue water; such a value can be found in the brain parenchyma and is known as anisotropic diffusion.9,10,19 The average diffusivity is represented by the ADC for isotropic diffusion. The apparent diffusion coefficient is usually used to characterize the overall displacement of water molecules. It is not susceptible to diffusion gradient applied directions; therefore, the ADC contrast is insensitive to the anisotropy effect.13 Because the ADC value does not sufficiently describe anisotropic diffusion the DTI must also be used.11
Material and Methods
Experimental Animals
Nine healthy canine patients of varying breeds and genders from Hospital Imagen were prospectively recruited. All dogs were 3–5 years old with an average weight of 12 kg. The dogs received a general physical and neurological exam, and blood samples were taken for a preanesthetic profile. The dogs were fasted for 8 h prior to the imaging procedure. During the imaging procedure, the dogs were anesthetized with diazepam (2 mg/kg IV, valium, Roche, Nutley, New Jersey) and propofol (4 mg/kg IV, recofol, Bayer, Turku, Finland). Animals were handled according to the Technical Specifications for the Care and Use of Laboratory Animals of the Official Mexican Standards.20 None of the animals were euthanized.
Image Acquisition Technique
The MRI protocol was carried out in the same 3 Tesla scanner for all dogs using an 8-channel cranial antenna (Achieva system, Philips Medical Systems, Best, The Netherlands). Diffusion tensor imaging was performed on each patient (spin echo EPI, TR = 6000 ms, TE = 80 ms, matrix = 72 × 68, slice thickness = 1.5 mm); diffusion gradients were used in 32 nonparallel directions (b = 800 s/mm2) for duration of 16 min. Moreover, T1- and T2-enhanced images were acquired to obtain a high-resolution anatomical reference (three-dimensional-fast field echo, TE = 3.6 ms, TR = 7.5 ms, matrix = 220 × 218, slice thickness = 2 mm).
Diffusion Tensor Imaging Acquisition and Assignment of Direction
T1- and T2-weighted images and DTI were obtained in different planes (transverse, dorsal, and sagittal). Three-dimensional reconstructions, FA, and ADC values were obtained for the left and right corticospinal tracts, the corpus callosum, the cingulum, and the right and left fronto-occipital fasciculus to visually, evaluate, and quantify these fiber tracts.
Diffusion Tensor Imaging Tractographies
Diffusion tensor tractography was performed by importing DTI into image analysis software that was provided by the scanner manufacturer (FiberTrak, ®Philips Medical Systems Inc.; Best, The Netherlands). Cerebral white matter tracts were identified using regions of interest (ROIs) that were manually placed by Hernández Jael Sarahí with the advice of Marrufo Oscar. The software identified tracts based on finding the most favorable path between two manually placed ROIs. Regions of interest were positioned where trajectories of the cerebral white matter fiber tracts were estimated to be, based on veterinary anatomy guides and a human DTI atlas.11,21, 22 High-resolution T1-images were placed on top of the colored map to identify connections between anatomical structures. The different tracts were identified, delineated, and reconstructed at different points along their trajectory using the color map in the sagittal, dorsal, and transverse planes, which were reconstructed using a fiber-tracking algorithm. The propagation ended when the tract trajectory reached a voxel with a FA value less than 0.15 mm, when the tract was less than 10 mm long, or when the angle between two consecutive steps was greater than 45°. Data were coded in red to indicate a right-left direction, green to indicate a dorsoventral direction, and blue to indicate a rostrocaudal direction. The cerebral white matter tracts were assigned to three groups of fibers: projection, commissural, and association fibers.11
Data Analysis
Statistical analyses were selected and performed by authors MSAG and JSHA with the advice of Hernández Jaime Alonso using a commercially available statistical software package (SSPS, version 19, Microsoft, Chicago, IL).
Mean tract FA and ADC values, their standard errors, and standard deviation were calculated by authors MSAG and JSHA with the advice of Hernández Jaime Alonso. A confidence interval of 95% or a significance value of P < 0.05 was used for the mean.
A quantitative assessment of ventricular volume (VV) in relation to the brain volume (BV) was also performed by author JSHA with the advice of author OMM using manual segmentation in regions of interest (ROIs) on the image analysis freeware (OsiriX v.3.9.4) in the nine healthy dogs. The means, standard errors, standard deviations, and 95% confidence intervals for the means of the VV in relation to the BV of the right and the left side were obtained.
Results
Three-dimensional reconstructions of the corticospinal tract, corpus callosum, cingulum, and fronto-occipital fasciculus were generated for each of the nine dogs. Fibers in the corticospinal tract component of the projection fiber group were displayed in blue and green (Fig.1A, B, C). Blue fibers connected cortical areas in the cerebral cortex, the brain stem, and spinal cord. Green fibers connected the corona radiate, internal capsule, and cerebral peduncle. Fibers in the corpus callosum component of the commissural fiber group were displayed in red and connected the two cerebral hemispheres (Fig.2A, B, C). The cingulum component of the association fiber group appeared as long fibers, and these were displayed in blue (Fig.3A, B, C). These fibers had a rostrocaudal orientation and connected cortical areas in each hemisphere. Fibers in the superior and inferior fronto-occipital fasciculus component of the association fiber group were long and displayed in blue (Fig.4A, B, C). These fibers had a rostrocaudal orientation and connected cortical areas in each hemisphere and in the frontal and occipital lobes. Three-dimensional reconstructions of the tracts were homogeneous and uniform in geometry and spatial orientation in eight of the nine healthy dogs. In one dog, tract reconstructions were not homogeneous or uniform because the fibers were displaced, most evident in the corticospinal tract and corpus callosum (Fig.5). There was a significant difference in the VV in relation to the BV in this dog (Table 1).
Fig 1.
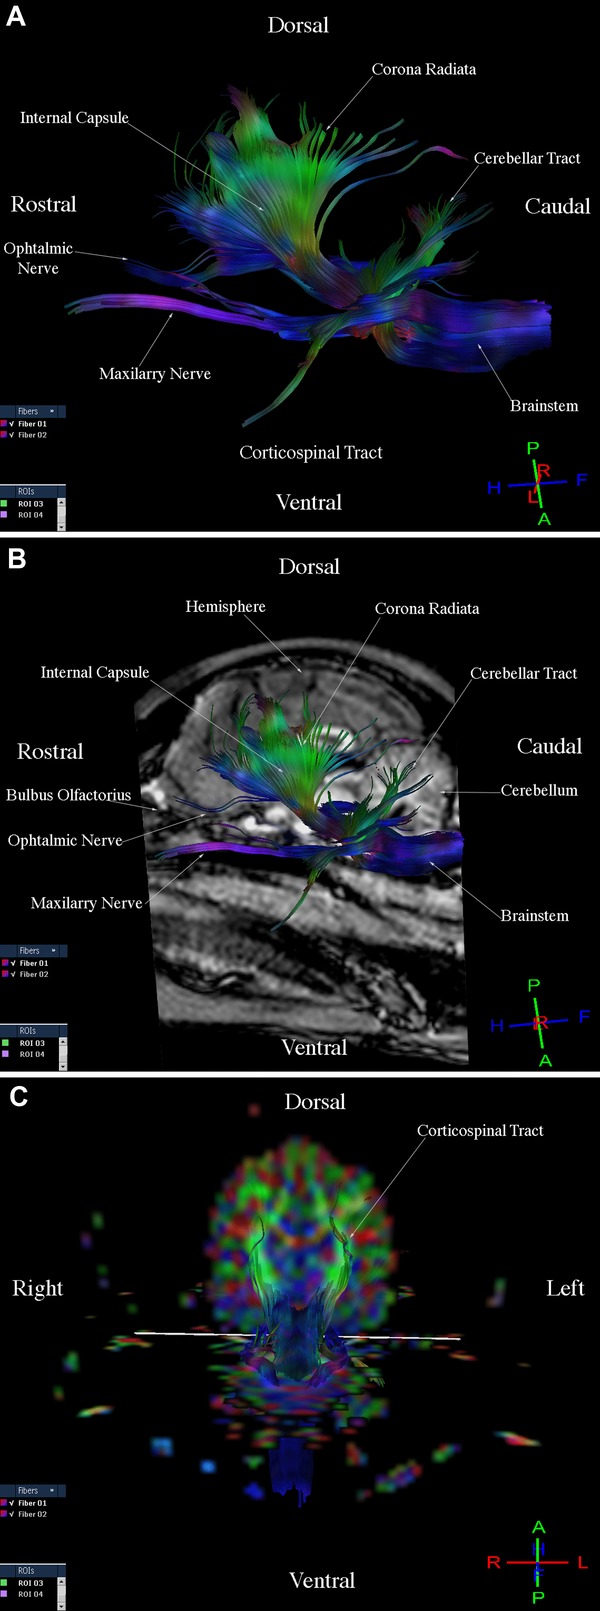
Images illustrating the corticospinal tract in a healthy dog. (A) Diffusion tensor tractography (DTT) image, side view. (B) T1-Weighted image and DTT image, sagittal view. (C) Diffusion tensor tractography (DTT) image on the colored map, transverse sectional view.
Fig 2.
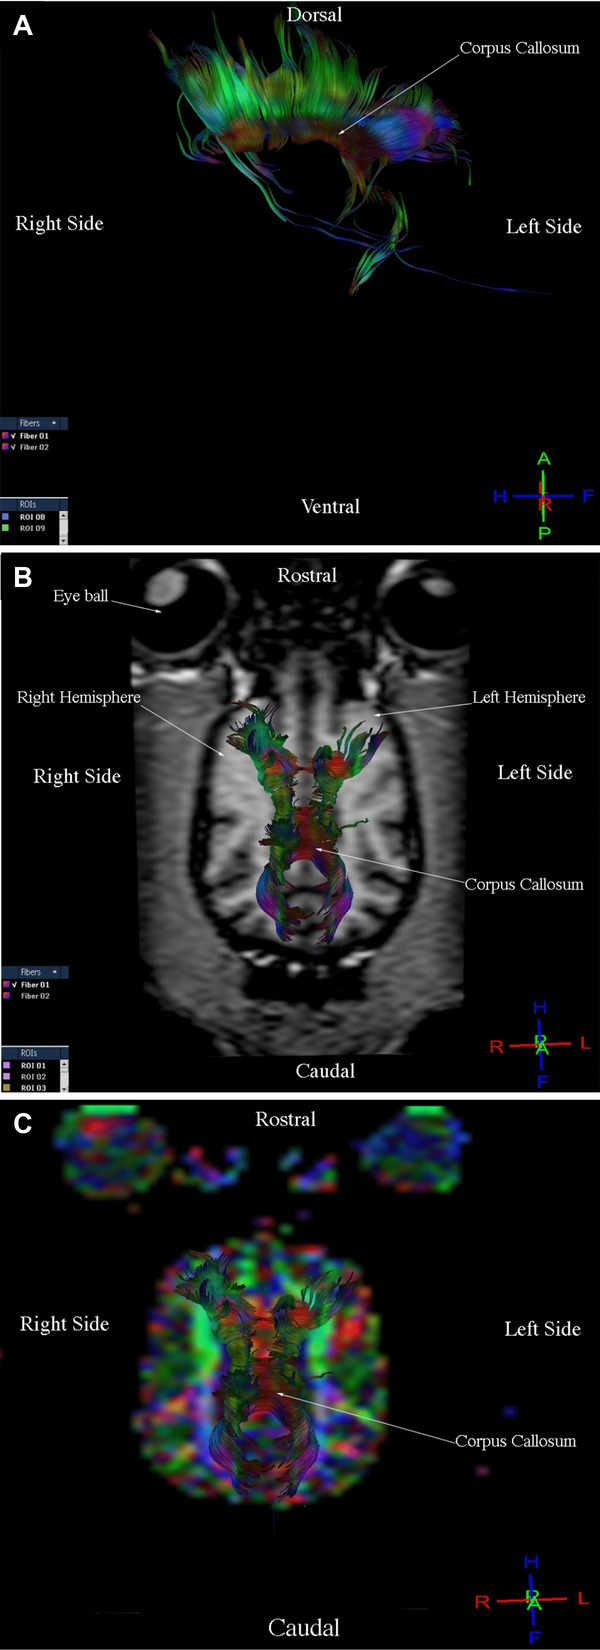
Images illustrating the corpus callosum in a healthy dog. (A) Diffusion tensor tractography (DTT) image, side view. (B) T1-weighted image and DTT image, dorsal view. (C) Diffusion tensor tractography image on the colored map, dorsal view.
Fig 3.
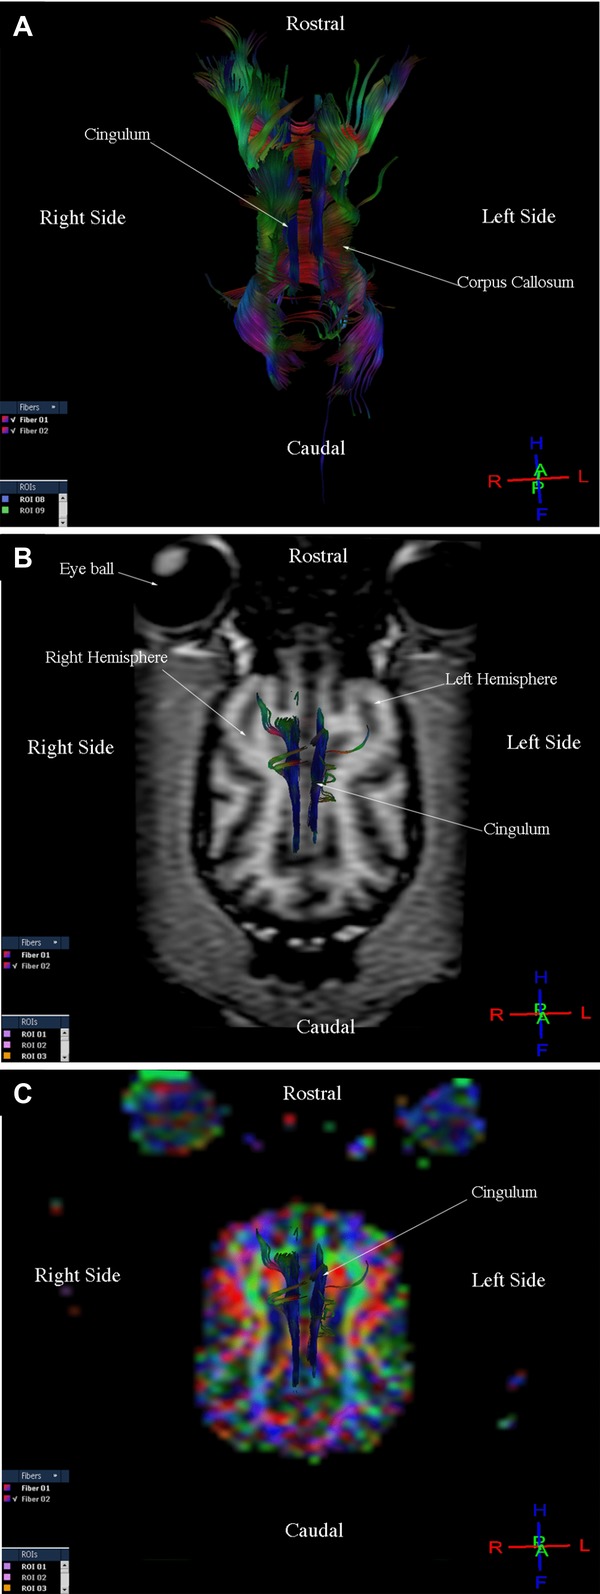
Images illustrating the cingulum in a healthy dog. (A) Diffusion tensor tractography (DTT) image, dorsal view. (B) T1-weighted image and DTT image, dorsal view. (C) Diffusion tensor tractography image on the colored map, dorsal view.
Fig 4.
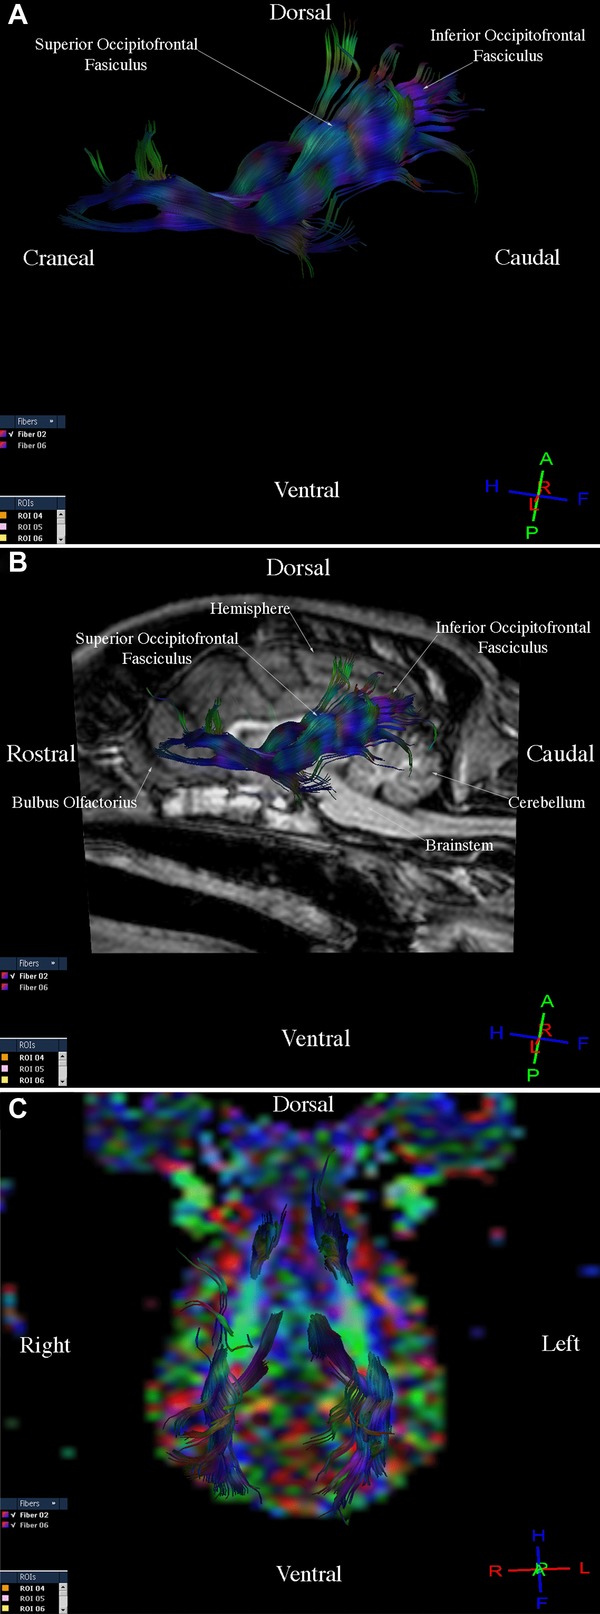
Images illustrating the fronto-temporo-occipital tract in a healthy dog. (A) Diffusion tensor tractography (DTT), side view. (B) T1-weighted image and DTT image, sagittal view. (C) Diffusion tensor tractography image on the colored map, dorsal view.
Fig 5.
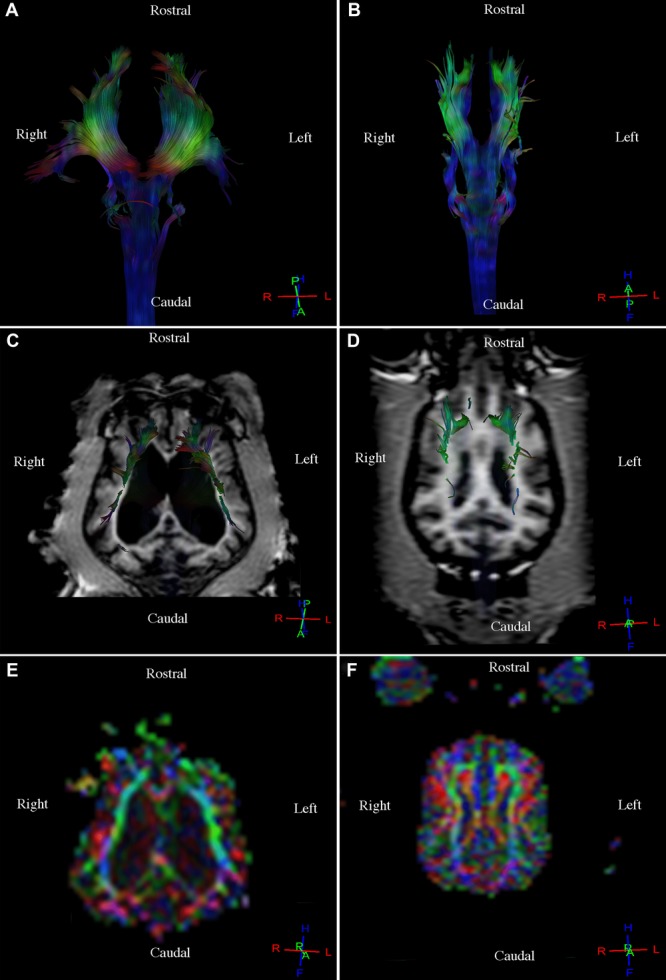
Comparison between a healthy dog with large lateral ventricles and a healthy dog with normal ventricles. (A) Diffusion tensor tractography (DTT) image, corticospinal tract with altered topography and corpus callosum due to large lateral ventricles, dorsal view. (B) Diffusion tensor tractography image, corticospinal tract with normal downward topography of the fibers, dorsal view. (C) T1-weighted image and DTT image, corticospinal tract with anterior and lateral displacement of the fibers and of the corpus callosum due to large lateral ventricles, dorsal view. (D) T1-weighted image and DTT image, corticospinal tract with normal downward topography of the fibers, dorsal view. (E) Diffusion tensor tractography image of the corticospinal tract on the colored map with anterior and lateral displacement of the fibers and of the corpus callosum due to large lateral ventricles, dorsal view. (F) Diffusion tensor tractography image, corticospinal tract on the colored map with normal topography of the fibers, dorsal view.
Table 1.
Ventricular Volume in Relation to the Brain Volume in Nine Healthy Dogs
| Relation | Healthy dogs (n = 9) | |||
|---|---|---|---|---|
| Ventricle volume/ Brain volume (cm3) | X | SE | SD | CI 95% |
| RVV/BV Left | 0.051 | 0.019 | ±0.057 | (O.007, 0.095) |
| RVV/BV Right | 0.044 | 0.016 | ±0.047 | (0.007, 0.080) |
R, relation; VV, ventricle volume; BV, brain volume; X, mean; SE, standard error; SD, standard deviation; CI, 95% confidence interval for the mean.
The means, standard errors, standard deviations, and 95% confidence intervals for the means of the FA and ADC values for the six tracts were obtained from all nine dogs (Table 2). Similarities in the FA and ADC values were identified in the nine healthy dogs.
Table 2.
Fractional Anisotropy and Apparent Diffusion Coefficient Values of Six Cerebral White Matter Tracts in Healthy Dogs
| Healthy dogs (n = 9) | ||||||||
|---|---|---|---|---|---|---|---|---|
| FA | ADC(10−3 mm2 s−1) | |||||||
| Tracts | X | SE | SD | CI 95% | X | SE | SD | CI 95% |
| Corticospinal (Right) | 0.391 | 0.009 | ±0.026 | (O.371, 0.412) | 1.154 | 0.063 | ±0.189 | (1.009, 1.299) |
| Corticospinal (Left) | 0.400 | 0.006 | ±0.018 | (0.387, 0.414) | 1.104 | 0.055 | ±0.164 | (0.977, 1.230) |
| Corpus Callosum | 0.365 | 0.007 | ±0.022 | (0.348, 0.382) | 0.975 | 0.033 | ±0.099 | (0.899, 1.051) |
| Cingulum | 0.336 | 0.011 | ±0.032 | (0.311, 0.360) | 0.847 | 0.053 | ±0.159 | (0.725, 0.969) |
| Fronto-occipital (Right) | 0.331 | 0.009 | ±0.026 | (O.311, 0.350) | 0.879 | 0.009 | ±0.028 | (0.858, 0.901) |
| Fronto-occipital (Left) | 0.331 | 0.010 | ±0.029 | (0.308, 0.353) | 0.913 | 0.010 | ±0.031 | (0.888, 0.937) |
FA, fractional anisotropy; ADC, apparent diffusion coefficient; X, mean; SE, standard error; SD, standard deviation; CI, 95% confidence interval for the mean.
Discussion
To our knowledge, the current study was the first to visually and quantitatively describe the trajectory of cerebral white matter fiber tracts in a group of live dogs using DTT for diagnostic purpose. Diffusion tensor tractography imaging resolution allowed rapid display and identification of the most representative cerebral white matter fiber tracts in this sample population of nine healthy dogs of varying breeds and genders. This technique described anatomical, geometric, and spatial properties of the fibers. In addition, the conduction properties of the fibers could be estimated through FA and ADC quantification. There was homogeneity and uniformity in the three-dimensional reconstructions in nearly all dogs. Quantification of the FA and ADC values of the most representative tracts was similar in all nine dogs, thus demonstrating the feasibility of the technique and the analysis of the normal appearance of the cerebral white matter (CWM) in dogs in vivo. The analysis of the images in different planes and the three-dimensional reconstructions of the fiber tracts revealed a visual difference in the normal cerebral white matter appearance in one of the nine healthy dogs. This dog showed an altered topography of the corticospinal tract and corpus callosum due to displacement of the fibers. Quantitative assessment of ventricular volume in relation to the brain volume showed that this dog had larger lateral ventricles in relation to the other dogs. Authors believe this was most likely a normal variant because the dog exhibited no clinical neurological signs at the time of imaging. Other studies have shown that some canine species may exhibit a broad range of normal cerebral ventricular sizes, as assessed by neuroimaging, and that cerebral ventricular size is quite variable in a normal dog.23,24
The only values quantified in the current study were those specific to the fiber tract and not to the ROIs because our research focused on demonstrating the feasibility of DTT for displaying and the normal appearance of the most representative cerebral white matter fiber tracts of healthy dogs in vivo. The quantification of FA and ADC values, or the exact description of the ROIs, were not used to visualize fiber tracts, as in our experience these values and descriptions can be obtained at different points of the fiber tract trajectories using the colored map. Future studies are needed to develop a method for preparing DTT templates and to reconstruct cerebral white matter pathways in the healthy dog in vivo using an ROI approach. This method is similar to the method used in humans and provides virtual representations of cerebral white matter tracts that are faithful to the classical ex vivo descriptions that include a detailed anatomical study of canines. The preparation of cerebral white matter templates for the healthy dog in vivo will allow investigators to follow the trajectory of the fibers delineating ROIs in DTI for DTT reconstruction. Improved knowledge of anatomy and the development of a template as a guide for the placement of ROIs could be used in future applications such as teaching and guiding virtual dissections of cerebral white matter tracts in healthy dogs in vivo, and comparision with pathological cases where the anatomy is observed distorted by the underlying disease process.5,21 Our findings are preliminary and future research will be needed to evaluate the use of DTT in clinical cases. Indeed, the use of this technique as a diagnostic tool is currently limited because templates and standardized FA and ADC values of the cerebral white matter of healthy dogsin vivo (which are prerequisites for the use of this technique in pathological cases) are lacking.3 Three previous canine DTI studies were conducted ex vivo,11,13,25 and one was conducted in vivo.26 In these studies, DTI was used to examine the structure and microstructure of the cerebral white matter but not for diagnostic purposes in canines. The findings of one study 11 supported our study in that they also revealed the presence of association, commissural, and projection fibers in the dog. These data and information are also available in humans,21 and this allowed us to identify, compare, and reconstruct different fiber tracts in our healthy dogs in vivo.
One of the limitations of the current study was that acquiring DTI data in dogs in vivo required a longer scan time (16 min) than scan times reported in studies in dogs ex vivo13 and that this resulted in motion-related artifacts. Another limitation was the lack of a standardized canine template for placing ROIs. Regions of interest in the current study were manually placed based on subjective criteria and reproducibility was not measured. However, despite these limitations, the results of our study showed that the DTT reconstructions allowed identification and differentiation of CWM tracts in dogs in vivo, and that these reconstructions were comparable with those obtained in ex vivo canine studies.11 These preliminary technical aspects must be overcome before this technique can be routinely used in clinical practice, and before this tool can be considered a complementary diagnostic method for conventional MRI. As new MRI options become increasingly available for daily clinical veterinary practice, novel diffusion techniques such as DTT warrant further exploration.
In conclusion, findings from the current study indicated that DTT is a feasible noninvasive technique for in vivo study of CWM fiber tracts in the dog. Authors believe that the implementation of DTT as a noninvasive diagnostic method will complement conventional MRI, thus allowing investigators to examine the microstructural characteristics of the brain in vivo, and to obtain information on the anatomy, connectivity, and morphology of possible damage to fiber tracts in dogs suffering intracranial pathology or injury. Future research is needed to develop standardized ROI templates for in vivo canine studies and to compare DTT findings with confirmed pathologic findings.
Acknowledgments
Authors would like to acknowledge Dr. Jaime Alonso Hernández Navarro, for guidance and advice with the statistical analyses, Dr. José Angel Gutiérrez Pabello, and Dr. Jesús Taboada Barajas for guidance and advice during the study; members of the Hospital Imagen for making realization of this project possible. We would like to specially thank National Center for Medical Imaging and Instrumentation.
REFERENCES
- 1.Conturo TE, Lori NF, Cull TS, et al. Tracking neuronal fiber pathways in the living human brain. Proc Natl Acad Sci USA. 1999;96:10422–10427. doi: 10.1073/pnas.96.18.10422. [DOI] [PMC free article] [PubMed] [Google Scholar]
- 2.Martín-Vaquero P, Da-Costa RC, Echandi RL, Tosti CL, Knopp MV, Sammet S. Magnetic resonance imaging of the canine brain at 3 and 7 T. Vet Radiol Ultrasound. 2011;52:25–32. [PubMed] [Google Scholar]
- 3.Preti GM, Di Marzio A, Mastropietro A, et al. Boston, Massachusetts, USA: 2011. Tractographic reconstruction protocol optimization in the rat brain in vivo: towards a normal atlas; pp. 8467–8470. 33rd Annual International Conference of the IEEE EMBS. [DOI] [PubMed] [Google Scholar]
- 4.Takahashi E, Dai G, Wang R, et al. Development of cerebral fiber pathways in cats revealed by diffusion spectrum imaging. Neuroimage. 2010;49:1231–1240. doi: 10.1016/j.neuroimage.2009.09.002. [DOI] [PMC free article] [PubMed] [Google Scholar]
- 5.Kamali A, Kramer LA, Frye RE, Butler IJ, Hasan KM. Diffusion tensor tractography of the human brain cortico-ponto-cerebellar pathways: a quantitative preliminary study. J Magn Reson Imaging. 2010;32:809–817. doi: 10.1002/jmri.22330. [DOI] [PMC free article] [PubMed] [Google Scholar]
- 6.Mori S, Zhang J. Principles of diffusion tensor imaging and its applications to basic neuroscience research. Neuron. 2006;51:527–539. doi: 10.1016/j.neuron.2006.08.012. [DOI] [PubMed] [Google Scholar]
- 7.Lee AY, Shin D-G, Park J-S, et al. Neural tracts injuries in patients with hypoxic ischemic brain injury: diffusion tensor imaging study. Neurosci Lett. 2012;292:1–6. doi: 10.1016/j.neulet.2012.08.053. [DOI] [PubMed] [Google Scholar]
- 8.Partridge SC, Mukherjee P, Berman JI, et al. Tractography-based quantitation of diffusion tensor imaging parameters in white matter tracts of preterm newborns. J Magn Reson Imaging. 2005;22:467–474. doi: 10.1002/jmri.20410. [DOI] [PubMed] [Google Scholar]
- 9.Liu C, Li W, Wu B, Jiang Y, Johnson GA. 3D fiber tractography with susceptibility tensor imaging. Neuroimage. 2012;59:1290–1298. doi: 10.1016/j.neuroimage.2011.07.096. [DOI] [PMC free article] [PubMed] [Google Scholar]
- 10.Pease A, Miller R. The use of diffusion tensor imaging to evaluate the spinal cord in normal and abnormal dogs. Vet Radiol Ultrasound. 2011;52:492–497. doi: 10.1111/j.1740-8261.2011.01837.x. [DOI] [PubMed] [Google Scholar]
- 11.Jacqmot O, Van Thielen B, Fierens Y, et al. Diffusion tensor imaging of white matter tracts in the dog brain. Anat Rec. 2013;296:340–349. doi: 10.1002/ar.22638. [DOI] [PubMed] [Google Scholar]
- 12.Mishra A, Lu Y, Choe AS, et al. An image-processing toolset for diffusion tensor tractography. Magn Reson Imaging. 2007;25:365–376. doi: 10.1016/j.mri.2006.10.006. [DOI] [PMC free article] [PubMed] [Google Scholar]
- 13.Wang P, Zhu J-M. Quantitative diffusion tensor imaging of white matter microstructure in dog brain at 7 T. Open Med Imaging J. 2010;4:1–5. [Google Scholar]
- 14.Pierce TT, Calabrese E, White LE, Chen SD, Platt SR, Provenzale JM. Segmentation of the canine corpus callosum using diffusion tensor imaging tractography. AJR Am J Roentgenol. 2014;202:W19–W25. doi: 10.2214/AJR.12.9791. Doi: 10.2214/AJR.129791. [DOI] [PMC free article] [PubMed] [Google Scholar]
- 15.Wei PT, Leong D, Calabrese E, et al. Diffusion tensor imaging of neural tissue organization: correlations between radiologic and histologic parameters. Neuroradiol J. 2013;26:501–510. doi: 10.1177/197140091302600502. [DOI] [PMC free article] [PubMed] [Google Scholar]
- 16.Laothamatas J, Sungkarat W, Hemachudha T. Neuroimaging in rabies. Adv Imaging Electron Phys. 2011;79:309–327. doi: 10.1016/B978-0-12-387040-7.00014-7. [DOI] [PubMed] [Google Scholar]
- 17.Ronen I, Kim KH, Garwood M, Ugurbil K, Kim DS. Conventional DTI vs. slow and fast diffusion tensors in cat visual cortex. Magn Reson Med. 2003;49:785–790. doi: 10.1002/mrm.10431. [DOI] [PubMed] [Google Scholar]
- 18.Westin C-F, Maier SE, Mamata H, Nabavi A, Jolesz FA, Kikinis R. Processing and visualization for diffusion tensor MRI. Med Image Anal. 2002;6:93–108. doi: 10.1016/s1361-8415(02)00053-1. [DOI] [PubMed] [Google Scholar]
- 19.Beaulieu C. The basis of anisotropic water diffusion in the nervous system—a technical review. NMR Biomed. 2002;15:435–455. doi: 10.1002/nbm.782. [DOI] [PubMed] [Google Scholar]
- 20.States UM, editor. Official Journal of the Nation. 1999. Technical Specifications for the Production, Care and Use of Laboratory Animals of the Official Mexican Standard NOM-062-ZOO-1999. [Google Scholar]
- 21.Catani M, Thiebaut de Schotten M. A diffusion tensor imaging tractography atlas for virtual in vivo dissections. Cortex. 2008;44:1105–1132. doi: 10.1016/j.cortex.2008.05.004. [DOI] [PubMed] [Google Scholar]
- 22.Done SH, Goody PC, Evans SA, Stickland NC. The dog and cat. Vol. 3. London: Elsevier Health Sciences; 2009. Color atlas of veterinary anatomy. [Google Scholar]
- 23.Vullo T, Manzo R, Gomez DG, Deck MD, Cahill PT. A canine model of acute hydrocephalis with MR correlation. Am J Neuroradiol. 1998;19:1123–1125. [PMC free article] [PubMed] [Google Scholar]
- 24.Vullo T, Korenma E, Manzo RP, Gomez DG, Deck MD, Cahill PT. Diagnosis of cerebral ventriculomegaly in normal adult beagles using quantitative MRI. Vet Radiol Ultrasound. 1997;38:277–281. doi: 10.1111/j.1740-8261.1997.tb00855.x. [DOI] [PubMed] [Google Scholar]
- 25.Zhu JM, Wang P, Robertson JL, Rossmeisl JH, Robbins ME, Shaw EG. Quantitative assessment of tumor microstructure in canine brain using high resolution DTI microimaging. Proc Int Soc Magn Resonance Med. 2006;14:2924. [Google Scholar]
- 26.Wu Y-C, Field AS, Duncan ID, et al. High b-value and diffusion tensor imaging in a canine model of dysmyelination and brain maturation. Neuroimage. 2011;58:829–837. doi: 10.1016/j.neuroimage.2011.06.067. [DOI] [PMC free article] [PubMed] [Google Scholar]


