

Abstract
Despite a wealth of preclinical studies, it is unclear whether PIK3CA or PTEN gene aberrations are actionable in the clinical setting. Of 1,656 patients with advanced, refractory cancers tested for PIK3CA or PTEN abnormalities, PIK3CA mutations were found in 9% (146/1,589), and PTEN loss and/or mutation in 13% (149/1,157). In multicovariable analysis, treatment with a PI3K/AKT/mTOR inhibitor was the only independent factor predicting response to therapy in individuals harboring a PIK3CA or PTEN aberration. The rate of stable disease (SD) ≥6 months/partial response reached 45% in a subgroup of individuals with H1047R PIK3CA mutations. Aberrations in the PI3K/AKT/mTOR pathway are common and potentially actionable in patients with diverse advanced cancers. This work provides further important clinical validation for continued and accelerated use of biomarker-driven trials incorporating rational drug combinations.
Keywords: PIK3CA, PTEN, KRAS, NRAS, BRAF, Cancer, Clinical trial
INTRODUCTION
The PI3K/AKT/mTOR pathway is frequently activated in many human cancers, often via molecular abnormalities such as PIK3CA mutations or loss of PTEN function.(Engelman, 2009; Hollander et al., 2011; Samuels et al., 2004) Preclinical models and early clinical data in several tumor types suggested that PIK3CA mutations and loss of PTEN function can result in increased sensitivity to therapies targeting the PI3K/AKT/mTOR signaling pathway.(Di Nicolantonio et al., 2010; Engelman et al., 2008; Ihle et al., 2009; Janku et al., 2011b; Moroney et al., 2011; Ni et al., 2012; Tsimberidou et al., 2012; Wee et al., 2008; Weigelt et al., 2011)
Patients with gynecological and breast tumors and PIK3CA mutations demonstrated a partial response (PR) rate of 30% in early phase clinical trials with PI3K/AKT/mTOR inhibitors compared to 10% in patients without PIK3CA mutations.(Janku et al., 2012b) It is conceivable that loss of PTEN function, which is a major negative regulator of the pathway, can be similarly predictive, whereas simultaneous mutations in the mitogen-activated protein kinase (MAPK) pathway may lead to therapeutic resistance.(Di Nicolantonio et al., 2010; Engelman et al., 2008; Ihle et al., 2009; Tsimberidou et al., 2012)
Identifying actionable molecular aberrations has been critical to several major therapeutic advances in cancer medicine. Examples include BCR-ABL fusion in chronic myeloid leukemia (CML), epidermal growth factor (EGFR) mutations and EML4-ALK fusion in non-small cell lung cancer, and BRAF mutations in melanoma.(Druker et al., 2001; Falchook et al., 2012; Flaherty et al., 2010; Lynch et al., 2004) Therefore, we investigated the relationship among PIK3CA mutations and PTEN aberrations and treatment outcomes in patients with advanced cancer who were referred to the Clinical Center for Targeted Therapy at The University of Texas MD Anderson Cancer Center (MD Anderson).
RESULTS
Patients
A total of 1,656 patients with diverse advanced cancers were analyzed for the presence of PIK3CA mutations and/or PTEN aberrations (Table 1). Their median age was 59 years (range, 13 to 92 years) and most patients 1,288 (77%) were White. The most common tumor types were colorectal cancer 298 (18%), ovarian cancer 184 (11%), and melanoma 126 (8%).
Table 1.
Patients characteristics (n=1,656)
| Variable | PIK3CA mutation (%) | wild-type PIK3CA (%) | P value | PTEN aberration (%) | PTEN intact (%) | P value |
|---|---|---|---|---|---|---|
| All | 160 (100)a,b | 1,429 (100)a | NA | 163 (100)b,c | 994 (100)c | NA |
| Gender | ||||||
| Men | 62 (39) | 683 (48) | 0.03 | 86 (53) | 478 (48) | 0.27 |
| Women | 98 (61) | 746 (52) | 77 (47) | 516 (52) | ||
| Median age, range (years) | 56, 16–83 | 59, 13–92 | 0.16 | 59, 20–83 | 59, 14–90 | 0.74 |
| Ethnicity | ||||||
| White | 126 (79) | 1,115 (78) | 0.97 | 133 (82) | 768 (77) | 0.34 |
| African-American | 14 (9) | 127 (9) | 13 (8) | 86 (9) | ||
| Hispanic | 11 (7) | 112 (8) | 7 (4) | 90 (9) | ||
| Asian | 7 (4) | 52 (3.5) | 7 (4) | 34 (3) | ||
| Other | 2 (1) | 23 (1.5) | 3 (2) | 16 (2) | ||
| Tumor type | ||||||
| Colorectal | 46 (29) | 236 (17) | NA | 28 (17) | 174 (18) | NA |
| Ovarian | 16 (10) | 163 (11) | 5 (3) | 125 (13) | ||
| Melanoma | 2 (1) | 120 (8) | 12 (7) | 61 (6) | ||
| Head & neck: squamous | 13 (8) | 82 (6) | 10 (6) | 67 (7) | ||
| Soft tissue sarcomas | 2 (1) | 97 (7) | 5 (3) | 74 (7) | ||
| Non-small cell lung | 6 (4) | 83 (6) | 15 (9) | 49 (5) | ||
| Breast | 21 (13) | 57 (4) | 9 (6) | 43 (4) | ||
| Uterine | 16 (10) | 50 (3) | 15 (9) | 34 (3) | ||
| Thyroid | 3 (2) | 41 (3) | 3 (2) | 24 (2) | ||
| Pancreatic | 1 (<1) | 39 (3) | 5 (3) | 23 (2) | ||
| Gastric | 2 (1) | 37 (3) | 1 (<1) | 28 (3) | ||
| Neuroendocrine | 2 (1) | 36 (3) | 2 (1) | 30 (3) | ||
| Prostate | 1 (<1) | 35 (2) | 8 (5) | 29 (3) | ||
| Renal | 3 (2) | 33 (2) | 10 (6) | 13 (1) | ||
| Salivary gland | 1 (<1) | 33 (2) | 3 (2) | 26 (3) | ||
| Cervical: squamous | 10 (6) | 23 (2) | 3 (2) | 21 (2) | ||
| Biliary tract | 0 (0) | 27 (2) | 2 (1) | 20 (2) | ||
| Hepatocellular | 0 (0) | 27 (2) | 6 (4) | 16 (2) | ||
| Bladder and urothelial | 3 (2) | 16 (1) | 3 (2) | 9 (<1) | ||
| Head and neck: non-squamous | 3 (2) | 16 (1) | 0 (0) | 13 (1) | ||
| Cervical: adenocarcinoma | 1 (<1) | 18 (1) | 3 (2) | 9 (<1) | ||
| Unknown primary | 2 (1) | 16 (1) | 2 (1) | 13 (1) | ||
| Ewing | 0 (0) | 15 (1) | 1 <1) | 11 (1) | ||
| Small cell lung | 0 (0) | 15 (1) | 3 (2) | 7 (<1) | ||
| Esophageal: adenocarcinoma | 0 (0) | 13 (<1) | 2 (1) | 10 (1) | ||
| Other | 6 (4) | 101 (7) | 7 (4) | 65 (7) |
NA: not applicable
PIK3CA mutations were tested in 1,589 patients.
Patients with simultaneous PIK3CA mutations and PTEN aberrations are included.
PTEN aberrations were tested in 1,157 patients
PIK3CA mutations and PTEN aberrations
Of the 1,656 patients, 1,589 were tested for PIK3CA mutations, 1,157 for PTEN aberrations, and 1,090 for both PIK3CA mutations and PTEN aberrations. PIK3CA mutations were detected in 9% (146/1,589) of patients; PTEN aberrations, in 13% (149/1,157); and simultaneous PIK3CA mutations and PTEN aberrations, in 1% (14/1,090). When analyzing 1,090 patients, who were tested for both PIK3CA mutations and PTEN aberrations, 89 (8%) had PIK3CA mutations, 134 (12%) PTEN aberrations, and 14 (1%) had simultaneous PIK3CA mutations and PTEN aberrations (Figure 1).
Figure 1.
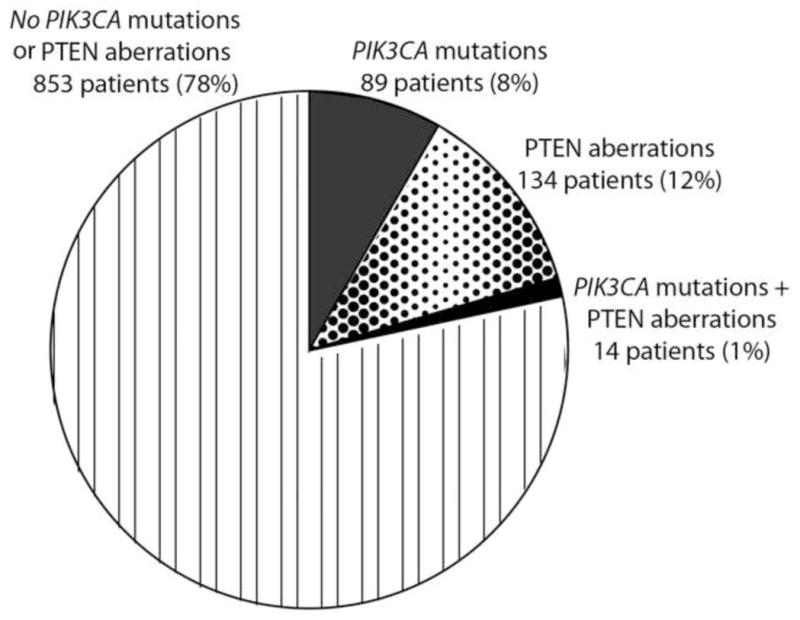
Proportion of PIK3CA mutations and PTEN aberrations in 1,090 patients who had both PIK3CA and PTEN testing.
In 160 patients with PIK3CA mutations, the most frequent mutation was E545K (1633G>A) in 32.5% of patients (52/160), followed by E542K (1624G>A) in 20% of patients (32/160), and H1047R (3140A>G) in 18% of patients (29/160) (Supplementary Table 1).
PIK3CA mutations were not associated with age or ethnicity.
There were 163 patients with PTEN aberrations. These aberrations include loss of staining on immunohistochemistry in 155 patients (1,123 tested for expression, but not for mutations), loss of staining on immunohistochemistry in the absence of PTEN mutations in 2 patients (25 tested for mutations and expression), loss of staining on immunohistochemistry in the presence of PTEN mutations in 3 patients (25 tested for mutations and expression), PTEN mutation in the presence of reduced staining on immunohistochemistry in 1 patient (25 tested for mutations and expression), or PTEN mutations in 2 patients who had no immunohistochemistry performed (9 tested for mutation only). PTEN mutations were most frequent in exon 5 (4/6, 75%).
PTEN aberrations were not associated with gender, age or ethnicity.
Mutations in mitogen-activated protein kinase pathway
Of the 1,656 patients 1,238 were tested for KRAS mutations and 18% (229/1,238) were found to have mutations. The most prevalent was the G12D mutation (35G>A) present in 31% of patients (72/229), G12V mutation (35G>T) in 22% (50/229), G13D mutation (38G>A) in 10% (23/229), G12C (34G>T) in 9% (21/229), and G12A mutation (35G>C) in 8% of patients (18/229).
Of the 1,656 patients 618 were tested for NRAS and 5% (32/618) were found to have mutations. The most prevalent was the Q61K mutation (181C>A) in 25% of patients (8/32), and a Q61L mutation (182_183AA>TG) in 12.5% of patients (4/32).
Of the 1,656 patients, 1,175 were tested for BRAF and 6% (70/1,175) had mutations. The most prevalent was the V600E mutation (1799T>A) in 76% (53/70) of patients, and a V600K mutation (1798_1799GT>AA) in 14% (10/70) of patients.
Mutations in KRAS, NRAS, and BRAF were mutually exclusive with the exception of two patients with malignant melanoma who had simultaneous BRAF and NRAS mutations.
Associations among PIK3CA mutations, PTEN aberrations and MAPK mutations
PIK3CA mutations were more prevalent in patients with KRAS mutations than wild-type (wt) KRAS (42/225, 19% vs. 89/975, 9%; p<0.001; Figure 2).
Figure 2.
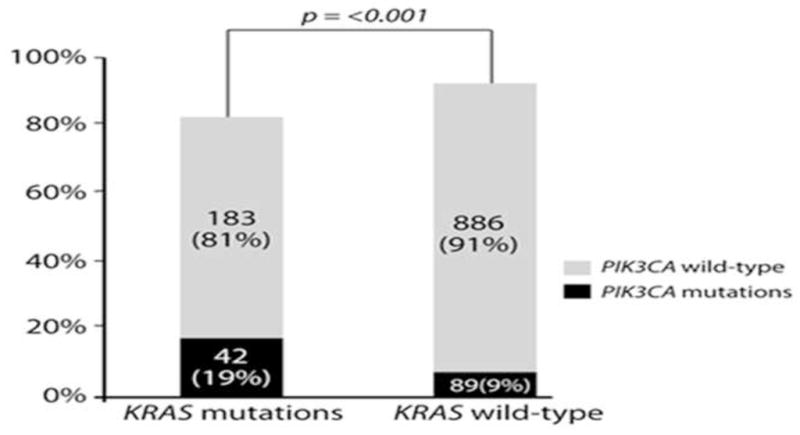
PIK3CA mutations are more frequent in tumors with simultaneous KRAS mutations (42/225, 19% vs. 89/975, 9%; p<0.001).
PIK3CA mutations were not associated with NRAS or BRAF mutations.
Patients with PIK3CA mutations or PTEN aberrations treated with PI3K/AKT/mTOR inhibitors
Response rate
Of the 309 patients with PIK3CA mutations alone (n=146), PTEN aberrations (n=149) and simultaneous PIK3CA mutations and PTEN aberrations (n=14), 136 (44%) patients (PIK3CA mutations, n=76; PTEN aberrations, n=51; PIK3CA mutation and PTEN aberration, n=9) were enrolled in studies that included PI3K/AKT/mTOR inhibitors (Figure 3); 67 of the 309 patients (22%) received other protocol-based experimental therapies, often because PIK3CA/PTEN status was not available at the time of decision making; 106 (34%) were not treated, usually due to ineligibility or patient/doctor preference.
Figure 3.
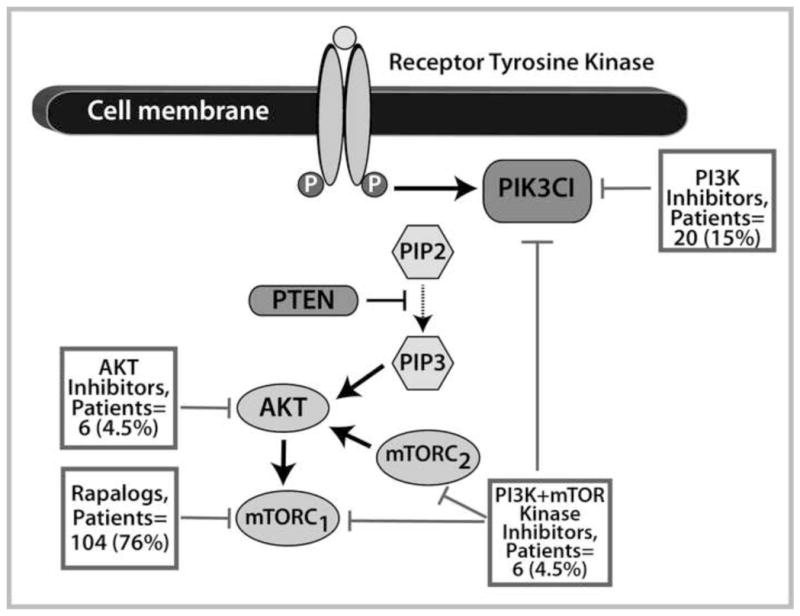
Therapies targeting the PI3K/AKT/mTOR pathway. Most patients (104, 76%) received mTORC1 inhibitor (rapalog)-based therapy, 20 (15%) PI3K inhibitor-based therapy, 6 (4.5%) dual PI3K and mTOR kinase inhibitor-based therapy, and 6 (4.5%) AKT inhibitor-based therapy.
When examining the 136 patients with PIK3CA and/or PTEN aberrations treated with PI3K/AKT/mTOR axis inhibitors, we found that these patients were refractory to a median of 3 prior therapies (range, 1 to 12). Of these 136 patients, 25 (18%) had colorectal cancer, 21 (15%) breast cancer, 18 (13%) endometrial cancer, 14 (10%) ovarian cancer, 11 (8%) squamous cell head and neck cancer, 8 (6%) squamous cell cervical cancer, 7 (5%) renal cancer, 4 (3%) salivary gland cancer, 4 (3%) non-small cell lung cancer, 3 (2%) sarcoma, and 21 (15%) other cancers (adenoid cystic head and neck cancer, adrenocortical carcinoma, anal squamous cell cancer, appendiceal carcinoma, carcinoma of unknown primary, cervical adenocarcinoma, gastric cancer, hepatocellular carcinoma, melanoma, Merkel cell carcinoma, neuroendocrine cancer, pancreatic cancer, papillary thyroid cancer, urothelial carcinoma, and small intestine cancer). Most patients (104, 76%) received mTORC1 inhibitor (rapalog) -based therapy; 20 (15%), PI3K inhibitor-based therapy; 6 (4.5%), dual PI3K and mTOR kinase inhibitor-based therapy; and 6 (4.5%), AKT inhibitor-based therapy (Figure 3). Single-agent therapies were given to 41 (30%) of patients and 95 (70%) received combination therapy (Supplementary Table 2). Combination therapies that included chemotherapy were administered to 49 patients (36%) and a combination of targeted therapies to 46 patients (34%). Of note, 7 (5%) patients received combinations simultaneously targeting the PI3K/AKT/mTOR and MAPK pathways. Overall, 25 (18%, 95% CI 0.13–0.26, Supplementary Table 3) patients achieved a PR defined on line 79(Figure 4) and an additional 9 (7%, 95% CI 0.04–0.12) had stable disease (SD) ≥6 months (rate of SD ≥6 months/PR 25%, 34/136, 95% CI 0.18–0.33). The observed PR rate compared favorably to a complete response [CR]/PR rate of 6% (26/458; 95%CI 0.04–0.08; p<0.001) in 458 patients without known PIK3CA mutations and/or PTEN aberrations treated on the same PI3K/AKT/mTOR protocols (Supplementary Table 4).
Figure 4.
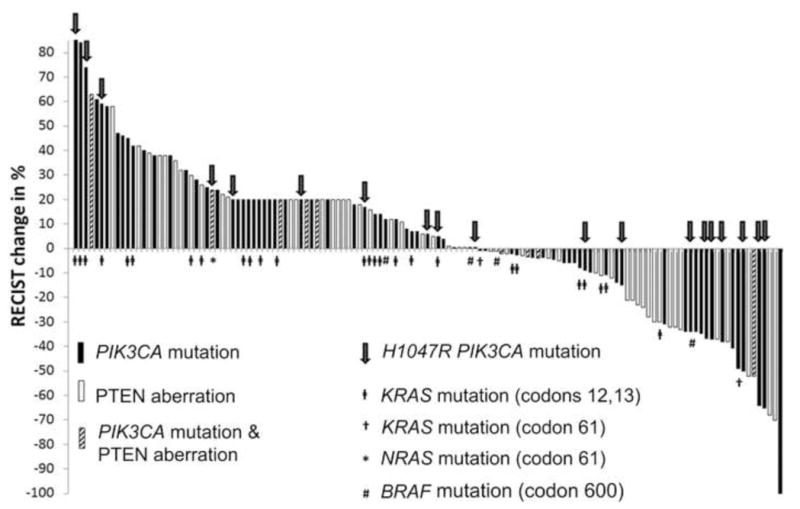
Waterfall plot shows best response for patients with PIK3CA mutations or PTEN aberrations treated with PI3K/AKT/mTOR inhibitors. Of the 136 treated patients, 135 are depicted in the waterfall plot (one patient died of unrelated causes prior to her first restaging). A total of 25 PRs and 33 minor regressions less than PR were observed. The overall PR rate was 18%.
Of the 67 patients with PIK3CA mutations and/or PTEN aberrations who received protocol-based experimental therapies other than PI3K/AKT/mTOR inhibitors, only 3 (4%, 95% CI 0.02–0.12) attained a PR, which was significantly inferior compared to 25 (18%) PRs in 136 patients treated with PI3K/AKT/mTOR inhibitors (p=0.008) (Supplementary Table 4). An additional analysis, which excluded patients with colorectal cancer, showed that of the 52 patients with PIK3CA mutations and/or PTEN aberrations who received protocol-based experimental therapies other than PI3K/AKT/mTOR inhibitors, only 3 (6%, 95% CI 0.02–0.16) attained a PR, which was significantly inferior compared to 25 (23%, 95% CI 0.16–0.31) PRs in 111 patients treated with PI3K/AKT/mTOR inhibitors (p=0.007). In addition, we have shown that patients with breast and gynecological malignancies and PIK3CA mutations can benefit from therapies that include PI3K/AKT/mTOR inhibitors (Janku et al., 2012b) Therefore, we performed an analysis, which excluded patients with gynecological (ovarian, cervical and uterine), breast cancers, and colorectal cancers, and demonstrated that of the 45 patients with PIK3CA mutations and/or PTEN aberrations who received protocol-based experimental therapies other than PI3K/AKT/mTOR inhibitors, 3 (7%, 95% CI 0.02–0.18) attained a PR compared to 8 (17%, 95% CI 0.09–0.30) PRs in 47 patients treated with PI3K/AKT/mTOR inhibitors (p=0.20). Furthermore, we performed an additional analysis on 104 patients with PIK3CA mutations and/or PTEN aberrations, who received treatment with mTORC1 inhibitors (rapalogs). Of these 104 patients, 22 (21%, 95%CI 0.14–0.30) had a PR compared to 3 (4%, 95% CI 0.02–0.12) PRs in 67 patients with PIK3CA mutations and/or PTEN aberrations who received protocol-based experimental therapies other than PI3K/AKT/mTOR inhibitors (p=0.003).
There was no difference among patients with PIK3CA mutations, PTEN aberrations, or both PIK3CA mutations and PTEN aberrations in the rate of PR (14/76, 18% vs. 10/51, 20% vs. 1/9, 11%; p=0.83) and SD ≥6 months/PR (19/76, 25% vs. 14/51, 27% vs. 1/9, 11%; p=0.58) on PI3K/AKT/mTOR inhibitors.
Of 136 patients with PIK3CA mutations and/or PTEN aberrations treated with PI3K/AKT/mTOR inhibitors, there was no PR and only 1 (4%) SD ≥6 months/PR in 25 patients with colorectal cancer compared to 25 (23%, p=0.008) PRs and 33 (30%, p=0.005) SD ≥6 months/PR in 111 patients with other cancers. Also, patients treated with single-agent therapies had lower PR rates (2/41, 5% vs. 23/95, 24%; p=0.007) and lower rates of SD ≥6 months/PR (4/41, 10% vs. 30/95, 32%; p=0.009) than patients treated with combinations. There was no difference in PR rate in patients with 3 or fewer prior therapies compared to more than 3 prior therapies (18/80, 23% vs. 7/56, 13%; p=0.18); however, patients with 3 or fewer therapies had a higher SD≥6 months/PR rate (25/80, 31% vs. 9/56, 14%; p=0.047).
Of the 136 treated patients with PIK3CA mutations or PTEN aberrations, 109 (80%) had available tissue for KRAS mutation testing. Of the 26 patients with PIK3CA mutations and/or PTEN aberrations and simultaneous KRAS mutations in codon 12 or 13, only 1 (4%) had a PR compared to 20 (24%) PRs in 83 patients with PIK3CA mutations and/or PTEN aberrations without KRAS codon 12 or 13 mutations (p=0.023). Similarly, only 1 (4%) patient with PIK3CA mutations and/or PTEN aberrations and simultaneous KRAS mutations in codon 12 or 13 had SD≥6 months/PR compared to 27 (33%) SD≥6 months/PR in 83 patients with PIK3CA mutations and/or PTEN aberrations without KRAS codon 12 or 13 mutations (p=0.004).
In 85 patients with PIK3CA mutations treated with PI3K/AKT/mTOR inhibitors, there were 7 (35%) PRs and 9 (45%) SD≥6 months/PR in 20 patients with H1047R mutations compared to 8 (12%, p=0.039) PRs and 11 (17%) SD≥6 months/PR in 65 patients with other PIK3CA mutations (p=0.016).
Multicovariate analysis
We created a multicovariate logistic regression model for 203 patients with PIK3CA mutations and/or PTEN aberrations, which included 136 patients treated with PI3K/AKT/mTOR inhibitors and 67 patients treated with other protocol-based therapies. This model included histology (colorectal vs. others), type of therapy (combination vs. single agent), and treatment with PI3K/AKT/mTOR inhibitors (yes vs. no), which were significant factors identified on univariate analysis (data not shown). Treatment with PI3K/AKT/mTOR inhibitors was the only independent factor predicting a PR (odds ratio [OR] 4.34, 95% CI 1.23–15.24; p=0.02; Table 2).
Table 2.
Multicovariate model for response per RECIST (logistic regression) , progression-free survival (Cox regression), and overall survival (Cox regression) in patients (n=203) with PIK3CA mutations and/or PTEN aberrations treated with PI3K/AKT/mTOR inhibitors (n=136) or other systemic protocol-based therapies (n=67).
| Outcome measure | Variable | Odds ratio or Hazard Ratio1 | 95% Confidence interval | P value |
|---|---|---|---|---|
| Partial response (RECIST)2 | Colorectal cancer vs. other cancers | Not calculated3 | Not calculated2 | |
| Combination therapies vs. single agents | 2.85 | 0.92–8.84 | 0.07 | |
| PI3K/AKT/mTOR vs. other protocols | 4.34 | 1.23–15.24 | 0.02 | |
| Progression- free survival | > 3 prior vs. ≤ 3 prior therapies | 1.22 | 0.88–1.71 | 0.24 |
| Colorectal cancer vs. other cancers | 1.83 | 1.25–2.68 | 0.002 | |
| Combination therapies vs. single agents | 0.70 | 0.51–0.97 | 0.03 | |
| PI3K/AKT/mTOR vs. other protocols | 1.06 | 0.76–1.48 | 0.75 | |
| Overall survival | > 3 vs. ≤ 3 prior therapies | 1.12 | 0.78–1.59 | 0.54 |
| Colorectal cancer vs. other cancers | 1.21 | 0.78–1.87 | 0.40 | |
| Combination therapies vs. single agents | 0.85 | 0.59–1.21 | 0.36 | |
| PI3K/AKT/mTOR vs. other protocols | 1.45 | 0.99–2.12 | 0.06 |
Odds ratio was calculated for response. Higher odds ratio indicates greater chance of response. Hazard ratio was calculated for progression-free and overall survival. Higher hazard ratio indicates greater chance of progression or death.
RECIST, Response Evaluation Criteria in Solid Tumors
Odds ratio and 95% confidence interval were not calculated because none of the patients with colorectal cancer attained a partial response
In addition, a multicovariable logistic regression model within the subgroup of patients with PIK3CA mutations or PTEN aberrations treated with PI3K/AKT/mTOR inhibitors, which included histology (colorectal vs. others), type of therapy (combination vs. single agent), and prior therapies (up to 3 vs. more than 3) demonstrated that treatment with combination therapies was the only independent factor predicting a PR with PI3K/AKT/mTOR inhibitors (OR 5.31, 95% CI 1.16–24.25; p=0.03) and SD≥6 months/PR (OR 4.99, 95% CI 1.39–17.89; p=0.01; Table 3). A separate multicovariable logistic regression model with 109 patients having PIK3CA mutations or PTEN aberrations treated with PI3K/AKT/mTOR inhibitors, who were tested for KRAS mutations, which included histology (colorectal vs. others), KRAS mutation (codons 12 or 13 vs. others), type of therapy (combination vs. single agent) and prior therapies (up to 3 vs. more than 3) showed a trend for combination therapies (OR 4.33, 95% CI 0.90–20.71; p=0.07) predicting a PR and a trend for combination therapies (OR 3.78, 95% CI 0.99–14.32; p=0.05) and absence of KRAS mutation (OR 0.15, 95% CI 0.02–1.27; p=0.08) predicting SD≥6 months/PR.
Table 3.
Multicovariate model for response/prolonged stable disease per RECIST (logistic regression), progression-free survival (Cox regression), and overall survival (Cox regression) in patients (n=136) with PIK3CA mutations and/or PTEN aberrations treated with PI3K/AKT/mTOR inhibitors.
| Outcome measure | Variable | Odds ratio/hazard ratio1 | 95% Confidence interval | P value |
|---|---|---|---|---|
| Partial response (RECIST)2 | Colorectal cancer vs. other cancers | Not calculated3 | Not calculated3 | |
| Combination therapies vs. single agents | 5.31 | 1.16–24.25 | 0.03 | |
| > 3 vs. ≤ 3 prior therapies | 0.67 | 0.25–1.82 | 0.43 | |
| Partial response and stable disease ≥ 6 months (RECIST) 2 | Colorectal cancer vs. other cancers | 0.13 | 0.02–1.07 | 0.06 |
| Combination therapies vs. single agents | 4.99 | 1.39–17.89 | 0.01 | |
| > 3 vs. ≤ 3 prior therapies | 0.47 | 0.18–1.19 | 0.11 | |
| Progression-free survival | Colorectal cancer vs. other cancers | 1.59 | 0.98–2.59 | 0.06 |
| Combination therapies vs. single agents | 0.54 | 0.35–0.82 | 0.004 | |
| Overall survival | Colorectal cancer vs. other cancers | 1.34 | 0.79–2.26 | 0.28 |
| Combination therapies vs. single agents | 0.78 | 0.50–1.19 | 0.25 |
Odds ratio was calculated for a partial response and stable disease ≥ 6. Hazard ratio was calculated for progression-free and overall survival.
RECIST, Response Evaluation Criteria in Solid Tumors.
Odds ratio and 95% confidence interval were not calculated because none of the patients with colorectal cancer attained a partial response.
Progression-free survival
The median progression-free survival (PFS) for all patients with PIK3CA mutations and/or PTEN aberrations treated with PI3K/AKT/mTOR inhibitors was 2.5 months (95% CI 1.8–3.2). There was no significant difference among patients with PIK3CA mutations (n=76), PTEN aberrations (n=51), or both PIK3CA mutations and PTEN aberrations (n=9) in median PFS (2.3 months, 95% CI 1.7–2.9 vs. 3.5 months, 95% CI 1.5–5.5 vs. 2.8 months, 95% CI 0–5.7; p=0.83).
Patients (n=67) with PIK3CA mutations and/or PTEN aberrations who received protocol-based experimental therapies other than PI3K/AKT/mTOR inhibitors, had a similar median PFS as patients (n=136) with PIK3CA mutations and/or PTEN aberrations treated with PI3K/AKT/mTOR-based therapies (1.9 months, 95% CI 0.9–2.9 vs. 2.5 months, 95% CI 1.8–3.2; p=0.70). In addition, an analysis that excluded patients with colorectal cancers showed that patients (n=52) with PIK3CA mutations and/or PTEN aberrations who received protocol-based experimental therapies other than PI3K/AKT/mTOR inhibitors, had a similar median PFS as patients (n=111) with PIK3CA mutations and/or PTEN aberrations treated with PI3K/AKT/mTOR-based therapies (2.7 months, 95% CI 0.8–4.5 vs. 2.8 months, 95% CI 1.8–3.8; p=0.93).
Patients (n=25) with PIK3CA mutations and/or PTEN aberrations and colorectal cancer treated with PI3K/AKT/mTOR inhibitors had a shorter median PFS than patients (n=111) with PIK3CA mutations and/or PTEN aberrations and other histologies (1.8 months, 95% CI 1.5–2.1 vs. 2.8 months, 95% CI 1.8–3.8; p=0.003). Patients (n=95) with PIK3CA mutations and/or PTEN aberrations treated with combination therapies that included PI3K/AKT/mTOR inhibitors had a longer median PFS than patients (n=41) treated with single-agent PI3K/AKT/mTOR-based therapies (3.0 months, 95% CI 2.0–4.0 vs. 1.8 months, 95% CI 1.6–2.0; p<0.001; Figure 5A). There was no difference in median PFS in patients (n=80) with 3 or fewer prior therapies compared to patients (n=56) with more than 3 prior therapies (2.5 months, 95% CI 1.8–3.2 vs. 2.6 months, 95% CI 1.6–3.6; p=0.40).
Figure 5.
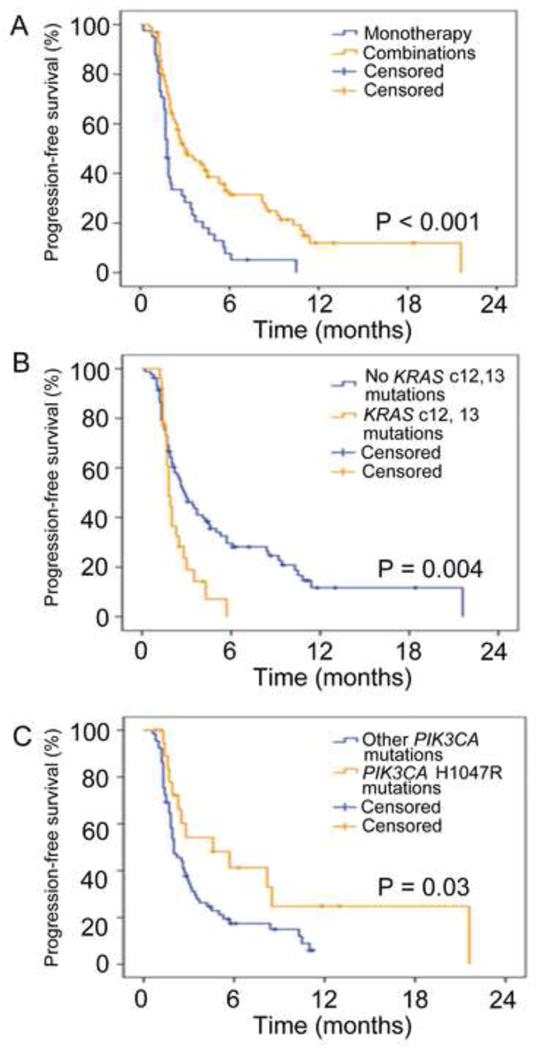
Kaplan-Meier plot for progression-free survival (PFS). Tick marks represent patients who were progression-free at last follow up and are censored at that point. A. Patients with PIK3CA mutations and/or PTEN aberrations treated with combination therapies (yellow, n=95) compared to patients treated with single-agent therapies (blue, n=41) had a longer median PFS than (3.0 months, 95% CI 2.0–4.0 vs. 1.8 months, 95% CI 1.6–2.0; p<0.001). B. Patients with PIK3CA mutations and/or PTEN aberrations and simultaneous KRAS mutations in codon 12 or 13 (yellow) compared to patients without KRAS mutations in codon 12 or 13 (blue) had a shorter median PFS compared to 81 (1.8 months, 95% CI 1.6–2.0 vs. 2.9 months, 95% CI 1.9–3.9; p=0.004). C. Patients with a H1047R mutation (yellow) compared to patients with other PIK3CA mutations (blue) had a longer median PFS (4.6 months, 95% CI 0.6–8.6 vs. 2 months, 1.6–2.4; p=0.03).
Of the 109 treated patients with PIK3CA mutations and/or PTEN aberrations who had available tissue for KRAS mutation testing, 26 patients with PIK3CA mutations and/or PTEN aberrations and simultaneous KRAS mutations in codon 12 or 13 had a shorter median PFS compared to 83 patients without KRAS mutations in codon 12 or 13 (1.8 months, 95% CI 1.6–2.0 vs. 2.9 months, 95% CI 1.9–3.9; p=0.004) when treated with PI3K/AKT/mTOR inhibitors (Figure 5B).
In 85 patients with PIK3CA mutations treated with PI3K/AKT/mTOR inhibitors, 20 patients with a H1047R mutation compared to patients with other PIK3CA mutations had a longer median PFS (4.6 months, 95% CI 0.6–8.6 vs. 2 months, 1.6–2.4; p=0.03; Figure 5C).
Multicovariate analysis
Similarly, we created a multicovariate Cox regression model for 203 patients with PIK3CA mutations and/or PTEN aberrations, which included 136 patients treated with PI3K/AKT/mTOR inhibitors and 67 patients treated with other protocol-based therapies. This model included number of prior therapies (up to 3 vs. more than 3), histology (colorectal vs. others), type of therapy (combination vs. single agent), and treatment with PI3K/AKT/mTOR inhibitors (yes vs. no) that were either significant factors on univariate analysis (data not shown) or were anticipated to be important. Treatment with combinations predicted longer PFS (hazard ratio [HR] 0.70, 95% CI 0.51–0.97; p=0.03), while patients with colorectal cancer had a shorter PFS (HR 1.83, 95% CI 1.25–2.68; p=0.002; Table 2).
In addition, a multicovariable Cox regression model in patients with PIK3CA mutations or PTEN aberrations treated with PI3K/AKT/mTOR inhibitors, which included histology (colorectal vs. others), type of therapy (combination vs. single agent), demonstrated longer PFS in patients treated with combinations (HR 0.54, 95% CI 0.35–0.82; p=0.004) and patients with colorectal cancer had a trend to shorter PFS (HR 1.59, 95% CI 0.98–2.59; p=0.06;Table 3). A separate multicovariable Cox regression model with 109 patients with PIK3CA mutations or PTEN aberrations treated with PI3K/AKT/mTOR inhibitors tested for KRAS mutations, which included histology (colorectal vs. others), KRAS mutation (codons 12 and 13 vs. others), and type of therapy (combination vs. single agent), showed a strong trend to longer PFS for patients treated with combinations (HR 0.62, 95% CI 0.39–1.00; p=0.05).
Overall survival
The median overall survival (OS) for all 136 patients with PIK3CA mutations and/or PTEN aberrations treated with PI3K/AKT/mTOR inhibitors was 7.7 months (95% CI 5.6–9.8). There was no difference among patients with PIK3CA mutations, PTEN aberrations, or both PIK3CA mutations and PTEN aberrations in median OS (7.5 months, 95% CI 4.3–10.7 vs. 7.7 months, 95% CI 6.0–9.4 vs. 14.9 months, 95% CI 6.3–23.5; p=0.56).
Patients (n=67) with PIK3CA mutations and/or PTEN aberrations who received protocol-based experimental therapies other than PI3K/AKT/mTOR inhibitors, had a trend to longer median OS compared to patients (n=136) with PIK3CA mutations and/or PTEN aberrations treated with PI3K/AKT/mTOR-based therapies (8.9 months, 95% CI 2.7–15.1 vs. 7.7 months, 95% CI 5.6–9.8; p=0.06). In addition, an analysis excluding patients with colorectal cancer demonstrated that patients (n=52) with PIK3CA mutations and/or PTEN aberrations who received protocol-based experimental therapies other than PI3K/AKT/mTOR inhibitors had a similar median OS as patients (n=111) with PIK3CA mutations and/or PTEN aberrations treated with PI3K/AKT/mTOR-based therapies (7.1 months, 95% CI 2.3–11.9 vs. 7.7 months, 95% CI 5.5–9.9; p=0.17).
Also, there was no difference in median OS between patients (n=25) with PIK3CA mutations and/or PTEN aberrations and colorectal cancer treated with PI3K/AKT/mTOR inhibitors compared to patients (n=111) with other histologies (8.9 months, 95% CI 4.3–13.5 vs. 7.7 months, 95% CI 5.4–9.9; p=0.18). Patients (n=95) with PIK3CA mutations and/or PTEN aberrations treated with combination therapies that included PI3K/AKT/mTOR inhibitors had a similar median OS as patients (n=41) treated with single-agent PI3K/AKT/mTOR inhibitor-based therapies (8.0 months, 95% CI 5.7–10.2 vs. 7.5 months, 95% CI 4.1–10.9; p=0.17). Finally, patients (n=80) with PIK3CA mutations and/or PTEN aberrations who received up to 3 prior therapies had a similar median OS as patients (n=56) who received more than 3 therapies (7.4 months, 95% CI 4.7–10.1 vs. 8.2 months, 95% CI 5.4–11.0; p=0.98) prior to treatment with PI3K/AKT/mTOR inhibitors.
Of the 109 patients with PIK3CA mutations and/or PTEN aberrations treated with PI3K/AKT/mTOR inhibitors who had tissue available for KRAS mutation testing, 26 patients with PIK3CA mutations and/or PTEN aberrations and simultaneous KRAS mutations in codon 12 or 13 had a similar median OS compared to 83 patients with PIK3CA mutations and/or PTEN aberrations without KRAS mutations in codon 12 or 13 (7.5 months, 95% CI 3.7–11.3 vs. 8.2 months, 95% CI 4.5–11.9; p=0.25).
In 85 patients with PIK3CA mutations treated with PI3K/AKT/mTOR inhibitors, 20 patients with a H1047R mutation compared to patients with other PIK3CA mutations had a trend to a longer median OS (10.0 months, 95% CI 1.9–18.1 vs. 8.2 months, 4.2–12.2; p=0.15).
Multicovariate analysis
We created a multicovariate Cox regression model for 203 patients with PIK3CA mutations and/or PTEN aberrations, which included 136 patients treated with PI3K/AKT/mTOR inhibitors and 67 patients treated with other protocol-based therapies. This model included number of prior therapies (up to 3 vs. more than 3), histology (colorectal vs. others), type of therapy (combination vs. single agent), and treatment with PI3K/AKT/mTOR inhibitors (yes vs. no), which were either close to significance on univariate analysis (data not shown) or were anticipated to be important. None of the factors independently predicted OS; however, patients treated with experimental therapies other than PI3K/AKT/mTOR inhibitors had a trend toward a longer OS (HR 0.69, 95% CI 0.47–1.01; p=0.06; Table 2).
In addition, a multicovariable Cox regression model, which included, histology (colorectal vs. others), type of therapy (combination vs. single agent), demonstrated that none of the tested variables predicted survival (Table 3). Similarly, in a separate multicovariable Cox regression model with 109 patients tested for KRAS mutations, which included histology (colorectal vs. others), KRAS mutation (codons 12 and 13 vs. others) and type of therapy (combination vs. single agent), none of the tested variables predicted survival.
DISCUSSION
In our study, we observed that PIK3CA mutations and/or PTEN aberrations can be detected in approximately 20% of patients with diverse advanced cancers (Figure 1). In agreement with previous reports, the most frequent PIK3CA mutations were E545K (32.5%), E542K (20%) in the helical domain and H1047R (18%) in the kinase domain.(Forbes et al., 2011; Janku et al., 2012a) PTEN aberrations were mostly determined by loss of staining on immunohistochemistry (95% of patients with PTEN aberration) as only 5% of patients were tested for PTEN mutations. Anecdotally, we noticed that PTEN mutations could occasionally be detected without the loss of staining on immunohistochemistry, which is in agreement with previous publications.(Cheung et al., 2011)
Our group and others showed that, in colorectal and gynecological cancers, PIK3CA mutations often coexist with mutations in the MAPK pathway such as KRAS and BRAF mutations, which can abrogate response to PI3K/AKT/mTOR pathway inhibitors.(De Roock et al., 2010; Di Nicolantonio et al., 2010; Engelman et al., 2008; Ihle et al., 2009; Janku et al., 2011a; Janku et al., 2012b) The current study confirms preclinical findings demonstrating that mutations in the MAPK pathway are associated with an attenuated response rate to PI3K/AKT/mTOR inhibitors.(Di Nicolantonio et al., 2010; Engelman et al., 2008; Ihle et al., 2009) Furthermore, aberrations in the PI3K/AKT/mTOR pathway often coexist with aberrations in the MAPK pathway.(De Roock et al., 2010; Janku et al., 2011a) Indeed, PIK3CA mutations compared to wt PIK3CA were associated with an increased prevalence of coexisting KRAS (19% vs. 9%; p<0.001; Figure 2). Interestingly, PTEN aberrations were not associated with KRAS mutations; however, when we grouped all tested MAPK mutations (KRAS, NRAS, BRAF) together, patients with PTEN aberrations were more likely to have coexisting MAPK mutations than patients without PTEN aberrations (18% vs. 11%; p=0.047).
Overall, 44% (136/309) of heavily pretreated patients with PIK3CA mutations or PTEN aberrations were treated with therapies that included PI3K/AKT/mTOR inhibitors, which consisted of rapalog-based regimens in 76% of them. The overall PR rate was 18% (in addition, 7% achieved SD≥6 months; Figure 4) and this response rate compared favorably to a CR/PR rate of 6% in patients without known PIK3CA mutations or PTEN aberrations, who received treatment on the same protocols (p<0.001), and also to a PR rate of 4% in patients with PIK3CA mutations and/or PTEN aberrations, who received experimental therapies without PI3K/AKT/mTOR inhibitors (p=0.008). In addition, treatment with PI3K/AKT/mTOR inhibitors was found, in multicovariate analysis, to be an independent predictive factor for a PR in patients (n=203) with PIK3CA mutations and/or PTEN aberrations treated with PI3K/AKT/mTOR or other protocol-based therapies (OR 4.34, 95% CI 1.23–15.24; p=0.02; Table 2) although it did not translate to prolonged PFS and OS.
There was no difference in PR rate (18% vs. 20% vs. 11%; p=0.83), PFS (2.3 months vs. 3.5 months vs. 2.8 months; p=0.83) and OS (7.5 months vs. 7.7 months vs. 14.9 months; p=0.56) on therapies with PI3K/AKT/mTOR inhibitors between patients with PIK3CA mutations, PTEN aberrations or both, respectively. None of the patients with PIK3CA mutations and/or PTEN aberrations and colorectal cancer attained a PR on therapies with PI3K/AKT/mTOR inhibitors compared to 23% of patients with other histologies (p=0.008). Additionally, patients with colorectal cancer demonstrated a shorter PFS compared to other histologies treated with PI3K/AKT/mTOR inhibitors (1.8 months vs. 2.8 months; p=0.003), which suggests that specific molecular aberrations can have different biological and therapeutic consequences in different disease types. Alternatively, it is plausible that aberrations in the PI3K/AKT/mTOR axis more frequently coexist with MAPK aberrations in colorectal cancer than in other histologies.(Janku et al., 2011a) Interestingly, Dienstmann et al. demonstrated that only 1 (2%) of 42 patients with colorectal cancer and PIK3CA mutations (n=10) or PTEN loss (n=32) responded to PI3K pathway inhibitors.(Dienstmann et al., 2012) Another example showing how the same mutation can have diverse implications in different contexts is the BRAF V600E mutation, which is highly predictive of response, PFS and OS to BRAF inhibitors in melanoma but not in colorectal cancer.(El-Osta et al., 2011; Flaherty et al., 2010; Kopetz et al., 2010) In addition, HER2 amplification or overexpression predicts PFS and OS when HER2 targeting therapies are used for treatment in breast and gastric cancers, but not necessarily in other cancers.(Bang et al., 2010; Galsky et al., 2012) On the other hand, for many malignancies, the presence of molecular aberrations predicts response across several histologies, with BRAF mutations predicting response to BRAF inhibitors in melanoma, papillary thyroid cancer and hairy cell leukemia.(Dietrich et al., 2012; Falchook et al., 2012) Similarly, in our study, in patients with PIK3CA mutations and/or PTEN aberrations, responses to PI3K/AKT/mTOR inhibitors were seen across all histologies except for colorectal cancer.
Patients with PIK3CA mutations and/or PTEN aberrations treated with combination therapies that included PI3K/AKT/mTOR inhibitors had higher PR rates (24% vs. 5%; p=0.007) and longer PFS (3.0 months vs. 1.8 months; p<0.001; Figure 5A) than patients treated with single-agent PI3K/AKT/mTOR inhibitors. Combinations were also used frequently in the wt PIK3CA group, and the PR/CR rate was significantly lower, suggesting that factors other than the use of combinations mediates response. In addition, the higher PR rate with combinations is not unexpected as combinations have shown more benefit in multiple preclinical models and clinical studies.(Engelman et al., 2008; Janku et al., 2012b; Wee et al., 2009) Single-agent inhibition of the PI3K/AKT/mTOR pathway is often cytostatic rather than cytotoxic, and activation of compensatory pathways by other molecular aberrations can lead to therapeutic resistance.(Faber et al., 2009; Wee et al., 2009) Alternatively, sensitivity to single-agent inhibition can be dependent on BIM (a pro-apoptotic Bcl-2 family protein) levels; low levels of BIM preclude cancer cells from undergoing apoptosis in response to targeted therapy.(Faber et al., 2011; Ng et al., 2012) In addition, the efficacy of single-agent therapies can be compromised because of underlying tumor heterogeneity, which can potentially be overcome with combination therapies.(Gerlinger et al., 2012)
In agreement with the hypothesis that KRAS mutations can induce resistance to PI3K/AKT/mTOR pathway inhibitors, we observed that patients with PIK3CA mutations and/or PTEN aberrations and simultaneous KRAS mutations in codon 12 or 13 compared to patients with PIK3CA mutations and without KRAS mutations in codon 12 and 13 had a significantly lower PR rate (4% vs. 24%; p=0.023) and shorter median PFS (1.8 months vs. 2.9 months; p=0.004; Figure 5B); however, these findings should be interpreted with caution since the presence of KRAS mutations did not reach significance as an independent factor predicting response or lack thereof in multicovariate analysis.
Preclinical data and our preliminary clinical data suggested that the PIK3CA H1047R mutation compared to others can be a stronger driver for tumor development and can be associated with better efficacy in PI3K targeting.(Bader et al., 2006; Janku et al., 2013; Matthews et al., 2011; Ross et al., 2012) We observed that patients with a H1047R mutation compared to patients with other PIK3CA mutations had a higher PR rate (35% vs. 12%; p=0.039), higher SD≥6 months/PR rate (45% vs. 17%; p=0.016) and longer PFS (4.6 months vs. 2 months; p=0.03; Figure 5C).
Our study has several important limitations. First, although multicovariate analysis showed that the only independent factor predicting response in patients with tumors and PIK3CA mutations and/or PTEN aberrations was treatment with PI3K/AKT/mTOR inhibitors, our analysis was performed retrospectively and it was not randomized. Second, we included diverse cancers; however, the latter could suggest that the conclusions are generalizable across histologies. Third, molecular analysis was usually performed on archived tumor tissue, which was obtained at a variety of time points in relationship to administration of treatment. This study should therefore be considered hypothesis generating, and prospective validation of key findings will be needed.
In conclusion, we have demonstrated that screening for PIK3CA mutations, PTEN aberrations and MAPK mutations can identify a subset of patients with advanced, heavily pretreated cancers who respond to therapeutic targeting with PI3K/AKT/mTOR pathway inhibitors. Patients with H1047R mutations did especially well with a SD≥6 months/PR rate of 75%, albeit with only a small number of patients treated (n = 20). The observed PR rate and even more so PFS falls short compared to some other targeted therapies such as EGFR inhibitors in EGFR-mutant NSCLC, BRAF inhibitors in BRAF-mutant melanoma, or imatinib in BCR-ABL rearranged CML.(Druker et al., 2001; Falchook et al., 2012; Flaherty et al., 2010; Lynch et al., 2004) This can be partially explained by the presence of simultaneous KRAS mutations; however, other factors such as insufficient target inhibition, activating feedback loops, pathway circumvention, or alternate mechanism of pathway activation can be involved. Importantly, in the case of CML, treatment early in the disease was key to improving PFS and OS; when imatinib is given to patients with blast transformation, a disease stage that can be viewed as analogous to metastatic disease in solid tumors, only a minority of patients respond and survival benefit is measured in months rather than years (Westin and Kurzrock, 2012). However, even with these limitations drugs targeting the PI3K/AKT/mTOR pathway still make an impact, with a PR rate tripled (18% vs. 6%) in patients with PIK3CA mutations or PTEN aberrations compared to patients with no aberrations in PIK3CA or PTEN. Nevertheless, the treatment with a PI3K/AKT/mTOR pathway inhibitor may not be sufficient and, therefore, the improvement in the PR rate does not translate to prolonged PFS. Collectively, these observations warrant further prospective investigation, especially since many PI3K/AKT/mTOR inhibitors are now entering the clinical arena.
METHODS
Patients
PIK3CA mutations and PTEN aberrations were retrospectively investigated in consecutive patients with advanced tumors and available tissue referred to the Clinical Center for Targeted Therapy at MD Anderson for clinical trials of targeted therapeutic agents starting in October 2008. The registration of patients in the database, pathology assessment, and mutation analysis were performed at MD Anderson. The study and all treatments were conducted in accordance with MD Anderson Institutional Review Board guidelines.
Tumor tissue analyses
PIK3CA mutations and PTEN aberrations were investigated in archival formalin-fixed, paraffin-embedded tissue blocks obtained from diagnostic and/or therapeutic procedures from primary or metastatic sites. All histologies were centrally reviewed at MD Anderson. Mutation testing was performed in the Clinical Laboratory Improvement Amendment–certified Molecular Diagnostic Laboratory within the Division of Pathology and Laboratory Medicine at MD Anderson. DNA was extracted from microdissected paraffin-embedded tumor sections and analyzed using a polymerase chain reaction-based DNA sequencing method for PIK3CA mutations in codons 532–554 of exon 9 (helical domain) and codons 1011–1062 of exon 20 (kinase domain). This analysis encompassed the mutation hot spot regions of the PIK3CA proto-oncogene denoted by Sanger sequencing, following amplification of 276 bp and 198 bp amplicons, respectively, utilizing primers designed by the MD Anderson Molecular Diagnostic Laboratory. Since January 2011, the assay has been changed to mass spectrometric detection (Sequenom MassARRAY) to screen for the mutational hot spots in exon 1 (Q60K, R88Q, E110K and K111N), exon 4 (N345K), exon 6 (S405S), exon 7 (E418K, C420R, E453K), exon 9 (P539R, E542 [base 1 and 2], E545 [all 3 bases] and Q546 [base 1 and 2]), exon 18 (F909L) and exon 20 (Y1021 [base 1 and 2], T1025 [base 1], M1043I, M1043V, A1046V, H1047Y, H1047R, H1047L, G1049R). The mutations identified during the initial screening were confirmed by Sanger sequencing assay. The lower limit of detection is approximately 10%. PTEN mutations were detected in exons 1–9 using PCR-based DNA sequencing and the lower limit of detection was approximately 20%. PTEN expression was tested with immunohistochemistry using the monoclonal mouse anti-human antibody clone 6H2.1 (Dako ®, Carpinteria, CA, USA) and complete loss of staining was classified as PTEN loss. Whenever possible, additional MAPK mutation analyses for KRAS, NRAS codons 12, 13, and 61 mutations of exons 1–2 and BRAF mutations in exon 15 were carried out using PCR-based DNA sequencing.(Zuo et al., 2009) The lower limit of detection was approximately 20%.
Treatment and evaluation
Assignment to a clinical trial was determined after clinical, laboratory, and pathologic data from all available patient records were reviewed. Consecutive patients who had tumor tissue that could be tested or had been tested with underlying PIK3CA mutations and/or a PTEN aberration were enrolled, whenever possible, in clinical trials that included inhibitors of the PI3K/AKT/mTOR pathway. Treatment continued until disease progression or unacceptable toxicity occurred. Treatment was carried out according to the specific requisites in the treatment protocols selected.
Assessments, including history, physical examination, and laboratory evaluations, were performed as specified in each protocol, typically before the initiation of therapy, weekly during the first cycle, and then, at a minimum, at the beginning of each new treatment cycle. Efficacy was assessed from computed tomography (CT) scans and/or magnetic resonance imaging (MRI) at baseline before treatment initiation and then approximately every 2 cycles (6–8 weeks). All radiographs were read in the Department of Radiology and reviewed in the Department of Investigational Cancer Therapeutics tumor measurement clinic at MD Anderson. Responses were categorized per RECIST criteria and were reported as best response.(Therasse et al., 2000) In brief, a complete response (CR) was defined as the disappearance of all measurable and non-measurable disease; partial response (PR) was defined as at least a 30% decrease in the sum of the longest diameter of measurable target lesions; progressive disease (PD) was defined as at least a 20% increase in the sum of the longest diameter of measurable target lesions, or unequivocal progression of a non-target lesion, or the appearance of a new lesion; and stable disease (SD) was defined as neither sufficient shrinkage to qualify for PR nor sufficient increase to qualify for PD.
Statistical analysis
Statistics were verified by our statistician (JJL). Two-way contingency tables were formed to summarize the relationship between two categorical variables. Fisher’s exact test was used to assess the association among categorical variables and mutation status. Wilcoxon rank-sum test was applied to assess the association among continuous variables and mutation status. Multicovariable logistic regression analysis was applied to identify the multiple predictors associated with the response outcomes and number of prior therapies, histology, type of therapy, PIK3CA mutations, PTEN aberrations and MAPK (KRAS, NRAS, BRAF) mutations, and others. Progression-free survival (PFS) was defined as the time interval from the start of therapy to the first observation of disease progression or death, whichever occurred first. Patients alive and without disease progression were censored at the last follow-up date. Overall survival (OS) was defined as the time interval from the start of therapy to the date of death or the date of last follow up, whichever occurred first. OS and PFS were estimated using the method of Kaplan and Meier and were compared among the subgroups of patients using a log-rank test.(Kaplan, 1958) Cox proportional hazards regression models were fit to assess the association between patient characteristics and PFS or OS.(Cox, 1972) All tests were two-sided, and P values less than 0.05 were considered statistically significant. All statistical analyses were carried out using SPSS 19 computer software (SPSS Chicago, IL).
Supplementary Material
Highlights.
PIK3CA mutations and/or PTEN aberrations are frequent in diverse advanced cancers
Testing for PIK3CA and PTEN aberrations can predict benefit of PI3K/mTOR inhibitors
This work further supports accelerated use of biomarker-driven trials in cancer
Acknowledgments
Financial support: Supported by Grant Number RR024148 from the National Center for Research Resources, a component of the NIH Roadmap for Medical Research (http://nihroadmap.nih.gov/clinicalresearch/overview-translational.asp).
We thank Ms. Joann Aaron for scientific review and editing of this article. This study was supported in part by Grant Number RR024148 from the National Center for Research Resources, a component of the NIH Roadmap for Medical Research (http://nihroadmap.nih.gov/clinicalresearch/overview-translational.asp).
Footnotes
CONFLICT OF INTEREST
Filip Janku has research support from Novartis. Razelle Kurzrock has research support from GlaxoSmithKline, Novartis, Merck, and Bayer.
Publisher's Disclaimer: This is a PDF file of an unedited manuscript that has been accepted for publication. As a service to our customers we are providing this early version of the manuscript. The manuscript will undergo copyediting, typesetting, and review of the resulting proof before it is published in its final citable form. Please note that during the production process errors may be discovered which could affect the content, and all legal disclaimers that apply to the journal pertain.
References
- Bader AG, Kang S, Vogt PK. Cancer-specific mutations in PIK3CA are oncogenic in vivo. Proc Natl Acad Sci U S A. 2006;103:1475–1479. doi: 10.1073/pnas.0510857103. [DOI] [PMC free article] [PubMed] [Google Scholar]
- Bang YJ, Van Cutsem E, Feyereislova A, Chung HC, Shen L, Sawaki A, Lordick F, Ohtsu A, Omuro Y, Satoh T, et al. Trastuzumab in combination with chemotherapy versus chemotherapy alone for treatment of HER2-positive advanced gastric or gastro-oesophageal junction cancer (ToGA): a phase 3, open-label, randomised controlled trial. Lancet. 2010;376:687–697. doi: 10.1016/S0140-6736(10)61121-X. [DOI] [PubMed] [Google Scholar]
- Cheung LW, Hennessy BT, Li J, Yu S, Myers AP, Djordjevic B, Lu Y, Stemke-Hale K, Dyer MD, Zhang F, et al. High frequency of PIK3R1 and PIK3R2 mutations in endometrial cancer elucidates a novel mechanism for regulation of PTEN protein stability. Cancer Discovery. 2011;1:170–185. doi: 10.1158/2159-8290.CD-11-0039. [DOI] [PMC free article] [PubMed] [Google Scholar]
- Cox D. Regression models and life tables (with discussion) J R Statistical Soc, B. 1972;34:187–220. [Google Scholar]
- De Roock W, Claes B, Bernasconi D, De Schutter J, Biesmans B, Fountzilas G, Kalogeras KT, Kotoula V, Papamichael D, Laurent-Puig P, et al. Effects of KRAS, BRAF, NRAS, and PIK3CA mutations on the efficacy of cetuximab plus chemotherapy in chemotherapy-refractory metastatic colorectal cancer: a retrospective consortium analysis. Lancet Oncol. 2010;11:753–762. doi: 10.1016/S1470-2045(10)70130-3. [DOI] [PubMed] [Google Scholar]
- Di Nicolantonio F, Arena S, Tabernero J, Grosso S, Molinari F, Macarulla T, Russo M, Cancelliere C, Zecchin D, Mazzucchelli L, et al. Deregulation of the PI3K and KRAS signaling pathways in human cancer cells determines their response to everolimus. J Clin Invest. 2010;120:2858–2866. doi: 10.1172/JCI37539. [DOI] [PMC free article] [PubMed] [Google Scholar]
- Dienstmann R, Serpico D, Rodon J, Saura C, Macarulla T, Elez E, Alsina M, Capdevila J, Perez-Garcia J, Sanchez-Olle G, et al. Molecular profiling of patients with colorectal cancer and matched targeted therapy in Phase 1 clinical trials. Mol Cancer Ther. 2012 doi: 10.1158/1535-7163.MCT-12-0290. [DOI] [PubMed] [Google Scholar]
- Dietrich S, Glimm H, Andrulis M, von Kalle C, Ho AD, Zenz T. BRAF inhibition in refractory hairy-cell leukemia. N Engl J Med. 2012;366:2038–2040. doi: 10.1056/NEJMc1202124. [DOI] [PubMed] [Google Scholar]
- Druker BJ, Talpaz M, Resta DJ, Peng B, Buchdunger E, Ford JM, Lydon NB, Kantarjian H, Capdeville R, Ohno-Jones S, Sawyers CL. Efficacy and safety of a specific inhibitor of the BCR-ABL tyrosine kinase in chronic myeloid leukemia. N Engl J Med. 2001;344:1031–1037. doi: 10.1056/NEJM200104053441401. [DOI] [PubMed] [Google Scholar]
- El-Osta H, Falchook G, Tsimberidou A, Hong D, Naing A, Kim K, Wen S, Janku F, Kurzrock R. BRAF mutations in advanced cancers: clinical characteristics and outcomes. PLoS One. 2011;6:e25806. doi: 10.1371/journal.pone.0025806. [DOI] [PMC free article] [PubMed] [Google Scholar]
- Engelman JA. Targeting PI3K signalling in cancer: opportunities, challenges and limitations. Nat Rev Cancer. 2009;9:550–562. doi: 10.1038/nrc2664. [DOI] [PubMed] [Google Scholar]
- Engelman JA, Chen L, Tan X, Crosby K, Guimaraes AR, Upadhyay R, Maira M, McNamara K, Perera SA, Song Y, et al. Effective use of PI3K and MEK inhibitors to treat mutant Kras G12D and PIK3CA H1047R murine lung cancers. Nat Med. 2008;14:1351–1356. doi: 10.1038/nm.1890. [DOI] [PMC free article] [PubMed] [Google Scholar]
- Faber AC, Corcoran RB, Ebi H, Sequist LV, Waltman BA, Chung E, Incio J, Digumarthy SR, Pollack SF, Song Y, et al. BIM Expression in Treatment-Naive Cancers Predicts Responsiveness to Kinase Inhibitors. Cancer Discov. 2011;1:352–365. doi: 10.1158/2159-8290.CD-11-0106. [DOI] [PMC free article] [PubMed] [Google Scholar]
- Faber AC, Li D, Song Y, Liang MC, Yeap BY, Bronson RT, Lifshits E, Chen Z, Maira SM, Garcia-Echeverria C, et al. Differential induction of apoptosis in HER2 and EGFR addicted cancers following PI3K inhibition. Proceedings of the National Academy of Sciences of the United States of America. 2009;106:19503–19508. doi: 10.1073/pnas.0905056106. [DOI] [PMC free article] [PubMed] [Google Scholar]
- Falchook GS, Long GV, Kurzrock R, Kim KB, Arkenau TH, Brown MP, Hamid O, Infante JR, Millward M, Pavlick AC, et al. Dabrafenib in patients with melanoma, untreated brain metastases, and other solid tumours: a phase 1 dose-escalation trial. Lancet. 2012;379:1893–1901. doi: 10.1016/S0140-6736(12)60398-5. [DOI] [PMC free article] [PubMed] [Google Scholar]
- Flaherty KT, Puzanov I, Kim KB, Ribas A, McArthur GA, Sosman JA, O'Dwyer PJ, Lee RJ, Grippo JF, Nolop K, Chapman PB. Inhibition of mutated, activated BRAF in metastatic melanoma. N Engl J Med. 2010;363:809–819. doi: 10.1056/NEJMoa1002011. [DOI] [PMC free article] [PubMed] [Google Scholar]
- Forbes SA, Bindal N, Bamford S, Cole C, Kok CY, Beare D, Jia M, Shepherd R, Leung K, Menzies A, et al. COSMIC: mining complete cancer genomes in the Catalogue of Somatic Mutations in Cancer. Nucleic Acids Res. 2011;39:D945–950. doi: 10.1093/nar/gkq929. [DOI] [PMC free article] [PubMed] [Google Scholar]
- Galsky MD, Von Hoff DD, Neubauer M, Anderson T, Fleming M, Nagarwala Y, Mahoney JM, Midwinter D, Vocila L, Zaks TZ. Target-specific, histology-independent, randomized discontinuation study of lapatinib in patients with HER2-amplified solid tumors. Investigational new drugs. 2012;30:695–701. doi: 10.1007/s10637-010-9541-0. [DOI] [PubMed] [Google Scholar]
- Gerlinger M, Rowan AJ, Horswell S, Larkin J, Endesfelder D, Gronroos E, Martinez P, Matthews N, Stewart A, Tarpey P, et al. Intratumor heterogeneity and branched evolution revealed by multiregion sequencing. N Engl J Med. 2012;366:883–892. doi: 10.1056/NEJMoa1113205. [DOI] [PMC free article] [PubMed] [Google Scholar]
- Hollander MC, Blumenthal GM, Dennis PA. PTEN loss in the continuum of common cancers, rare syndromes and mouse models. Nat Rev Cancer. 2011;11:289–301. doi: 10.1038/nrc3037. [DOI] [PMC free article] [PubMed] [Google Scholar]
- Ihle NT, Lemos R, Jr, Wipf P, Yacoub A, Mitchell C, Siwak D, Mills GB, Dent P, Kirkpatrick DL, Powis G. Mutations in the phosphatidylinositol-3-kinase pathway predict for antitumor activity of the inhibitor PX-866 whereas oncogenic Ras is a dominant predictor for resistance. Cancer Res. 2009;69:143–150. doi: 10.1158/0008-5472.CAN-07-6656. [DOI] [PMC free article] [PubMed] [Google Scholar]
- Janku F, Lee JJ, Tsimberidou AM, Hong DS, Naing A, Falchook GS, Fu S, Luthra R, Garrido-Laguna I, Kurzrock R. PIK3CA mutations frequently coexist with RAS and BRAF mutations in patients with advanced cancers. PLoS One. 2011a;6:e22769. doi: 10.1371/journal.pone.0022769. [DOI] [PMC free article] [PubMed] [Google Scholar]
- Janku F, Tsimberidou AM, Garrido-Laguna I, Wang X, Luthra R, Hong DS, Naing A, Falchook GS, Moroney JW, Piha-Paul SA, et al. PIK3CA mutations in patients with advanced cancers treated with PI3K/AKT/mTOR axis inhibitors. Molecular cancer therapeutics. 2011b;10:558–565. doi: 10.1158/1535-7163.MCT-10-0994. [DOI] [PMC free article] [PubMed] [Google Scholar]
- Janku F, Wheler JJ, Naing A, Falchook GS, Hong DS, Stepanek VM, Fu S, Piha-Paul SA, Lee JJ, Luthra R, et al. PIK3CA mutation H1047R is associated with response to PI3K/AKT/mTOR signaling pathway inhibitors in early-phase clinical trials. Cancer Res. 2013;73:276–284. doi: 10.1158/0008-5472.CAN-12-1726. [DOI] [PMC free article] [PubMed] [Google Scholar]
- Janku F, Wheler JJ, Naing A, Stepanek VM, Falchook GS, Fu S, Garrido-Laguna I, Tsimberidou AM, Piha-Paul SA, Moulder SL, et al. PIK3CA Mutations in Advanced Cancers: Characteristics and Outcomes. Oncotarget. 2012a doi: 10.18632/oncotarget.716. [DOI] [PMC free article] [PubMed] [Google Scholar]
- Janku F, Wheler JJ, Westin SN, Moulder SL, Naing A, Tsimberidou AM, Fu S, Falchook GS, Hong DS, Garrido-Laguna I, et al. PI3K/AKT/mTOR inhibitors in patients with breast and gynecologic malignancies harboring PIK3CA mutations. J Clin Oncol. 2012b;30:777–782. doi: 10.1200/JCO.2011.36.1196. [DOI] [PMC free article] [PubMed] [Google Scholar]
- Kaplan EMP. Nonparametric estimator from incomplete observations. J American Statistical Association. 1958;53:457–481. [Google Scholar]
- Kopetz S, Desai J, Chan E, Hecht JR, O'Dwyer J, Lee RJ, Nolop KB, Saltz L. PLX4032 in metastatic colorectal cancer patients with mutant BRAF tumors. J Clin Oncol. 2010;28:abstr 3534. [Google Scholar]
- Lynch TJ, Bell DW, Sordella R, Gurubhagavatula S, Okimoto RA, Brannigan BW, Harris PL, Haserlat SM, Supko JG, Haluska FG, et al. Activating mutations in the epidermal growth factor receptor underlying responsiveness of non-small-cell lung cancer to gefitinib. N Engl J Med. 2004;350:2129–2139. doi: 10.1056/NEJMoa040938. [DOI] [PubMed] [Google Scholar]
- Matthews DJ, O’Farrell M, Joyce J, Stott G, Giddens AC, Rewcastle GW, Denny WA. Preclinical characterization of PWT33597, a dual inhibitor of PI3-kinase alpha and mTOR. Proceedings American Association of Cancer Research 102nd Annual Meeting; 2011. p. abtract 4485. [Google Scholar]
- Moroney JW, Schlumbrecht MP, Helgason T, Coleman RL, Moulder S, Naing A, Bodurka DC, Janku F, Hong DS, Kurzrock R. A phase I trial of liposomal doxorubicin, bevacizumab, and temsirolimus in patients with advanced gynecologic and breast malignancies. Clinical cancer research : an official journal of the American Association for Cancer Research. 2011;17:6840–6846. doi: 10.1158/1078-0432.CCR-11-0666. [DOI] [PMC free article] [PubMed] [Google Scholar]
- Ng KP, Hillmer AM, Chuah CT, Juan WC, Ko TK, Teo AS, Ariyaratne PN, Takahashi N, Sawada K, Fei Y, et al. A common BIM deletion polymorphism mediates intrinsic resistance and inferior responses to tyrosine kinase inhibitors in cancer. Nat Med. 2012;18:521–528. doi: 10.1038/nm.2713. [DOI] [PubMed] [Google Scholar]
- Ni J, Liu Q, Xie S, Carlson C, Von T, Vogel K, Riddle S, Benes C, Eck M, Roberts T, et al. Functional Characterization of an Isoform-Selective Inhibitor of PI3K-p110beta as a Potential Anticancer Agent. Cancer Discov. 2012;2:425–433. doi: 10.1158/2159-8290.CD-12-0003. [DOI] [PMC free article] [PubMed] [Google Scholar]
- Ross RL, Askham JM, Knowles MA. PIK3CA mutation spectrum in urothelial carcinoma reflects cell context-dependent signaling and phenotypic outputs. Oncogene. 2012 doi: 10.1038/onc.2012.87. [DOI] [PubMed] [Google Scholar]
- Samuels Y, Wang Z, Bardelli A, Silliman N, Ptak J, Szabo S, Yan H, Gazdar A, Powell SM, Riggins GJ, et al. High frequency of mutations of the PIK3CA gene in human cancers. Science. 2004;304:554. doi: 10.1126/science.1096502. [DOI] [PubMed] [Google Scholar]
- Therasse P, Arbuck SG, Eisenhauer EA, Wanders J, Kaplan RS, Rubinstein L, Verweij J, Van Glabbeke M, van Oosterom AT, Christian MC, Gwyther SG. New guidelines to evaluate the response to treatment in solid tumors. European Organization for Research and Treatment of Cancer, National Cancer Institute of the United States, National Cancer Institute of Canada. J Natl Cancer Inst. 2000;92:205–216. doi: 10.1093/jnci/92.3.205. [DOI] [PubMed] [Google Scholar]
- Tsimberidou AM, Iskander NG, Hong DS, Wheler JJ, Falchook GS, Fu S, Piha-Paul S, Naing A, Janku F, Luthra R, et al. Personalized medicine in a phase I clinical trials program: the MD anderson cancer center initiative. Clin Cancer Res. 2012;18:6373–6383. doi: 10.1158/1078-0432.CCR-12-1627. [DOI] [PMC free article] [PubMed] [Google Scholar]
- Wee S, Jagani Z, Xiang KX, Loo A, Dorsch M, Yao YM, Sellers WR, Lengauer C, Stegmeier F. PI3K pathway activation mediates resistance to MEK inhibitors in KRAS mutant cancers. Cancer research. 2009;69:4286–4293. doi: 10.1158/0008-5472.CAN-08-4765. [DOI] [PubMed] [Google Scholar]
- Wee S, Wiederschain D, Maira SM, Loo A, Miller C, deBeaumont R, Stegmeier F, Yao YM, Lengauer C. PTEN-deficient cancers depend on PIK3CB. Proc Natl Acad Sci U S A. 2008;105:13057–13062. doi: 10.1073/pnas.0802655105. [DOI] [PMC free article] [PubMed] [Google Scholar]
- Weigelt B, Warne PH, Downward J. PIK3CA mutation, but not PTEN loss of function, determines the sensitivity of breast cancer cells to mTOR inhibitory drugs. Oncogene. 2011;30:3222–3233. doi: 10.1038/onc.2011.42. [DOI] [PubMed] [Google Scholar]
- Westin JR, Kurzrock R. It's about time: lessons for solid tumors from chronic myelogenous leukemia therapy. Mol Cancer Ther. 2012;11:2549–2555. doi: 10.1158/1535-7163.MCT-12-0473. [DOI] [PMC free article] [PubMed] [Google Scholar]
- Zuo Z, Chen SS, Chandra PK, Galbincea JM, Soape M, Doan S, Barkoh BA, Koeppen H, Medeiros LJ, Luthra R. Application of COLD-PCR for improved detection of KRAS mutations in clinical samples. Mod Pathol. 2009;22:1023–1031. doi: 10.1038/modpathol.2009.59. [DOI] [PubMed] [Google Scholar]
Associated Data
This section collects any data citations, data availability statements, or supplementary materials included in this article.