Background: The common food additive carrageenan inhibits insulin signaling by increasing Ser(P)307-IRS1, leading to reduced Ser(P)473-AKT.
Results: Carrageenan also inhibits insulin signaling by increasing expression of GRB10, an inhibitor of Tyr(P)-IRS1.
Conclusion: Combined effects of carrageenan on Tyr(P)-IRS1 and Ser(P)307-IRS1 completely block the insulin-induced increase in Ser(P)473-AKT.
Significance: Carrageenan impairs glucose tolerance by inflammatory and transcriptional effects that lead to insulin resistance.
Keywords: Akt PKB, GATA Transcription Factor, Inflammation, Insulin Receptor Substrate 1 (IRS-1), Insulin Resistance, GRB10, Carrageenan
Abstract
Inflammation induced by exposure to the common food additive carrageenan leads to insulin resistance by increase in Ser(P)307-insulin receptor substrate 1 (IRS1) and subsequent decline in the insulin-stimulated increase in Ser(P)473-AKT. Inhibition of carrageenan-induced inflammation reversed the increase in Ser(P)307-IRS1 but did not completely reverse the carrageenan-induced decline in Ser(P)473-AKT. To identify the additional mechanism responsible for the decrease in Ser(P)473-AKT, studies were performed in human HepG2 cells and in C57BL/6J mice. Following carrageenan, expression of GRB10 (growth factor receptor-bound 10 protein), an adaptor protein that binds to the insulin receptor and inhibits insulin signaling, increased significantly. GRB10 silencing blocked the carrageenan-induced reduction of the insulin-stimulated increase in Tyr(P)-IRS1 and partially reversed the decline in Ser(P)473-AKT. The combination of GRB10 silencing with BCL10 silencing and the reactive oxygen species inhibitor Tempol completely reversed the decline in Ser(P)473-AKT. After carrageenan, GRB10 promoter activity was enhanced because of activation by GATA2. A direct correlation between Ser(P)473-AKT and Ser(P)401-GATA2 was evident, and inhibition of AKT phosphorylation by the PI3K inhibitor LY294002 blocked Ser401-GATA2 phosphorylation and the increase in GRB10 expression. Studies indicated that carrageenan inhibited insulin signaling by two mechanisms: through the inflammation-mediated increase in Ser(P)307-IRS1, a negative regulator of insulin signaling, and through a transcriptional mechanism leading to increase in GRB10 expression and GRB10-inhibition of Tyr(P)-IRS1, a positive regulator of insulin signaling. These mechanisms converge to inhibit the insulin-induced increase in Ser(P)473-AKT. They provide internal feedback, mediated by Ser(P)473-AKT, Ser(P)401-GATA2, and nuclear GATA2, which links the opposing effects of serine and tyrosine phosphorylations of IRS1 and can modulate insulin responsiveness.
Introduction
Exposure for a short duration to a low concentration of the common food additive carrageenan impaired insulin signaling in HepG2 cells and in C57BL/6J mice and produced insulin resistance and glucose intolerance in the mice (1). The mechanism of the insulin resistance was attributed to carrageenan-induced inflammation, which proceeds by activation of both innate immune- and reactive oxygen species-mediated pathways of inflammation (2–5). Activation of Toll-like receptor 4 (TLR4)2 and BCL10 (B-cell CLL/lymphoma 10) leads to NF-κB nuclear translocations involving both canonical and noncanonical pathways. Increase of phosphoinhibitor of nuclear factor κB (IκB) kinase β caused by stimulation of the inflammatory cascades leads to increased phosphorylation of Ser307 (in rodent; Ser312 in human)-insulin receptor substrate 1 (IRS1), a negative mediator of downstream insulin signaling (1, 6–8). Inhibition of the carrageenan-induced inflammation, by the combination of reactive oxygen species inhibitor Tempol and TLR4 or BCL10 siRNA, reversed the effects of carrageenan on Ser(P)307-IRS1, as previously reported (1). Subsequent experiments, presented in this report, have shown that the carrageenan-induced decline in the Ser(P)473-AKT response to insulin was not completely reversed by inhibition of the carrageenan-induced inflammatory cascades. This finding suggested the presence of another mechanism by which carrageenan inhibited insulin signaling. In this report, we present this second mechanism by which carrageenan inhibits insulin signaling in human hepatic cells (HepG2) and C57BL/6J mouse liver. The findings indicate how the carrageenan-induced decline in the insulin-initiated increase in tyrosine phosphorylation of IRS1 and the increase in serine 307 phosphorylation of IRS1 combine to inhibit the insulin-induced increase in Ser(P)473-AKT. The interaction of these mechanisms provides new insight into the regulation of responses to insulin in hepatocytes.
The second mechanism by which carrageenan exposure inhibits phosphorylation of Ser473-AKT involves the GRB10 (growth factor receptor-bound 10 protein). GRB10 is an adaptor protein with pleckstrin homology and Src homology 2 domains and binds with receptor tyrosine kinases, including the insulin receptor (9, 10). GRB10 acts as a negative regulator of signaling from the insulin receptor (11–16). GRB10 was identified in genome-wide studies as a candidate gene for type 2 diabetes (17–19). GRB10 induced type 2 diabetes in a nonobese mouse model of diabetes (20) and was implicated in maternal imprinting and heritable effects on glucose tolerance (21–25).
Carrageenan, which is derived from red algae, is composed of sulfated and unsulfated galactose disaccharides linked in alternating α-1,3 and β-1,4 bonds. Carrageenan is widely used as a food additive in processed foods to thicken and solubilize ingredients and improve texture. The amount of carrageenan consumed in the typical American diet is greater than the exposure in the experiments reported previously and in the experiments in this report (1). The daily consumption of carrageenan in the experimental mice (50 μg/day/25 g mouse = 2 μg/g = 2 mg/kg) was less than the amount anticipated to be ingested daily by adults consuming the typical Western diet (∼250 mg/day/60 kg person = ∼4.2 mg/kg).
The impact of carrageenan on innate immune-mediated inflammation arises from its unusual α-1,3-galactosidic bonds, which are immunogenic in humans and Old World apes (26–28). Hydrolysis of these bonds by carrageenases reduced the activation of the TLR4-BCL10-mediated inflammation by carrageenan (29). The activation of the TLR4-mediated pathway of inflammation has been associated with insulin resistance and the onset of diabetes in the nonobese diabetic mouse (30–32). Hence, the experiments in this study are highly relevant to the emergence of insulin resistance, glucose intolerance, and clinical diabetes.
EXPERIMENTAL PROCEDURES
Cell Culture and Animal Model
HepG2 cells (ATCC HB-8065), a human hepatic adenocarcinoma cell line, were grown under recommended conditions using minimum essential medium with 10% FBS and were maintained at 37 °C in a humidified, 5% CO2 environment with medium exchange every 2 days (1). Confluent cells in T-25 flasks were harvested by EDTA-trypsin, and subcultured in multiwell tissue culture plates. In most of the experiments, cells were exposed to λ-carrageenan (1 mg/liter) in medium with serum for 20 h and then to λ-carrageenan (1 mg/liter) in medium without serum for 4 h. Cells were washed with serum-free medium, and fresh serum-free medium with regular human insulin (Humulin U-100; Lilly, Indianapolis, IN; 20 nmol/liter) was added for 10 min. Cells were harvested by scraping and frozen at −80 °C for subsequent analysis. Some cell preparations were treated with Tempol (1-oxyl-2,2,6,6-tetramethyl-4-hydroxypiperidine; Axxora Life Sciences, San Diego, CA), a superoxide dismutase mimetic, which acts as a free radical scavenger and inhibits reactive oxygen species. HepG2 cells were treated with Tempol 100 nmol/liter in combination with λ-carrageenan (1 mg/liter) for 24 h, as previously described (1).
Eight-week-old male C57BL/6J mice (n = 18) were purchased (Jackson Laboratories, Bar Harbor, ME) and housed in the Veterinary Medicine Unit at the Jesse Brown Veterans Affairs Medical Center (Chicago, IL). All procedures were approved by the Animal Care Committee of the University of Illinois at Chicago and the Jesse Brown Veterans Affairs Medical Center. The mice were fed a standard diet and maintained with routine light-dark cycles. After acclimation to the environment, the experimental animals received water with carrageenan (10 mg/liter λ-κ carrageenan; Sigma; n = 6) or without carrageenan (n = 6) for 9 weeks. Water consumption and weight were measured weekly. These mice were sacrificed following a 2-h fast and insulin injection (2 units/kg intraperitoneally) 10 min prior to euthanasia and compared with untreated control (n = 6) (1).
Silencing of BCL10, TLR4, and GRB10 by siRNA
siRNAs for TLR4, BCL10, and GRB10 were obtained commercially (Qiagen) and used as described previously (1). The effectiveness of silencing in the HepG2 cells was demonstrated by Western blotting for TLR4 and by quantitative ELISAs for BCL10 (1, 33) and for GRB10 (Blue Gene, Shanghai, China). Briefly, cells were grown to 60–70% confluency in 6-well tissue culture clusters, and the medium of the growing cells was aspirated and replaced with 2.3 ml of fresh medium with serum. 0.6 μl of 20 μm siRNA (150 ng) was mixed with 100 μl of serum-free medium and 12 μl of HiPerfect transfection reagent (Qiagen). The mixture was incubated for 10 min at room temperature to allow the formation of transfection complexes and then added dropwise onto the cells. The microplates were swirled gently, and treated cells were incubated at 37 °C in a humidified, 5% CO2 environment. After 24 h, the spent medium was exchanged with fresh growth medium.
Inhibition of AKT Ser473 phosphorylation by LY294002
PI3K is required for phosphorylation of AKT Ser473, thereby enabling AKT activation and downstream effects. LY294002 (50 μm × 24 h; Calbiochem, Billerica, MA), an inhibitor of PI3K and mTOR, was used to suppress AKT Ser473 phosphorylation and downstream signaling (34, 35).
Western Blots for GRB10, Ser(P)401-GATA2, total GATA2, Tyr(P)-IRS1, and IRS-1
Insulin (2 units/kg of body weight) was administered intraperitoneally to the C57BL/6J mice at 18 weeks of age, following ingestion of carrageenan for 9 weeks, and a 2-h fast. Insulin was injected 10 min prior to euthanasia by CO2 inhalation and exsanguination by cardiac puncture, and the liver was immediately harvested and frozen at −80 °C. Tissue homogenates were prepared in cell lysis buffer (Cell Signaling, Danvers, MA) with protease and phosphatase inhibitors (Halt Protease and Phosphatase Inhibitor Mixture; Thermo Scientific, Pittsburgh, PA) from carrageenan-exposed and control hepatic tissue of mice that received antemortem insulin and control, as above. Western blots were performed on 10% SDS gels with commercial antibodies to GRB10 (Santa Cruz Biotechnology, Santa Cruz, CA), Ser(P)401-GATA2 (Abcam, Cambridge, MA), total GATA (Abcam), Tyr(P)-IRS1 (Cell Signaling, Danvers, MA), IRS1 (Cell Signaling), and β-actin (Santa Cruz Biotechnology) to probe for the proteins of interest using established procedures (1). HepG2 cells exposed to carrageenan and insulin and untreated control cells were also analyzed by Western blots using similar procedures. Immunoreactive bands were visualized using enhanced chemiluminescence (Amersham Biosciences, GE Healthcare), and ImageJ software (National Institutes of Health, Bethesda, MD) was used for densitometry. Density of the protein of interest was compared with β-actin, or IRS-1, from the same specimen, and the densities of treated and control samples were compared.
ELISAs for Tyr(P)-IRS1, Ser(P)307-IRS1, Tyr(P)-IR, GRB10, and Ser(P)473-AKT
Tyr(P)-IRS1 and Ser(P)307-IRS1 (in rodent; Ser(P)312-IRS1 in human) were determined by commercial sandwich ELISAs (Cell Signaling, Danvers, MA) in mouse liver homogenates and HepG2 cells of untreated controls or following exposure to carrageenan and insulin. In the HepG2 cells, GRB10, BCL10, or TLR4 mRNA were silenced by specific siRNAs prior to carrageenan and insulin treatments, as above. IRS1 in the tissue or cell samples was captured by IRS1 antibody. Tyr(P) or Ser(P)307 antibodies were used to detect tyrosine or serine phosphorylation of the captured IRS1 protein. Anti-mouse IgG, HRP-linked antibody was then used to detect the bound second antibody. The bound peroxidase activity was determined by adding hydrogen peroxide-TMB substrate, the reaction was stopped by 2 n H2SO4, and the absorbance was measured at 450 nm in a plate reader (FLUOstar, BMG Labtech, Cary, NC). Insulin receptor pan-tyrosine phosphorylation was determined in HepG2 cells post-carrageenan treatment by a commercial Tyr(P)-IR ELISA (Cell Signaling).
GRB10 in the cell and mouse samples was measured by commercial ELISA (Blue Gene), following the recommended procedures, and the GRB10 concentration in each sample was interpolated from the standard curve. Ser(P)473-AKT was measured by a cell-based ELISA, as previously (Active Motif, Carlsbad, CA) (1). Measurements for treated cells were compared with values per mg protein for the unexposed control cells and expressed as percentages of the untreated control.
QPCR for mRNA Expression of Grb10 in Mouse Tissues
C57BL/6J mice were euthanized following intraperitoneal injection of regular insulin (2 units/kg) and exposure to carrageenan in the water supply, as detailed above. Tissues were promptly harvested and immediately frozen. Subsequently, tissue was processed for QPCR. Primers for mouse Grb10 were selected using Primer3 (software from the Broad Institute) and were 5′-AGT GTA GCA GAC TTC AGT GGC-3′ (left) and 5′-TCC AAA ACA ACC CTG AGC TGT-3′ (right). QPCR was performed as previously reported (3), and cycle thresholds were calculated and compared with values for β-actin.
GRB10 Promoter Activity by Luciferase Reporter Assay
Human GRB10 promoter construct in a Renilla reniformis luciferase reporter gene vector was used to detect differences in GRB10 promoter activity following carrageenan treatment of HepG2 cells. Human GRB10 promoter, β-actin promoter construct (positive control), and scrambled sequence R01 (negative control) in Renilla luciferase reporters were obtained (LightSwitch luciferase assay; SwitchGear Genomics, Menlo Park, CA) and used to determine the effectiveness of transfection and the specificity of the reactions (36). Transfections were performed with cells at 70% confluence, using FuGENE HD transfection reagent (Roche Diagnostics). Following transfection, cells were treated with carrageenan (1 mg/liter) for 24 h. Luminescence was measured after incubation at 480 nm in a microplate reader (BMG) and reported as relative luminescence units.
Nuclear GATA2 Determination
GATA2 was identified as a transcription factor that has a binding site in the GRB10 promoter and might regulate GRB10 transcription (TFSEARCH: Searching Transcription Factor Binding Sites; Ref. 37). GATA was measured in the nuclear extract of HepG2 cells treated with carrageenan and/or insulin. Nuclear extracts were prepared (Active Motif), and the nuclear GATA protein was determined in the samples using the TF filter plate assay (Signosis Inc., Santa Clara, CA). A specific biotin-labeled GATA DNA binding sequence was mixed with the nuclear extracts, and GATA protein-DNA complexes formed. A filter plate was used to retain the DNA probe with GATA and remove free probe. The bound prelabeled DNA probe was eluted from the filter and collected for quantitative analysis of nuclear GATA following detection with streptavidin-HRP. Luminescence was reported as relative luminescence units.
ChIP Assay
For ChIP assay, control, insulin-, carrageenan-, and insulin with carrageenan-treated HepG2 cells and IgG control were fixed with 1% formaldehyde for 10 min at room temperature, followed by shearing of chromatin by sonication (ChIP assay; Active Motif) (36). Sheared DNA was incubated with anti-GATA2 antibody (Abcam) for 1 h, as well as with IgG control. Protein-DNA complexes were precipitated by protein A/G-coupled magnetic beads. DNA was purified from the immunoprecipitated complexes by reversal of cross-linking, followed by proteinase K treatment. Then real time RT-PCR was performed using Brilliant SYBR Green QRT-PCR master mix (Stratagene, La Jolla, CA) and Mx3000 (Stratagene) to amplify the GRB10 promoter oligonucleotide that encompassed the GATA2 binding site. The primers for the GRB10 promoter were 5′-CGC CGT CAT TGT CTG AGC-3′ (left) and 5′-AAG ATG GTT CAA GAA TGC ACC-3′ (right). Input DNA of each sample was calculated from the standard curve and expressed as a percentage of total DNA. PCR products were run on a 2.0% agarose gel, and band intensity was compared among the different preparations.
Statistical Analysis
Data were analyzed using InStat3 software (GraphPad, La Jolla, CA) and are presented as mean value ± S.D. of at least three independent biological samples with technical replicates of each determination. The differences between carrageenan-treated and control results were compared by one-way analysis of variance with the Tukey-Kramer post-test for multiple comparisons, unless stated otherwise. p values are represented by * for p ≤ 0.05, ** for p ≤ 0.01, and *** for p ≤ 0.001.
RESULTS
Carrageenan Inhibited the Insulin-induced Tyrosine Phosphorylation of IRS1
The insulin-stimulated increase in Tyr(P)-IRS1 levels in cultured HepG2 cells (Fig. 1A) and in C57BL/6J mouse hepatic tissue in vivo (Fig. 1B) was detected by ELISA. Carrageenan exposure (1 mg/liter × 24 h) alone had no effect on Tyr(P)-IRS1, but carrageenan exposure prior to insulin treatment markedly reduced the insulin-stimulated tyrosine phosphorylation of IRS1 (p < 0.001). Representative Western blot also demonstrated the impact of insulin, carrageenan, and insulin and carrageenan in combination on Tyr(P)-IRS1, without change in total IRS1, in the HepG2 cells (Fig. 1C). These data indicate that carrageenan inhibits insulin signaling by reducing Tyr(P)-IRS1, which is a positive mediator of insulin signal transduction.
FIGURE 1.
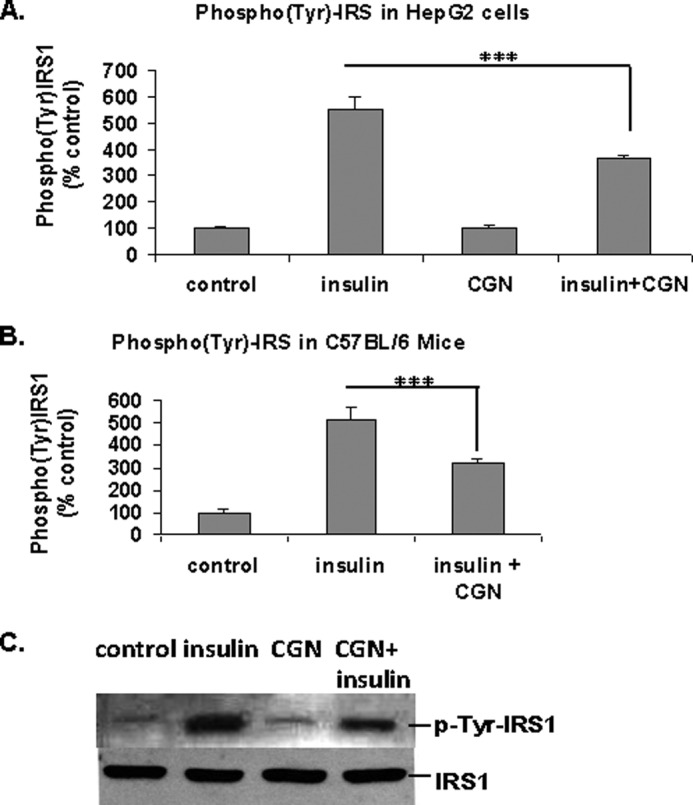
Carrageenan inhibits the insulin-induced increase in Tyr(P)-IRS1. A, cultured HepG2 cells were treated with carrageenan (1 mg/liter × 24 h, including 4 h in serum-free medium) and insulin (20 nmol/liter × 10 min). Tyr(P)-IRS1 was measured by ELISA. Insulin increased the tyrosine phosphorylation of IRS1 to more than five times the baseline, and carrageenan significantly inhibited the stimulatory effect of insulin (*** for p < 0.001; n = 3). B, hepatic Tyr(P)-IRS1 was determined by ELISA in carrageenan-exposed mice (10 mg/liter in drinking water × 9 weeks) that received ante-mortem insulin (2 units/kg intraperitoneally × 10 min). The values increased to 515 ± 56% the baseline value of the control animals. Carrageenan exposure reduced this increase to 315 ± 20% of the baseline value (*** for p < 0.001; n = 6). C, representative Western blot of Tyr(P)-IRS1 in the HepG2 cells shows a decline in the band intensity following carrageenan. Total IRS1 was unchanged. CGN, carrageenan.
Carrageenan Induced the Expression of GRB10 in HepG2 Cells and C57BL/6J Hepatic Tissue
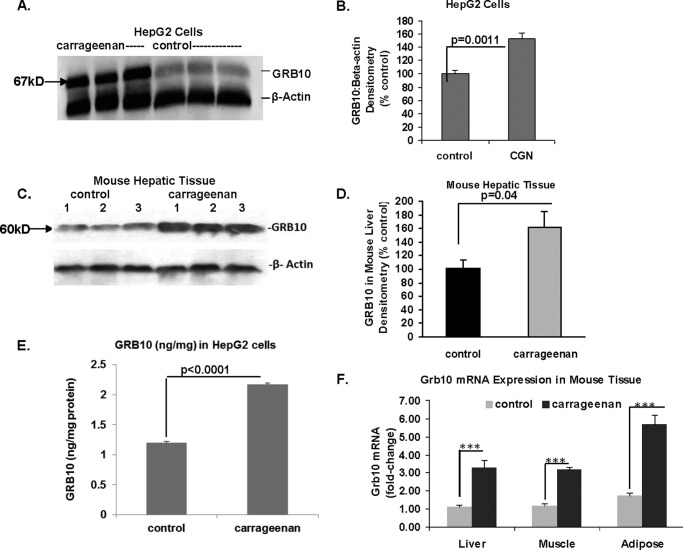
GRB10 protein was up-regulated following exposure to carrageenan, as shown by Western blots and densitometry in HepG2 cells (Fig. 2, A and B) and in C57BL/6J mouse hepatic tissue (Fig. 2, C and D). Quantitative determination of GRB10 in the HepG2 cells by ELISA also demonstrated increase in GRB10 protein from the control level of 1.20 ± 0.02 to 2.17 ± 0.09 ng/mg protein (p < 0.0001, unpaired t test, two-tailed) (Fig. 2E). QPCR demonstrated increases in Grb10 mRNA expression in hepatic, adipose, and muscle tissue of the mice following exposure to carrageenan and insulin (Fig. 2F). Because GRB10 is a known negative regulator of insulin signaling and Tyr(P)-IRS1, these data suggested that the carrageenan-induced decline in Tyr(P)-IRS1 is attributable to increased GRB10 expression.
FIGURE 2.
GRB10 expression increases following carrageenan exposure in HepG2 cells and hepatic tissue. A, representative Western blot demonstrates increased density of GRB10 protein in HepG2 cells following exposure to carrageenan. B, densitomeric analysis indicated statistically significant increase in GRB10 protein in the HepG2 cells following carrageenan (100 ± 6.0% versus 152.2 ± 8.8%; p = 0.0011, unpaired t test, two-tailed; n = 3). C, representative Western blot shows increased density of the Grb10 band in liver tissue of C57BL/6J mice exposed to carrageenan and ante-mortem insulin. D, densitometric analysis confirmed the increased density of the predominant Grb10 band following carrageenan exposure (p = 0.04, unpaired t test, two-tailed; n = 9). E, GRB10 protein in control and carrageenan-treated HepG2 cells was quantified by ELISA. Carrageenan increased the GRB10 concentration to 2.17 ± 0.09 ng/mg protein from the baseline level of 1.20 ± 0.02 ng/mg protein (p < 0.0001; unpaired t test, two-tailed, n = 3). F, Grb10 mRNA expression was significantly increased in the hepatic, gastrocnemius, and adipose tissue of the C57BL/6J mice following exposure to carrageenan and insulin (*** for p < 0.001; n = 3). CGN, carrageenan; GRB, growth factor receptor-bound protein.
GRB10 siRNA Blocked the Carrageenan-induced Reduction of the Insulin-induced Increase in Tyr(P)-IRS1
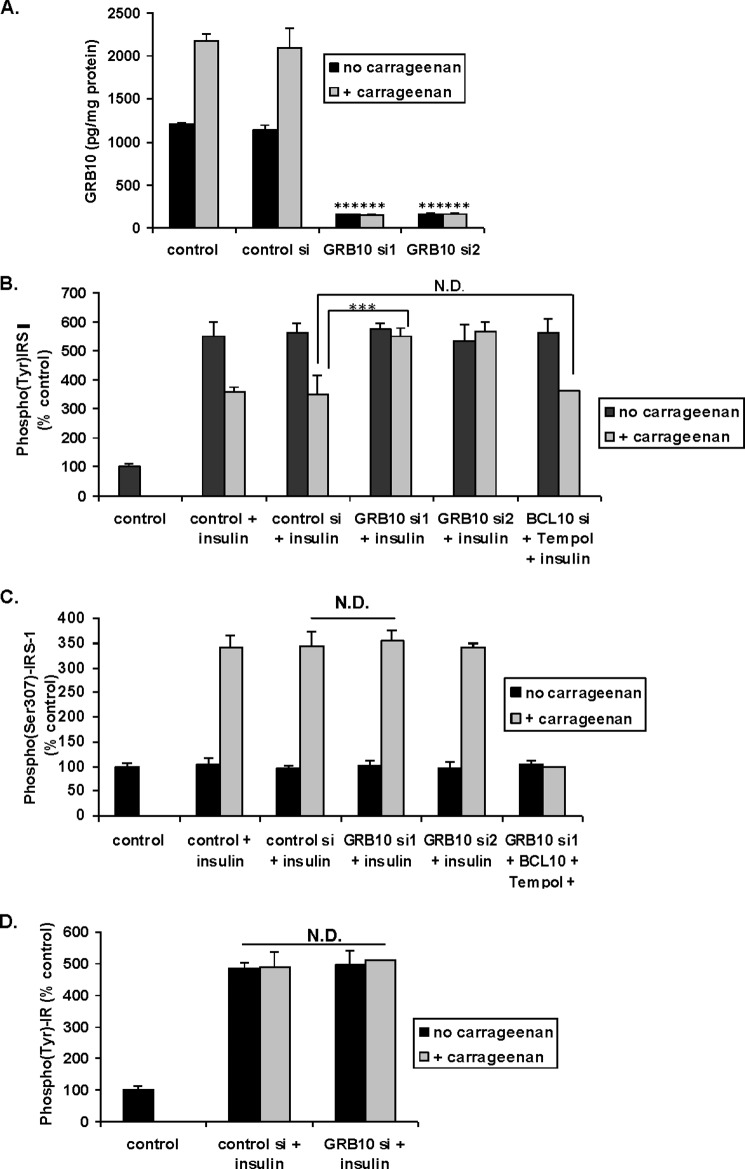
GRB10 was effectively silenced by siRNA in HepG2 cells, the cells were treated with carrageenan, and the GRB10 was quantified by ELISA. GRB10 levels were reduced by >85% by two of the GRB10 siRNAs tested (Fig. 3A). The carrageenan-induced reduction of the insulin-stimulated increase in Tyr(P)-IRS1 was reversed by GRB10 siRNA (Fig. 3B).
FIGURE 3.
Impact of silencing GRB10 on Tyr(P)-IRS1, Ser(P)307-IRS1, and Tyr(P)-IR. A, HepG2 cells in culture were transfected with control siRNA and GRB10 siRNAs. Twenty-four hours after transfection, cells were treated with 1 mg/liter of carrageenan for another 24 h. Cells were harvested, and GRB10 in the cell extracts was measured by ELISA. GRB10 siRNA reduced the GRB10 protein post-carrageenan by >85% (*** for p < 0.001, n = 3). B, HepG2 cells in culture were treated with carrageenan (1 mg/liter × 24 h) after silencing GRB10. Other cells were treated with BCL10 siRNA and Tempol 100 nm × 24 h to inhibit the carrageenan-initiated inflammatory cascades. The insulin-induced increase in Tyr(P)-IRS1 was inhibited by GRB10 siRNA (*** for p < 0.001; n = 3), but not by the combination of Tempol and BCL10 siRNA. C, in contrast, GRB10 siRNA had no impact on the carrageenan-induced increase in Ser(P)307-IRS1 in HepG2 cells. BCL10 siRNA and Tempol did significantly inhibit the carrageenan-induced increase in Ser(P)307-IRS1, as previously reported (1). D, neither carrageenan nor GRB10 siRNA had any effect on the insulin-induced increase in tyrosine phosphorylation of the IR. BCL, B-cell CLL/lymphoma; GRB, growth factor receptor-bound protein; N.D., no difference.
The effects of carrageenan on inflammation were inhibited by silencing BCL10 and by Tempol (1–5), but BCL10 in combination with Tempol had no impact on the carragenan-induced reduction of the insulin-induced increase in Tyr(P)-IRS1 (Fig. 3B). In contrast, BCL10 siRNA and Tempol completely inhibited the carrageenan-induced increase in Ser(P)307-IRS1, whereas GRB10 siRNA had no effect (Fig. 3C). These findings are consistent with a distinct effect of carrageenan-induced inflammation increasing Ser(P)307-IRS1 and a second mechanism affecting Tyr(P)-IRS1.
The insulin-induced increase in tyrosine phosphorylation of the insulin receptor (IR) was not inhibited by either carrageenan or GRB10 silencing (Fig. 3D). These results indicated that the impact of GRB10 was downstream of the IR.
GRB10 siRNA Partially Inhibited the Carrageenan-induced Decline in the Insulin-stimulated Increase in Ser(P)473-AKT
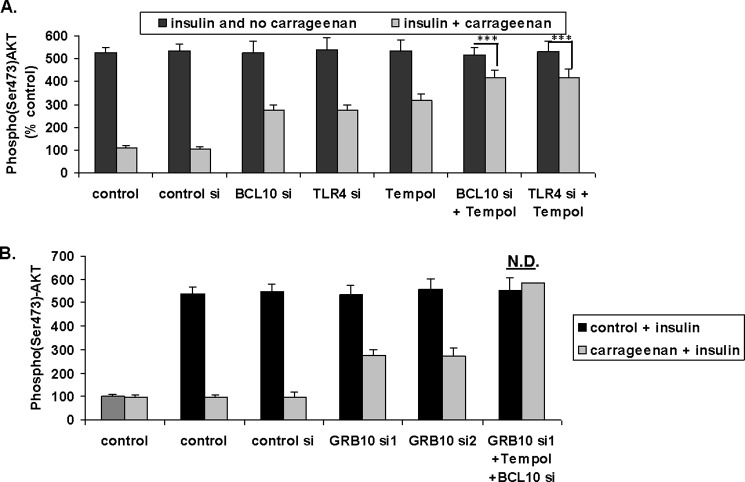
When HepG2 cells in culture were treated with control siRNA, BCL10 siRNA, TLR4 siRNA, Tempol, or combinations of BCL10 siRNA or TLR4 siRNA and Tempol to suppress the carrageenan-induced inflammation, there was partial reversal of the impact of carrageenan on the insulin-induced increases in Ser(P)473-AKT (Fig. 4A). The combination of GRB10 siRNA with BCL10 siRNA and Tempol completely reversed the carrageenan-induced inhibition (Fig. 4B). These findings revealed that both carrageenan-induced inflammatory effects and effects on GRB10 expression were required for the complete inhibition of Ser(P)473-AKT following insulin.
FIGURE 4.
GRB10 siRNA partially reverses the effect of carrageenan on the insulin-induced increase in Ser(P)473-AKT. A, HepG2 cells in culture were treated with control siRNA, BCL10 siRNA, TLR4 siRNA, Tempol, or combinations to suppress the carrageenan-induced inflammatory cascades. Cell-based ELISA demonstrated partial reversal of the impact of carrageenan on the insulin-induced increases in Ser(P)473-AKT (*** for p < 0.001, n = 3). B, the combination of GRB10 siRNA and inhibitors of the inflammatory effects of carrageenan completely reversed the carrageenan-induced inhibition of the insulin-induced increase in Ser(P)473-AKT (*** for p < 0.001, n = 3). AKT, protein kinase B; BCL, B-cell CLL/lymphoma; CGN, carrageenan; GRB, growth factor receptor-bound protein; N.D., no difference.
Carrageenan Stimulated GRB10 Promoter Activity through GATA2
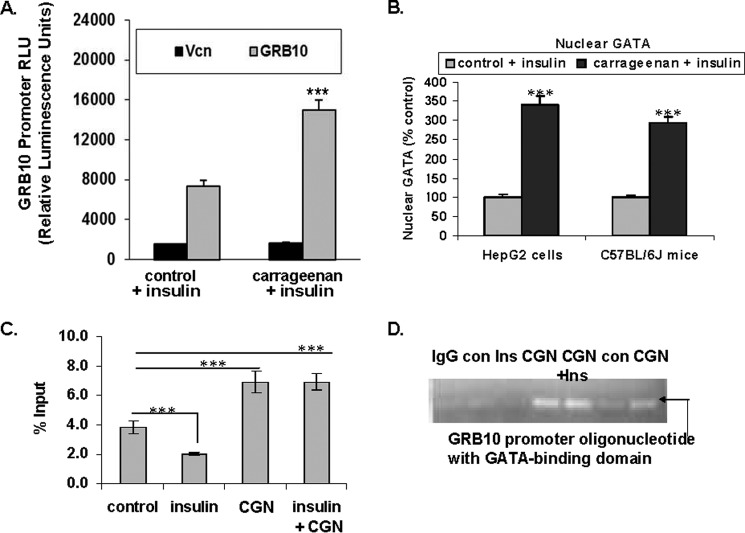
Treatment of HepG2 cells with carrageenan (1 mg/liter) for 24 h increased the GRB10 promoter activity significantly (p < 0.001), as shown by increase in the R. reniformis luciferase reporter signal to more than two times the baseline level (Fig. 5A). A GATA2 consensus sequence (ACAAT) was identified in the GRB10 promoter (TFSEARCH: Searching Transcription Factor Binding Sites; Ref. 37). The impact of carrageenan treatment on binding of nuclear GATA2 protein to the GRB10 promoter DNA that encompassed this site was determined in nuclear extracts of HepG2 cells and in C57BL/6J hepatic tissue by oligonucleotide binding assays. GATA2 binding increased to 3.41 ± 0.22 times the basal level (p < 0.0001; unpaired t test, two-tailed; n = 6) in the HepG2 cells and to 2.94 ± 0.15 times the control value in the mouse liver (p < 0.0001; unpaired t test, two-tailed; n = 6) (Fig. 5B) following carrageenan and insulin exposure, compared with insulin alone.
FIGURE 5.
Carrageenan treatment increases GRB10 promoter activity in HepG2 cells. A, treatment of HepG2 cells with carrageenan after transfection of the cells with the GRB10 promoter in a R. reniformis luciferase reporter demonstrated an increase to more than twice the baseline in the luciferase signal (*** for p < 0.001, n = 6). Vcn, vector control. B, oligonucleotide binding assay showed that the binding of nuclear GATA protein to the GRB10 promoter oligonucleotide that encompasses the GATA2 binding site increased to 341 ± 21.5 and 294 ± 15.3% of the baseline levels in carrageenan-treated HepG2 cells and mouse hepatic tissue, respectively (*** for p < 0.0001; unpaired t test, two-tailed; n = 6). C, ChIP assay was performed with specific GATA2 antibody following carrageenan (1 mg/liter × 24 h; with 4 h in serum-free medium) or insulin (20 nmol/liter × 10 min) or combined carrageenan and insulin in the HepG2 cells. Carrageenan either alone or in combination with insulin increased the GATA2-bound DNA. DNA recovery increased from baseline control value of 3.82 ± 0.42 to 6.90 ± 0.73% after carrageenan exposure (*** for p < 0.001; n = 6) and declined following insulin exposure to 2.00 ± 0.08% (*** for p < 0.001, n = 6). D, agarose gel electrophoresis of the PCR product demonstrates increased band density following carrageenan either with or without insulin exposure. CGN, carrageenan; con, control; GRB, growth factor receptor-bound protein; Ins, insulin.
Adherence of sheared DNA from HepG2 nuclear extracts to GATA2 was determined by ChIP assay. Following carrageenan, the amount of GATA2-bound DNA was significantly increased compared with control (p < 0.001). Insulin significantly reduced the amount of GATA2-bound DNA detected (p < 0.001) (Fig. 5C). Agarose gel confirmed the increase in GATA2-bound DNA following carrageenan (Fig. 5D). The intensity of the bands from the carrageenan-treated and carrageenan with insulin-treated cells was much greater than from the controls or the cells treated with insulin only. These data demonstrated that carrageenan exposure increased the GRB10 promoter activation through a GATA2 binding site.
Carrageenan Inhibited the Insulin-induced Phosphorylations of AKT and GATA2
Ser(P)307-AKT was reported to phosphorylate GATA2 (38), leading to consideration of the association between Ser(P)473-AKT, Ser(P)401-GATA2, and GATA2 in the HepG2 cells. Fast activated cell-based ELISAs were performed for both Ser(P)473-AKT and Ser(P)401-GATA2 and demonstrated a more than 400% increase in Ser473 phosphorylation of AKT and a more than 160% increase in Ser401 phosphorylation of GATA2 post-insulin stimulation (p < 0.001) (Fig. 6A). Carrageenan treatment completely inhibited the responses to insulin, but carrageenan alone had no effect on the phosphorylations. The percentages of Ser(P)473-AKT and Ser(P)401-GATA2 present under different conditions (control, insulin, carrageenan, insulin, and carrageenan) showed a strong positive correlation (r = 0.97).
FIGURE 6.
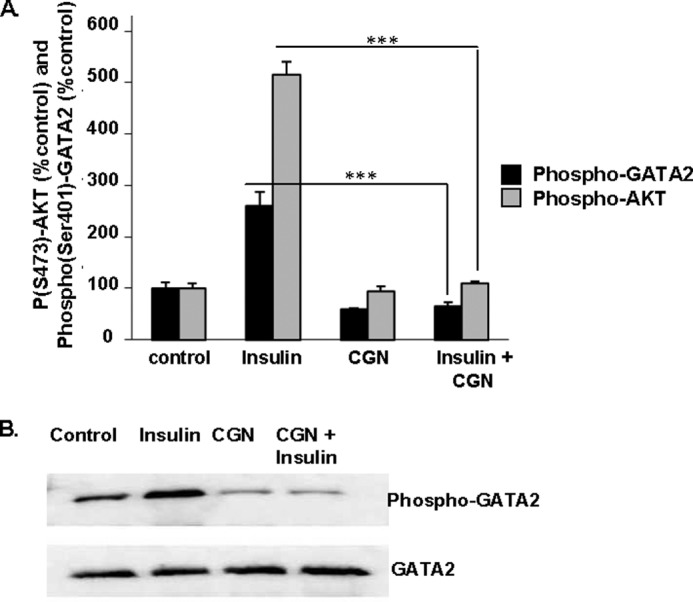
Insulin-induced increases in AKT and GATA2 phosphorylations are inhibited by carrageenan. A, Ser(P)473-AKT and of Ser(P)401-GATA2 were detected by FACE assay after the HepG2 cells were treated with insulin (20 nmol/liter × 10 min), carrageenan (1 mg/liter × 24 h, with 4 h in serum-free media), and the combination of insulin and carrageenan. Carrageenan significantly inhibited the insulin-induced phosphorylations of AKT and GATA2 (*** for p < 0.001, n = 6). B, insulin induced and carrageenan inhibited phosphorylation of GATA2 in HepG2 cells, with no impact on total GATA2, as shown by representative Western blot. The insulin-induced increase in Ser(P)401-GATA2 was inhibited by carrageenan exposure. AKT, protein kinase B; CGN, carrageenan.
Western blots of Ser(P)401-GATA2 and GATA2 demonstrated that insulin treatment induced the phosphorylation of GATA2, and prior carrageenan treatment completely inhibited the stimulatory effect of insulin on Ser(P)401-GATA2 (Fig. 6B). The immunoreactive band for Ser(P)401-GATA2 was much stronger than control after insulin exposure, and carrageenan treatment, either alone or in combination with insulin, reduced the band intensity. Neither insulin nor carrageenan alone or in combination with insulin modified the intensity of the cellular GATA2 band. These results indicated a direct relationship between Ser(P)473-AKT and Ser(P)401-GATA2.
Inhibition of AKT Phosphorylation Increased GRB10 Expression
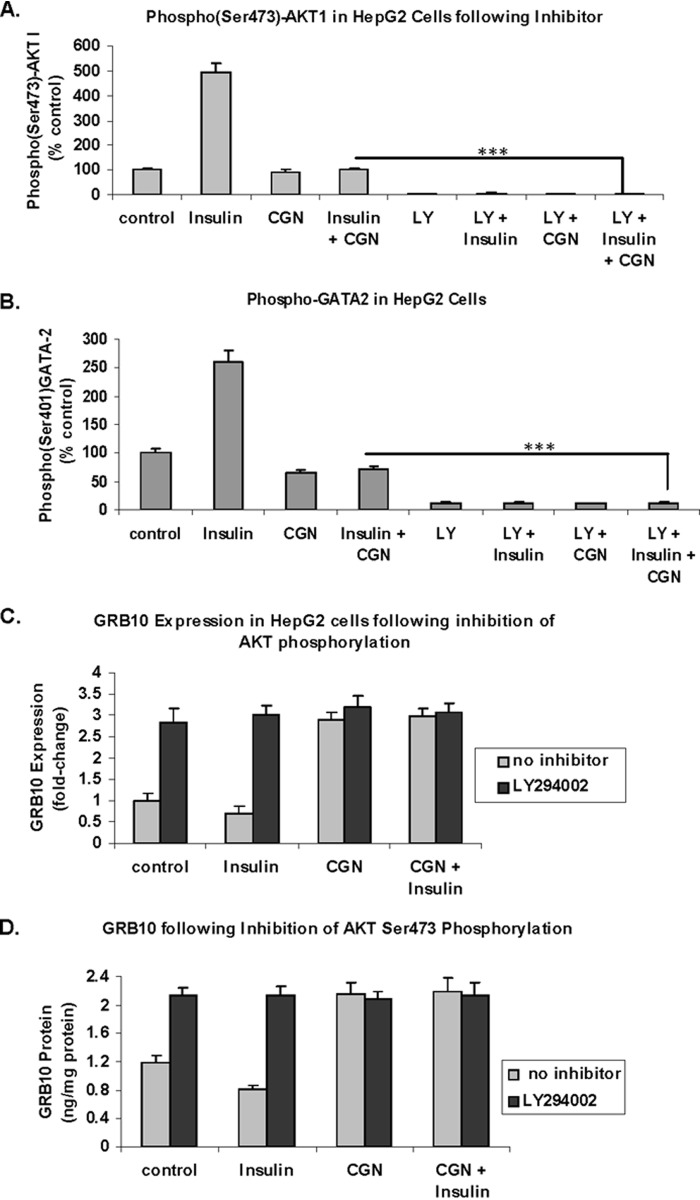
LY294002, an inhibitor of PI3K and mTOR, completely blocked phosphorylation of Ser473-AKT (Fig. 7A) and Ser401-GATA2 in the HepG2 cells (Fig. 7B) (p < 0.001). Carrageenan again blocked the insulin-induced increases in Ser(P)473-AKT and Ser(P)401-GATA2, but to a lesser extent than LY294002. Consistent with the demonstrated impact of GATA2 on GRB10 expression, LY294002 increased the mRNA (Fig. 7C) and protein expression (Fig. 7D) of GRB10 in the HepG2 cells. These findings further support an inverse association between Ser(P)473-AKT and GRB10 expression, mediated through Ser(P)401-GATA2 and GATA2.
FIGURE 7.
Inhibitor of PI3K-induced AKT Ser473 phosphorylation increases GRB10 expression. A, Ser(P)473-AKT was reduced in the HepG2 cells following exposure to LY294002 (50 μm × 24 h), an inhibitor of PI3K-mediated phosphorylation of AKT (*** for p < 0.001; n = 3). B, decline in Ser401 GATA2 phosphorylation was also evident following exposure to LY294002 (*** for p < 0.001; n = 3). This is consistent with the observed positive correlation between Ser(P)401-GATA2 and Ser(P)473-AKT. C, GRB10 mRNA expression, detected by QPCR, increased significantly following inhibition of AKT phosphorylation by LY294002 (*** for p < 0.001; n = 6). D, GRB10 protein, determined by ELISA, increased significantly following treatment with LY294002 (*** for p < 0.001, n = 3). CGN, carrageenan; LY, LY294002.
DISCUSSION
This study demonstrates the up-regulation of the adaptor protein GRB10 when HepG2 cells and C57BL/6J mice are exposed to the food additive carrageenan. The increase in GRB10 led to declines in the insulin-stimulated increases in Tyr(P)-IRS1 and Ser(P)473-AKT. The effects on GRB10 and on Tyr(P)-IRS1 were independent of carrageenan-initiated inflammation. Blockade of the inflammatory effects of carrageenan by TLR4 siRNA, BCL10 siRNA, and Tempol did not completely inhibit the carrageenan-mediated inhibition of insulin-stimulated Ser(P)473-AKT or inhibit the carrageenan-induced reduction in the insulin-induced increase in Tyr(P)-IRS1. The inflammatory responses stimulated by carrageenan treatment interfered with insulin signaling by increasing Ser(P)307-IRS1, which inhibits the propagation of insulin signaling (1), but did not affect the carrageenan-induced decline in the insulin-induced increase in Tyr(P)-IRS1, which propagates insulin signaling.
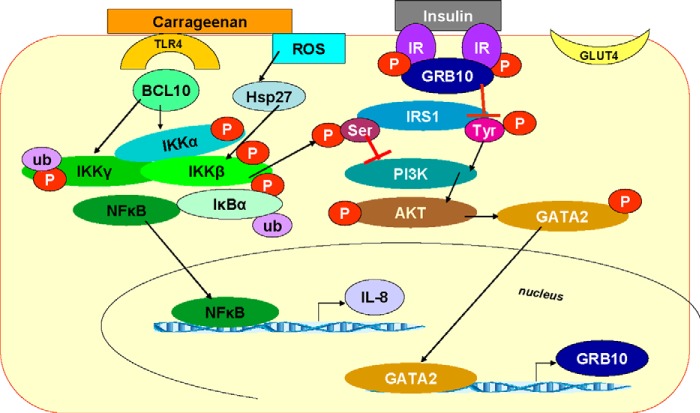
The carrageenan-induced decline in Tyr(P)-IRS1 is a second mechanism by which carrageenan contributes to insulin resistance. Carrageenan-initiated inflammatory pathways and GRB10 up-regulation both impede insulin signaling upstream of AKT phosphorylation and inhibit the insulin-induced Ser473 phosphorylation of AKT. These pathways and their cross-talk are presented in Fig. 8. Overall, studies demonstrate how inflammation-induced increase in Ser(P)307-IRS1 leads to decline in Ser(P)473-AKT and how decline in Ser(P)473-AKT can lead to increase in GRB10 expression and decline in Tyr(P)-IRS1. Thus, insulin resistance following carrageenan is mediated through inverse effects on Ser(P)307-IRS1 (increase) and Tyr(P)-IRS1 (decrease). The effect on Tyr(P)-IRS1 is enabled by the transcriptional response of GRB10 to changes in Ser(P)473-AKT that are transmitted through Ser(P)401-GATA2 and GATA2.
FIGURE 8.
Schematic illustration of effects of carrageenan on insulin signaling, mediated through GRB10 and inflammation. When inflammation is present, phospho-IκB kinase β leads to phosphorylation of Ser307 of IRS1, an inhibitor of insulin signaling. This leads to decline in Ser(P)473-AKT, with an associated decline in Ser(P)401-GATA2, an increase in nuclear GATA2, and an increase in mRNA expression of GRB10. The increase in GRB10 affects the downstream insulin signaling because of binding of GRB10 with the IR, leading to inhibition of tyrosine phosphorylation of IRS-1. Hence, feedback is initiated that leads to upstream inhibition of propagation of insulin signals and further insulin resistance when Ser(P)473-AKT is reduced by inflammation. AKT, protein kinase B; CGN, carrageenan; GRB, growth factor receptor-bound protein; Hsp, heat shock protein; IKK, IκB kinase; IRS, insulin receptor substrate; ROS, reactive oxygen species; ub, ubiquitin.
These insulin signaling pathways provide critical links between carrageenan-induced inflammation, which leads to interaction of phospho-IκB kinase β with Ser(P)307-IRS1, and subsequent phosphorylations of Ser473-AKT and Ser401-GATA2. These reactions lead to increased nuclear GATA2 and transcriptional activation of GRB10, which feeds back to inhibit Tyr(P)-IRS1. These interactions provide mechanistic links between the increase in Ser(P)307-IRS1 and the decline in Tyr(P)-IRS1 and help to clarify the relationship between Ser(P)307-IRS1 and Tyr(P)-IRS1 (39). Phosphorylations of IRS1 and their impact on the regulation of insulin sensitivity and propagation of insulin signaling have been considered in detail (39–42). In this report, we have presented a transcriptional mechanism whereby carrageenan exposure leads to increased mRNA expression of GRB10 by GATA2 activation of the GRB10 promoter, with attention to Ser307 of IRS1. Multiple sites of serine/threonine phosphorylation of IRS1 have been identified (39) and might also participate in the cascade of reactions described in this report but have not yet been evaluated.
Insulin was previously reported to induce GATA2 Ser401 phosphorylation by a PI3K/AKT-dependent mechanism in cultured preadipocytes (38). The interaction between Ser(P)473-AKT and Ser(P)401-GATA2 links the propagation of insulin signaling with a transcriptional mechanism.
Two distinct mechanisms of insulin resistance follow carrageenan exposure: 1) the previously reported inflammatory-derived signaling mechanism, whereby the Ser(P)473-AKT response to insulin is reduced by carrageenan-induced inflammation leading to increased Ser(P)307-IRS1, which inhibits downstream signaling (1); and 2) a transcriptional mechanism initiated by decline in Ser(P)307-AKT, with an associated decline in Ser(P)401-GATA2 and increase in nuclear GATA, leading to increased GRB10 expression and to GRB10 inhibition of Tyr(P)-IRS1 and Ser(P)473-AKT. The synergy between these mechanisms may lead to sustained insulin resistance following inflammation, as well as fine-tuning of responses to insulin in response to other exogenous stimuli.
The molecular mechanism by which carrageenan increased the mRNA expression of GRB10 expression was attributable to activation of the GRB10 promoter by increased nuclear GATA2. Increase in Ser(P)401-GATA2 was highly correlated (r = 0.97) with increase in Ser(P)473-AKT, without change in total GATA2. The transcription factor GATA2 has been reported to be activated and to translocate to the nucleus when dephosphorylated and to be degraded in the proteasome when phosphorylated (43). By increasing the phosphorylation of GATA2, insulin-induced increase in Ser(P)473-AKT reduced the GATA2 that could translocate to the nucleus and bind to the GRB10 promoter and thereby stimulate GRB10 expression. In contrast, carrageenan-induced inflammation inhibited the insulin-induced Ser(P)473-AKT and Ser(P)401-GATA2, enabling more unphosphorylated GATA2 to translocate to the nucleus and bind with the GRB10 promoter and stimulate GRB10 expression. Insulin alone reduced the binding of GATA2 to the GRB10 promoter, as shown by ChIP assay, consistent with insulin exposure leading to increases in Ser(P)473-AKT and Ser(P)401-GATA2. The increase in GRB10 can be sustained through a signaling loop, whereby reduction in Ser(P)473-AKT, initiated by inflammation, induces a second mechanism of insulin resistance mediated by increase in GRB10. Increase in GRB10 can then lead to further or persistent decline in Ser(P)473-AKT. The interaction between carrageenan-induced inflammation and enhanced GRB10 expression through Ser(P)473-AKT indicates how two mechanisms that cause insulin resistance can act together. By causing inflammation, carrageenan or other activators of inflammation initiate a cascade by which insulin resistance can become sustained through the ongoing impact of GRB10 on Ser(P)473-AKT. Because carrageenan is contained in so many food products, the consumption of carrageenan may contribute to the prevalence of insulin resistance and glucose intolerance associated with the Western diet. A recommendation to avoid ingestion of carrageenan-containing food products should be considered as part of routine nutritional counseling in patients with insulin resistance. Also, other sources of inflammation, such as infection, may also activate both the inflammatory and the GRB10 transcriptional mechanisms of insulin resistance and thereby lead to impaired insulin sensitivity and to glucose intolerance.
Footnotes
- TLR
- Toll-like receptor
- IRS
- insulin receptor substrate
- QPCR
- quantitative PCR
- IR
- insulin receptor.
REFERENCES
- 1. Bhattacharyya S., O'Sullivan I., Katyal S., Unterman T., Tobacman J. K. (2012) Exposure to the common food additive carrageenan leads to glucose intolerance, insulin resistance and inhibition of insulin signaling in HepG2 cells and C57BL/6J mice. Diabetologia 55, 194–203 [DOI] [PubMed] [Google Scholar]
- 2. Borthakur A., Bhattacharyya S., Dudeja P. K., Tobacman J. K. (2007) Carrageenan induces interleukin-8 production through distinct Bcl10 pathway in normal human colonic epithelial cells. Am. J. Physiol. Gastrointest. Liver Physiol. 292, G829–G838 [DOI] [PubMed] [Google Scholar]
- 3. Bhattacharyya S., Gill R., Chen M.-L., Zhang F., Linhardt R. J., Dudeja P. K., Tobacman J. K. (2008) Toll-like receptor 4 mediates induction of Bcl10-NFκB-IL-8 inflammatory pathway by carrageenan in human intestinal epithelial cells. J. Biol. Chem. 283, 10550–10558 [DOI] [PMC free article] [PubMed] [Google Scholar]
- 4. Bhattacharyya S., Dudeja P. K., Tobacman J. K. (2008) Carrageenan-induced NFκB activation depends on distinct pathways mediated by reactive oxygen species and Hsp27 or by Bcl10. Biochim. Biophys. Acta 1780, 973–982 [DOI] [PMC free article] [PubMed] [Google Scholar]
- 5. Bhattacharyya S., Borthakur A., Tyagi S., Gill R., Chen M. L., Dudeja P. K., Tobacman J. K. (2010) BCL10 is required for NFκB nuclear translocation by both canonical and non-canonical pathways and for NIK phosphorylation. J. Biol. Chem. 285, 522–530 [DOI] [PMC free article] [PubMed] [Google Scholar]
- 6. Gao Z., Hwang D., Bataille F., Lefevre M., York D., Quon M. J., Ye J. (2002) Serine phosphorylation of insulin receptor substrate 1 by inhibitor κB kinase complex. J. Biol. Chem. 277, 48115–48121 [DOI] [PubMed] [Google Scholar]
- 7. Nakamori Y., Emoto M., Fukuda N., Taguchi A., Okuya S., Tajiri M., Miyagishi M., Taira K., Wada Y., Tanizawa Y. (2006) Myosin motor Myo1c and its receptor NEMO/IKK-γ promote TNF-α-induced serine 307 phosphorylation of IRS-1. J. Cell Biol. 173, 665–671 [DOI] [PMC free article] [PubMed] [Google Scholar]
- 8. Kanety H., Feinstein R., Papa M. Z., Hemi R., Karasik A. (1995) Tumor necrosis factor α-induced phosphorylation of insulin receptor substrate-1 (IRS-1): possible mechanism for suppression of insulin-stimulated tyrosine phosphorylation of IRS-1. J. Biol. Chem. 270, 23780–23784 [DOI] [PubMed] [Google Scholar]
- 9. Huret J. L., Ahmad M., Arsaban M., Bernheim A., Cigna J., Desangles F., Guignard J. C., Jacquemot-Perbal M. C., Labarussias M., Leberre V., Malo A., Morel-Pair C., Mossafa H., Potier J. C., Texier G., Viguio F., Wan Y. C., Senon S., Zasadzinski A., Dessen P. (2013) Atlas of genetics and cytogenetics in oncology and haematology in 2013. Nucleic Acids Res. 41, D920–D924 [DOI] [PMC free article] [PubMed] [Google Scholar]
- 10. Depetris R. S., Wu J., Hubbard S. R. (2009) Structural and functional studies of the Ras-associating and pleckstrin-homology domains of Grb10 and Grb14. Nat. Struct. Mol. Biol. 16, 833–839 [DOI] [PMC free article] [PubMed] [Google Scholar]
- 11. Dong L. Q., Du H., Porter S. G., Kolakowski L. F., Jr., Lee A. V., Mandarino L. J., Fan J., Yee D., Liu F., Mandarino J. (1997) Cloning, chromosome localization, expression, and characterization of an Src homology 2 and pleckstrin homology domain-containing insulin receptor binding protein hGrb10γ. J. Biol. Chem. 272, 29104–29112 [DOI] [PubMed] [Google Scholar]
- 12. Laviola L., Giorgino F., Chow J. C., Baquero J. A., Hansen H., Ooi J., Zhu J., Riedel H., Smith R. J. (1997) The adapter protein Grb10 associates preferentially with the insulin receptor as compared with the IGF-1 receptor in mouse fibroblasts. J. Clin. Invest. 99, 830–837 [DOI] [PMC free article] [PubMed] [Google Scholar]
- 13. Hansen H., Svensson U., Zhu J., Laviola L., Giorgino F., Wolf G., Smith R. J., Riedel H. (1996) Interaction between the Grb10 SH2 domain and the insulin receptor carboxyl terminus. J. Biol. Chem. 271, 8882–8886 [DOI] [PubMed] [Google Scholar]
- 14. Wick K. R., Werner E. D., Langlais P., Ramos F. J., Dong L. Q., Shoelson S. E., Liu F. (2003) Grb10 inhibits insulin-stimulated insulin receptor substrate (IRS)-phosphatidylinositol 3-kinase/Akt signaling pathway by disrupting the association of IRS-1/IRS-2 with the insulin receptor. J. Biol. Chem. 278, 8460–8467 [DOI] [PubMed] [Google Scholar]
- 15. Dufresne A. M., Smith R. J. (2005) The adapter protein GRB10 is an endogenous negative regulator of insulin-like growth factor signaling. Endocrinology 146, 4399–4409 [DOI] [PubMed] [Google Scholar]
- 16. Wang L., Balas B., Christ-Roberts C. Y., Kim R. Y., Ramos F. J., Kikani C. K., Li C., Deng C., Reyna S., Musi N., Dong L. Q., DeFronzo R. A., Liu F. (2007) Peripheral disruption of the Grb10 gene enhances insulin signaling and sensitivity in vivo. Mol. Cell. Biol. 27, 6497–6505 [DOI] [PMC free article] [PubMed] [Google Scholar]
- 17. Rampersaud E., Damcott C. M., Fu M., Shen H., McArdle P., Shi X., Shelton J., Yin J., Chang Y. P., Ott S. H., Zhang L., Zhao Y., Mitchell B. D., O'Connell J., Shuldiner A. R. (2007) Identification of novel candidate genes for type 2 diabetes from a genome-wide association scan in the old order Amish. Diabetes 56, 3053–3062 [DOI] [PubMed] [Google Scholar]
- 18. Di Paola R., Wojcik J., Succurro E., Marucci A., Chandalia M., Padovano L., Powers C., Merla G., Abate N., Sesti G., Doria A., Trischitta V. (2010) GRB10 gene and type 2 diabetes in whites. J. Intern. Med. 267, 132–133 [DOI] [PMC free article] [PubMed] [Google Scholar]
- 19. Di Paola R., Ciociola E., Boonyasrisawat W., Nolan D., Duffy J., Miscio G., Cisternino C., Fini G., Tassi V., Doria A., Trischitta V. (2006) Association of hGrb10 genetic variations with type 2 diabetes in Caucasian subjects. Diabetes Care 29, 1181–1183 [DOI] [PubMed] [Google Scholar]
- 20. Yamamoto Y., Ishino F., Kaneko-Ishino T., Shiura H., Uchio-Yamada K., Matsuda J., Suzuki O., Sato K. (2008) Type 2 diabetes mellitus in a non-obese mouse model induced by Meg/Grb10. Exp. Anim. 57, 385–395 [DOI] [PubMed] [Google Scholar]
- 21. Charalambous M., Smith F. M., Bennett W. R., Crew T. E., Mackenzie F., Ward A. (2003) Disruption of the imprinted Grb10 gene leads to disproportionate overgrowth by an Igf2-independent mechanism. Proc. Natl. Acad. Sci. U.S.A. 100, 8292–8297 [DOI] [PMC free article] [PubMed] [Google Scholar]
- 22. Shiura H., Miyoshi N., Konishi A., Wakisaka-Saito N., Suzuki R., Muguruma K., Kohda T., Wakana S., Yokoyama M., Ishino F., Kaneko-Ishino T. (2005) Meg1/Grb10 overexpression causes postnatal growth retardation and insulin resistance via negative modulation of the IGF1R and IR cascades. Biochem. Biophys. Res. Commun. 329, 909–916 [DOI] [PubMed] [Google Scholar]
- 23. Prokopenko I., Poon W., Mägi R., Prasad B. R., Salehi S. A., Almgren P., Osmark P., Bouatia-Naji N., Wierup N., Fall T., Stančáková A., Barker A., Lagou V., Osmond C., Xie W., Lahti J., Jackson A. U., Cheng Y. C., Liu J., O'Connell J. R., Blomstedt P. A., Fadista J., Alkayyali S., Dayeh T., Ahlqvist E., Taneera J., Lecoeur C., Kumar A., Hansson O., Hansson K., Voight B. F., Kang H. M., Levy-Marchal C., Vatin V., Palotie A., Syvänen A. C., Mari A., Weedon M. N., Loos R. J., Ong K. K., Nilsson P., Isomaa B., Tuomi T., Wareham N. J., Stumvoll M., Widen E., Lakka T. A., Langenberg C., Tönjes A., Rauramaa R., Kuusisto J., Frayling T. M., Froguel P., Walker M., Eriksson J. G., Ling C., Kovacs P., Ingelsson E., McCarthy M. I., Shuldiner A. R., Silver K. D., Laakso M., Groop L., Lyssenko V. A. (2014) Central Role for GRB10 in regulation of islet function in man. PLoS Genet. 10, e1004235. [DOI] [PMC free article] [PubMed] [Google Scholar]
- 24. Monk D., Arnaud P., Frost J., Hills F. A., Stanier P., Feil R., Moore G. E. (2009) Reciprocal imprinting of human GRB10 in placental trophoblast and brain: evolutionary conservation of reversed allelic expression. Hum. Mol. Genet. 18, 3066–3074 [DOI] [PubMed] [Google Scholar]
- 25. Garfield A. S., Cowley M., Smith F. M., Moorwood K., Stewart-Cox J. E., Gilroy K., Baker S., Xia J., Dalley J. W., Hurst L. D., Wilkinson L. S., Isles A. R., Ward A. (2011) Distinct physiological and behavioral functions for parental alleles of imprinted Grb10. Nature 469, 534–538 [DOI] [PMC free article] [PubMed] [Google Scholar]
- 26. Macher B. A., Galili U. (2008) The Gal-α-1,3-Gal-β-1,4-GlcNAc-R (α-Gal) epitope: a carbohydrate of unique evolution and clinical relevance. Biochim. Biophys. Acta 1780, 75–88 [DOI] [PMC free article] [PubMed] [Google Scholar]
- 27. Tanemura M., Yin D., Chong A. S., Galili U. (2000) Differential immune responses to α-gal epitopes on xenografts and allografts: implications for accommodation in xenotransplantation. J. Clin. Invest. 105, 301–310 [DOI] [PMC free article] [PubMed] [Google Scholar]
- 28. Galili U. (2005) The α-gal epitope and the anti-Gal antibody in xenotransplantation and in cancer immunotherapy. Immunol. Cell Biol. 83, 674–686 [DOI] [PubMed] [Google Scholar]
- 29. Bhattacharyya S., Liu H., Zhang Z., Jam M., Dudeja P. K., Michel G., Linhardt R. J., Tobacman J. K. (2010) Carrageenan-induced innate immune response is modified by enzymes that hydrolyze distinct galactosidic bonds. J. Nutr. Biochem. 21, 906–913 [DOI] [PMC free article] [PubMed] [Google Scholar]
- 30. Shi H., Kokoeva M. V., Inouye K., Tzameli I., Yin H., Flier J. S. (2006) TLR4 links innate immunity and fatty acid-induced insulin resistance. J. Clin. Invest. 116, 3015–3025 [DOI] [PMC free article] [PubMed] [Google Scholar]
- 31. Song M. J., Kim K. H., Yoon J. M., Kim J. B. (2006) Activation of Toll-like receptor 4 is associated with insulin resistance in adipocytes. Biochem. Biophys. Res. Commun. 346, 739–745 [DOI] [PubMed] [Google Scholar]
- 32. Mohammad M. K., Morran M., Slotterbeck B., Leaman D. W., Sun Y., Grafenstein H., Hong S. C., McInerney M. F. (2006) Dysregulated Toll-like receptor expression and signaling in bone marrow-derived macrophages at the onset of diabetes in the non-obese diabetic mouse. Int. Immunol. 18, 1101–1113 [DOI] [PubMed] [Google Scholar]
- 33. Bhattacharyya S., Pant N., Dudeja P. K., Tobacman J. K. (2007) Development, evaluation, and application of a highly sensitive microtiter plate ELISA for human BCL10 protein. J. Immunoassay Immunochem. 28, 173–188 [DOI] [PubMed] [Google Scholar]
- 34. Vlahos C. J., Matter W. F., Hui K. Y., Brown R. F. (1994) A specific inhibitor of phosphatidylinositol 3-kinase, 2-(4-morpholinyl)-8-phenyl-4H-1-benzopyran-4-one (LY294002). J. Biol. Chem. 269, 5241–5248 [PubMed] [Google Scholar]
- 35. Ballou L. M., Selinger E. S., Choi J. Y., Drueckhammer D. G., Lin RZ. (2007) Inhibition of mammalian target of rapamycin signaling by 2-(morpholin-1-yl)pyrimidol[2,1-α]isoquinolin-4-one. J. Biol. Chem. 282, 24463–24470 [DOI] [PubMed] [Google Scholar]
- 36. Bhattacharyya S., Feferman L., Tobacman J. K. (2014) Arylsulfatase B regulates versican expression by galectin-3 and AP-1 mediated transcriptional effects. Oncogene 33, 5467–5476 [DOI] [PMC free article] [PubMed] [Google Scholar]
- 37. Heinemeyer T., Wingender E., Reuter I., Hermjakob H., Kel A. E., Kel O. V., Ignatieva E. V., Ananko E. A., Podkolodnaya O. A., Kolpakov F. A., Podkolodny N. L., Kolchanov N. A. (1998) Databases on transcriptional regulation: TRANSFAC, TRRD, and COMPEL. Nucleic Acids Res. 26, 362–367 [DOI] [PMC free article] [PubMed] [Google Scholar]
- 38. Menghini R., Marchetti V., Cardellini M., Hribal M. L., Mauriello A., Lauro D., Sbraccia P., Lauro R., Federici M. (2005) Phosphorylation of GATA2 by Akt increases adipose tissue differentiation and reduces atherosclerosis, adipose tissue-related inflammation: a novel pathway linking obesity to atherosclerosis. Circulation 111, 1946–1953 [DOI] [PubMed] [Google Scholar]
- 39. Hançer N. J., Qiu W., Cherella C., Li Y., Copps K. D., White M. F. (2014) Insulin and metabolic stress stimulate multisite serine/threonine phosphorylation of insulin receptor substrate 1 and inhibit tyrosine phosphorylation. J. Biol. Chem. 289, 12467–12484 [DOI] [PMC free article] [PubMed] [Google Scholar]
- 40. Boura-Halfon S., Zick Y. (2009) Phosphorylation of IRS proteins, insulin action, and insulin resistance. Am. J. Physiol. Endocrinol. Metab. 296, E581–E591 [DOI] [PubMed] [Google Scholar]
- 41. Samuel V. T., Shulman G. I. (2012) Mechanisms for insulin resistance: common threads and missing links. Cell 148, 852–871 [DOI] [PMC free article] [PubMed] [Google Scholar]
- 42. Copps K. D., White M. F. (2012) Regulation of insulin sensitivity by serine/threonine phosphorylation of insulin receptor substrate proteins IRS1 and IRS2. Diabetologia 55, 2565–2582 [DOI] [PMC free article] [PubMed] [Google Scholar]
- 43. Towatari M., May G. E., Marais R., Perkins G. R., Marshall C. J., Cowley S., Enver T. (1995) Regulation of GATA2 phosphorylation by mitogen-activated protein kinase and interleukin-3. J. Biol. Chem. 270, 4101–4107 [DOI] [PubMed] [Google Scholar]


