

Background: Sarcolipin (SLN), a regulator of SR Ca2+ ATPase (SERCA) in muscle, can promote the uncoupling of SERCA from Ca2+ transport and increase heat production.
Results: Overexpression of SLN in muscle increases energy expenditure and provides resistance against diet-induced obesity.
Conclusion: SLN plays a role in whole-body metabolism.
Significance: SLN can serve as novel target to increase energy expenditure in muscle.
Keywords: Mitochondria, Obesity, Sarcoplasmic Reticulum (SR), Skeletal Muscle, Skeletal Muscle Metabolism, Energy Expenditure, Oxidative Metabolism, SERCA, Sarcolipin
Abstract
Sarcolipin (SLN) is a novel regulator of sarcoplasmic reticulum Ca2+ ATPase (SERCA) in muscle. SLN binding to SERCA uncouples Ca2+ transport from ATP hydrolysis. By this mechanism, SLN promotes the futile cycling of SERCA, contributing to muscle heat production. We recently showed that SLN plays an important role in cold- and diet-induced thermogenesis. However, the detailed mechanism of how SLN regulates muscle metabolism remains unclear. In this study, we used both SLN knockout (Sln−/−) and skeletal muscle-specific SLN overexpression (SlnOE) mice to explore energy metabolism by pair feeding (fixed calories) and high-fat diet feeding (ad libitum). Our results show that, upon pair feeding, SlnOE mice lost weight compared with the WT, but Sln−/− mice gained weight. Interestingly, when fed with a high-fat diet, SlnOE mice consumed more calories but gained less weight and maintained a normal metabolic profile in comparison with WT and Sln−/− mice. We found that oxygen consumption and fatty acid oxidation were increased markedly in SlnOE mice. There was also an increase in both mitochondrial number and size in SlnOE muscle, together with increased expression of peroxisome proliferator-activated receptor δ (PPARδ) and PPAR γ coactivator 1 α (PGC1α), key transcriptional activators of mitochondrial biogenesis and enzymes involved in oxidative metabolism. These results, taken together, establish an important role for SLN in muscle metabolism and energy expenditure. On the basis of these data we propose that SLN is a novel target for enhancing whole-body energy expenditure.
Introduction
Obesity is a global epidemic, posing a major health care threat by contributing to higher incidences of cancer, heart diseases, and diabetes (1). Obesity results from an imbalance between caloric intake and energy expenditure. Enhancing energy expenditure by decreasing metabolic efficiency offers an effective strategy to counter the rate of obesity and associated disorders (2, 3). Skeletal muscle accounts for ∼40% of the total body mass and is the major site for substrate utilization (4, 5). Although exercise has been proposed as an effective strategy to increase energy expenditure, it is not well adhered to (6, 7). Therefore, alternative methods to enhance energy expenditure in muscle should be explored. In this regard, recent studies have highlighted the role of sarcoplasmic reticulum Ca2+ cycling in energy expenditure (8). We and others have identified SLN2 as a novel regulator of SERCA in muscle (9, 10). Studies have also highlighted that SLN binding to SERCA uncouples ATPase activity from Ca2+ transport (which promotes the futile cycling of the SERCA pump), thereby increasing ATP hydrolysis and heat production (10, 11).
By generating both loss (Sln−/−) and gain of function (skeletal muscle-specific SLN overexpression, SlnOE) mouse models, we demonstrated recently that SLN is an important player in adaptive thermogenesis, including cold- and diet-induced thermogenesis (12). We showed that Sln−/− mice failed to maintain body temperature (37 °C) when exposed to acute cold (12). Furthermore, when fed a high-fat diet, Sln−/− mice became highly obese, which suggests that the uncoupling action of SLN contributes to whole-body energy metabolism (12). However, these studies were performed at 22 °C (mild cold stress), a condition that also activates thermogenesis. Therefore, it remains unclear whether the metabolic phenotype could be due to cold-induced thermogenesis. Therefore, we chose to perform all our experiments under thermoneutrality (29 °C ± 1 °C), where adaptive thermogenic mechanisms are not recruited. The main objective of this study was to investigate the role of SLN in metabolism and energy expenditure by challenging mice (SlnOE and Sln−/−) to pair feeding and high-fat diet (HFD) treatment. Our results demonstrate that when mice were pair fed, higher SLN expression in muscle increased energy demand and resulted in weight loss. Interestingly, when mice were fed with a HFD (ad libitum), mice overexpressing SLN were resistant to diet-induced obesity through significant up-regulation of the oxidative metabolism. These studies suggest that SLN uncoupling of SERCA is an important regulator of energy expenditure in muscle, thereby contributing to whole-body energy homeostasis.
EXPERIMENTAL PROCEDURES
Animals
The skeletal muscle-specific Sln overexpression mouse model (SlnOE) was generated using a human skeletal α-actin promoter (13). The generation of Sln−/− mice has been described previously (9). Animal procedures were approved by the Ohio State University Institutional Animal Care and Use Committee and conducted in accordance with the Guide for the Care and Use of Laboratory Animals. All animal experiments were performed at thermoneutrality (29 °C ± 1 °C) to minimize contribution from brown adipose tissue-mediated, diet-induced thermogenesis because the normal housing temperature (22 °C) is a mild cold stress for mice.
Pair Feeding Study
During the course of our study, we observed that SlnOE mice consume more calories (compared with Sln−/− and WT mice) when fed ad libitum (data not shown). Therefore, we reasoned that a pair feeding strategy will show the intrinsic differences in metabolic rate between these mice. For pair feeding experiments, wild-type, Sln−/−, and SlnOE mice (14–16 weeks old) were housed individually. Each group had six mice, and each mouse received an equal amount of calories (2.5 g of regular chow diet/day/mouse) for a period of 9 weeks, maintained at 29 °C ± 1 °C. The 2.5-g pair feeding regimen was chosen on the basis of the daily average food consumption of Sln−/− mice. Changes in body weight were recorded weekly.
High-fat Diet Studies
SlnOE, Sln−/−, and WT mice (8 weeks old, n = 12) were fed with a HFD (45% calories from fat, Research Diet Inc.) for a period of 12 weeks, maintained at 29 °C ± 1 °C. Food consumption and body weight were measured weekly. Total calorie intake was calculated from the measured food intake during 12 weeks of feeding. Feed (caloric) efficiency was expressed as the body weight gain divided by the total calorie intake between the start and the end of the experiment.
Histology
Epididymal white adipose tissue, brown adipose tissue, liver, and various skeletal muscles were fixed in 10% normal buffered formalin solution and embedded in paraffin. Sections were stained with H&E, and liver sections were also stained with osmium tetraoxide to show lipid droplets. A light microscope (Zeiss Axioskop 40, Oberkochen, Germany) was used to generate images. Succinate dehydrogenase (SDH) activity staining was performed on sections of tibialis anterior (TA) muscle as described earlier, with slight modifications (14).
Glucose Tolerance Test and Measurement of Lipid Profile
After 12 weeks of HFD feeding, mice were fasted overnight, and dextrose (2 mg/g body weight) was injected intraperitoneally for glucose tolerance testing. A blood sample was collected from the tail nick to measure blood glucose 0, 30, 60, 90, and 120 min after the dextrose injection. Blood glucose levels were measured using a TRUEtrack® blood glucose monitoring kit. Blood triglycerides and total cholesterol were measured in overnight-fasted animals using the CardioChek® analyzer and test strips. Nonesterified fatty acids were measured by use of an HR series NEFA-HR kit (Wako Diagnostics)
Whole-body Oxygen Consumption and Physical Activity Measurement
Oxygen consumption (VO2), CO2 production (VCO2), respiratory exchange ratio (RER, VCO2/VO2), and heat production (energy expenditure) were measured simultaneously using an Oxymax comprehensive laboratory animal monitoring system (Columbus Instruments, Columbus, OH) (15, 16). These parameters were measured individually in a resting state at the housing temperature (29 °C ± 1.0 °C) with ad libitum food and water. RER is the ratio of the volume of CO2 produced to the volume of O2 consumed (VCO2/VO2). A RER value closer to 0.7 indicates fat utilization, whereas a value closer to 1.0 means carbohydrate use. Voluntary physical activity was evaluated by infrared beam breaks for both horizontal and vertical movements.
Oxygen Consumption in Isolated Muscle
Isolated muscle oxygen consumption (17, 18) was measured using the TIOX tissue bath system (Harvard Apparatus, Holliston, MA). Soleus muscles from HFD-fed SlnOE and WT mice (n = 3) were isolated, and oxygen consumption was measured during rest and electrical stimulation (20 V, 600-ms pulse every 2 min from 10–250 Hz). After 30 min, caffeine (3 mm, a dose sufficient to cause a sarcoplasmic reticulum Ca2+ leak from RyR1 but not muscle contraction (19)) was added along with electrical stimulation, and isolated muscle oxygen consumption measurements were taken. Baseline oxygen without muscle was subtracted from experimental values to give muscle oxygen consumption (17).
Electron Microscopy of Muscle Tissues
Skeletal muscle mitochondrial abundance was determined using a Tecnai G2 Spirit transmission electron microscope (FEI, Hillsboro, OR) at various magnifications by a blinded investigator (15). Muscle tissue from 4 mice/group was analyzed, and 15 electron micrographic images were acquired for each sample to count mitochondrial numbers.
Quantification of Mitochondrial DNA
Genomic/mitochondrial DNA was isolated using the RNAzol method, followed by back extraction with 4 m guanidine thiocyanate, 50 mm sodium citrate, and 1 m Tris and an alcohol precipitation. Mitochondrial DNA content was determined by SYBR Green analysis (Applied Biosystems). The levels of NADH dehydrogenase subunit 1 (Nd1, mitochondrial DNA) were normalized to the levels of peptidylprolyl isomerase A (Ppia, genomic DNA). The primer sequences were as follows: mt-Nd1, GTTGGTCCATACGGCATTTT (forward) and TGGGTGTGGTATTGGTAGGG (reverse); Nuc-Ppia, GCATACGGGTCCTGGCATCTTGTCC (forward) and ATGGTGATCTTCTTGCTGGTCTTGC (reverse).
Gene Expression Analysis
Total RNA was isolated from TA muscles using TRIzol reagent in accordance with the guidelines of the manufacturer. 1.0 μg of RNA was reverse-transcribed using the Maxima first-strand cDNA synthesis kit (Qiagen). Gene expression analysis was performed on QuantStudioTM 12K Flex real-time PCR system using a custom-designed PCR array (SA Biosciences).
Western Blotting
Expression levels of mitochondrial and other signaling proteins were determined by Western blot as described earlier (20). Skeletal muscle tissues were homogenized in ice-cold homogenization buffer (NaCl, 137 mm; KCl, 2.7 mm; MgCl2, 1 mm; Na4O7P2, 5 mm; NaF, 10 mm; Nonidet P-40, 100 1%; glycerol, 10%; Tris (pH 7.8), 20 mm; EDTA, 1 mm; PMSF, 0.2 mm; Na3VO4, 0.5 mm; and protease inhibitor mixture, 1× (Calbiochem, Merck Millipore, Billerica, MA)). After electrophoresis, proteins were transferred to 0.45 μm nitrocellulose membranes. Membranes were washed with Tris-buffered saline containing 0.5% Tween 20 (TBS-T) and blocked for nonspecific binding (room temperature, 1 h, 5% (w/v) nonfat milk in TBS-T). Membranes were probed with primary antibodies for either 2 h at room temperature or overnight at 4 °C. The primary antibodies used include oxidative phosphorylation (OXPHOS) antibody mixture (Abcam, Cambridge, MA), CPT1-M antibody (Alpha Diagnostics, San Antonio, TX), anti-lipoprotein lipase antibody (catalog no. ab21356), and Anti-PPAR δ antibody (catalog no. ab137724) from Abcam, and PGC1α antibody was obtained from Cell Signaling Technology. NFATc3 (catalog no. sc8321) and pNFATc3 (catalog no. sc32982) were purchased from Santa Cruz Biotechnology Inc. After being washed with 0.05% TBS-T, blots were probed with the appropriate horseradish peroxidase-linked secondary antibody for 1 h at room temperature and then washed again with 0.05% TBS-T, developed with enhanced chemiluminescent substrate (Amersham Biosciences ECL Prime Western blotting detection reagent, catalog no. RPN2236), and exposed to x-ray film. The autoradiograph was quantitated by densitometric analysis with ImageJ software. SERCA1a or α-actin was used as loading control.
β2-Adrenergic Agonist Treatment
To investigate the role of SLN in muscle energy expenditure, we also studied the effect of formoterol, a selective β2-adrenergic receptor agonist, on age-matched SlnOE, Sln−/−, and WT mice. Prior to treatment, mice were acclimated for 48 h in individual comprehensive laboratory animal monitoring system metabolic cages, and oxygen consumption was monitored continuously. Formoterol (dissolved in sterile PBS) or PBS (Gibco) was injected intraperitoneally at a dose of 1 mg/kg (21). After injection, the mice were returned back to their respective cages to continue metabolic measurements.
Data Analysis
Statistical analyses were performed using GraphPad Prism software (version 6.0). All data are expressed as mean ± S.E. Either (where appropriate) Student's t test or analysis of variance followed by a Tukey's or Bonferroni post hoc test were performed. The following levels of significance were used: *, p < 0.05; **, p < 0.01; #, p < 0.001.
RESULTS
Pair Feeding of SlnOE Mice Results in Significant Weight Loss
We have reported previously that loss of SLN in mice leads to diet-induced obesity, whereas WT mice were less obese but had up-regulated SLN expression (12). To understand the role of SLN level in muscle metabolism, we also developed an SlnOE mouse model in which SLN is expressed at high levels in both fast- and slow-twitch skeletal muscle tissues in comparison with WT animals (12). Interestingly SlnOE mice show a higher basal oxygen consumption compared with WT and Sln−/− animals (Fig. 1A). In this study, we tested whether overexpression of SLN affects energy expenditure using a pair feeding strategy. 14- to 16-week-old SlnOE, Sln−/−, and WT mice were pair-fed (mice were pair-fed an equal amount of calories) for a period of 9 weeks at thermoneutrality (29 °C ± 1 °C), a temperature that does not evoke cold-induced thermogenesis. At the end of pair feeding, SlnOE mice exhibited a significant loss in body weight compared with WT mice (Fig. 1B). In contrast, Sln−/− mice showed a significant gain in body weight compared with WT mice under the pair-fed condition (Fig. 1B). The greater energy expenditure in SlnOE mice is likely due to a higher energy cost for muscle work (and lower caloric efficiency, Fig. 1C) because there is no difference in physical activity among the groups (data not shown). The increased energy expenditure was further supported by a decrease in fat mass (Fig. 1D) and a smaller size of adipocytes in SlnOE mice (Fig. 1E). The decrease in fat mass is due to an increased reliance on fatty acid oxidation, which is further confirmed by RER data because the RER of SlnOE mice was shifted toward 0.7 (data not shown). Next we studied whether the oxidative capacity was enhanced in muscle by determining SDH activity staining using succinate as substrate (22). SDH staining demonstrated that SlnOE muscle had increased SDH activity, a sign of high oxidative capacity in SlnOE mice (Fig. 1F). These data suggest that an increasing SLN level can affect energy expenditure and whole-body metabolism.
FIGURE 1.

Pair feeding of SlnOE mice results in a significant loss in body weight and fat mass. A, whole-body VO2 in Sln−/−, WT, and SlnOE mice. B, body before and after pair feeding (n = 7). C, caloric efficiency shown as change in body weight per gram of diet consumed. D, mass of total WAT after pair feeding. E, H&E staining of sections of WAT. F, SDH staining of TA muscle. *, p < 0.05; #, p < 0.001.
SlnOE Mice Gain Less Weight on a High-fat Diet Despite Consuming More Calories
We were excited by the finding that SLN increases energy expenditure in mice. Therefore, we next investigated whether increased SLN expression in muscle can provide resistance against high-fat diet-induced obesity. SlnOE and WT littermates were fed ad libitum with a HFD (45% calories from fat) for 12 weeks, and mice were housed at thermoneutrality (29 °C ± 1 °C). We found that SlnOE mice gained significantly less weight during HFD feeding (Fig. 2A) and, after 12 weeks, showed 36.2% less net weight gain (p < 0.001, Fig. 2B) despite consuming more calories (36.1% more, p < 0.001, Fig. 2C) compared with WT littermates. Furthermore, analysis of caloric efficiency revealed that SlnOE mice gained significantly less weight per calorie consumed (47% lower than WT mice, p < 0.001, Fig. 2D). Interestingly, HFD-fed SlnOE mice showed a lower fasting blood glucose level and did not develop glucose intolerance, as evidenced by faster glucose clearance during an intraperitoneal glucose tolerance test (Fig. 2E). In addition, SlnOE mice showed an improved lipid profile (lower blood cholesterol (Fig. 2F), triglycerides (Fig. 2G), and nonesterified fatty acid levels (Fig. 2H)) compared with HFD-fed WT controls.
FIGURE 2.

SlnOE mice show resistance to high-fat diet-induced obesity. A, weight gain during 12 weeks of feeding (n = 15). B, net weight after 12 weeks of feeding. C, caloric intake is significantly higher in SlnOE mice. D, caloric efficiency (weight gain per kilocalorie consumed). E, intraperitoneal glucose tolerance test. F, fasting blood cholesterol level. G, triglyceride levels. H, nonesterified fatty acids (NEFA) levels. I, mass of total body white fat. J, MRI images of WT and SlnOE mice (fat depots are shown in red). K, H&E staining of WAT (top panel) and brown adipose tissue (BAT) sections (bottom panel). L, H&E staining (top panel) and osmium tetraoxide (tet) staining (bottom panel) of liver sections. *, p < 0.05; **, p < 0.01; #, p < 0.001.
Compared with WT mice, HFD-fed SlnOE mice showed less fat deposition, as determined by MRI and histological analysis. Quantification of WAT by weighing (Fig. 2I) and MRI (Fig. 2J) showed smaller fat depots in SlnOE compared with WT mice. Histological analysis of fat tissues revealed a decreased adipocyte size and increased cellular density in WAT and brown adipose tissue (Fig. 2K) as well as lesser lipid droplet accumulation in the liver (Fig. 2L). HFD feeding did not affect muscle mass (lean body mass) and its architecture in SlnOE mice (data not shown).
To determine energy expenditure, we measured the metabolic rate (oxygen consumption) and RER in whole animals and in isolated muscle following HFD feeding. SlnOE mice showed increased daily VO2 (Fig. 3A) (7.7% higher during the light period and 19.3% higher during the dark period (Fig. 3B)). Interestingly, we found that RER was significantly lower in SlnOE mice compared with WT mice (SlnOE = 0.80, WT = 0.85) during the active period (Fig. 3C), indicating an increase in fatty acid utilization in SlnOE mice. Further analysis of whole-body metabolic measurements shows greater energy expenditure in SlnOE mice (Fig. 3D) (26.7% greater than WT, p = 0.0108, Fig. 3E). However, voluntary physical activity was not significantly different between SlnOE and WT mice (data not shown), which suggests that an increasing level of SLN is sufficient to promote energy expenditure.
FIGURE 3.

SlnOE mice display increased oxygen consumption, energy expenditure, and fat utilization. A and B, whole-body VO2. C, RER (VCO2/VO2). D, 24-h whole-body energy expenditure (EE). E, regression-adjusted 24-h energy expenditure. F, overexpression of SLN increases muscle oxygen consumption. Isolated soleus muscle from SlnOE mice show increased oxygen consumption in the resting state and when stimulated with electrical stimulation ± caffeine (3 mm), as measured by a TIOX tissue bath system (n = 4). *, p < 0.05; **, p < 0.01; #, p < 0.001.
In support of this, studies using isolated soleus muscle from SlnOE mice showed 57% higher oxygen consumption in the resting state (Fig. 3F), which nearly doubled (∼2-fold, p < 0.05) during electrical stimulation and increased further with caffeine treatment compared with the resting state (Fig. 3F). These data suggest that higher SLN levels in muscle increase the energy cost both in the whole animal and in isolated muscle.
SLN Increases the Mitochondrial Biogenesis and Oxidative Capacity of Muscle
The finding that SlnOE mice have increased oxygen consumption and fatty acid utilization prompted us to investigate whether SLN promotes oxidative metabolism. Therefore, we investigated whether SLN overexpression altered the mitochondrial content in muscle tissues from HFD-fed SlnOE, Sln−/−, and WT mice. Electron microscope analysis showed a striking increase in mitochondrial content in the muscles of SlnOE mice (Fig. 4): 50% higher (p = 0.005) in fast-twitch TA muscle (Fig. 4, A and C) and 55% higher (p = 0.012) in extensor digitorum longus muscle (Fig. 4, B and C) compared with the WT. On the other hand, mitochondrial content was significantly lower in Sln−/− mice both in TA (15% lower; p < 0.05; Fig. 4, A and C) and extensor digitorum longus (20% lower, p < 0.05; Fig. 4, B and C) muscles compared with the WT. Remarkably, the mitochondria were much larger and showed elaborate and compactly packed cristae with an increased inner mitochondrial membrane volume in SlnOE muscle tissues (Fig. 4D), whereas mitochondria of Sln−/− muscle had less abundant cristae (Fig. 4D). Mitochondrial DNA copy number was increased in parallel with the higher mitochondrial content in SlnOE muscle, whereas it was decreased in Sln−/− muscle (Fig. 4E).
FIGURE 4.

Overexpression of SLN increases mitochondrial content. A, representative transmission electron micrographs of TA muscles from HFD-fed WT, SlnOE, and Sln−/− mice. B, electron micrographs of extensor digitorum longus muscle. C, average mitochondrial numbers in TA and extensor digitorum longus muscle (n = 5). D, higher magnification electron micrographs showing much larger mitochondria with elaborate cristae in SlnOE muscle. E, mitochondrial DNA quantification (the mitochondrial gene Nd1 was normalized to the nuclear gene Ppia). *, p < 0.05; **, p < 0.01.
In line with increased mitochondrial content, we found an increase in the expression of enzymes involved in oxidative metabolism, including electron transport chain/OxPhos, NADH dehydrogenase (ubiquinone) 1 α subcomplex (Ndufa1), cytochrome c-1 (Cyc1), cytochrome oxidase subunit V isoform a (Cox5a), and ATP synthase F1 complex α subunit 1 (ATP5a1)), enzymes involved in the maintenance of mitochondrial redox potential (glycerol-3-phosphate dehydrogenase 2 (Gpd2), and enzymes involved in the tricarboxylic acid cycle (citrate synthase) in SlnOE muscles (Fig. 5A). Protein expression of subunits of electron transport chain complexes was increased in line with mRNA expression (Fig. 5B).
FIGURE 5.

Overexpression of SLN increases oxidative capacity and transcriptional activators of mitochondrial biogenesis. A, expression pattern of mitochondrial electron transport chain (ETC) genes. B, Western blot showing expression of different subunits of electron transport chain proteins. C, SDH staining of TA muscle of HFD-fed WT and SlnOE mice. D, gene expression of enzymes involved in fatty acid transporters and oxidation. E, protein level of CPT1-M and lipoprotein lipase (LPL) in various skeletal muscles (gastrocnemius (Gastro), quadriceps (Quad), and TA). F, mRNA expression level of genes involved mitochondrial biogenesis. Tfam, mitochondrial transcription factor A. G, PPARδ and PGC1α protein expression levels in various muscles. H, gene expression of calcium signaling mediators. CamKII, Ca2+/calmodulin-dependent protein kinase II. I, calcineurin activity in the whole homogenates of the indicated muscles. J, phosphorylated (pNFAT) and total NFAT protein levels. K, densitometric analysis of pNFAT/NFAT. *, p < 0.05; **, p < 0.01; #, p < 0.001.
Next we studied whether the oxidative capacity was enhanced in fast-twitch muscles of HFD-fed SlnOE mice by determining SDH activity staining. Our data show a significant increase in SDH activity staining in TA muscle of SlnOE mice compared with WT muscle (Fig. 5C). However, myosin ATPase staining under acidic conditions (which is permissive for myosin heavy chain 1 (MHC1) ATPase activity but not for MHC2ATPase) shows that there was no switch in myosin isoforms (data not shown).
Furthermore, we observed a significant increase in the expression of several genes involved in fatty acid transport and oxidation (Cd36, Fabp5, Cpt1b, Pdk4, Lpl, and Acadl) (Fig. 5D). Protein expression of CPT1-M, involved in fatty acid transport and lipoprotein lipase, a major regulator of fatty release, were also highly up-regulated in SlnOE muscle (Fig. 5E).
We also observed an increase in PGC-1α, PGC-1β, PPARδ, and mitochondrial transcription factor A master regulators of mitochondrial biogenesis (Fig. 5, F and G). Similarly, there is an up-regulation of the transcription factors NRF-1 and NRF-2 (Fig. 5F), involved in regulating OXPHOS genes and coordinating nuclear and mitochondrial genomes (23). These studies suggest that SLN promotes the oxidative phenotype in muscle through increased mitochondrial biogenesis.
We additionally investigated whether SLN mediated increase in mitochondrial biogenesis involves Ca2+ dependent signaling pathways, especially the CAMKII and calcineurin/NFAT pathway (23–27). We found an increased expression of CamkII (and its target Gsk3b) as well as calcineurin (and its target Nfam1) (Fig. 5H). In support of gene expression data, there was also an ∼25% increase in calcineurin phosphatase activity (Fig. 5I) and a corresponding decrease (30–50%) in phosphorylated NFATc3 (Fig. 5, J and K) in the various muscles of SlnOE compared with WT mice. These data suggest that SLN acts through Ca2+-dependent signaling mechanisms to increase the oxidative metabolism in response to increased energy demand.
β2-Adrenergic-mediated Increase in Energy Expenditure in Muscle Requires SLN
Up-regulation of the metabolic rate under acute physiological conditions requires β adrenergic signaling. Formoterol, a β2-adrenergic receptor-specific agonist, is well known to increase the metabolic rate in peripheral tissues, particularly in skeletal muscle (21, 28). However, it is unknown whether SLN is part of this mechanism to increase metabolism. Therefore, we administered formoterol to SlnOE, Sln−/−, and WT mice. After formoterol administration, oxygen consumption was increased significantly in SlnOE mice (Fig. 6A, 14.2% increase, p < 0.001) compared with WT mice (4.4% increase, p < 0.05, Fig. 6B), whereas Sln−/− mice failed to increase oxygen consumption in response to formoterol treatment (Fig. 6, A and B). Interestingly, RER analysis showed that formoterol enhanced fatty acid utilization in SlnOE mice (12.7% increase compared with WT mice, p = 0.037) but not in Sln−/− mice (6.4% decrease compared with WT mice, p = 0.043) (Fig. 6C). These data support our main idea that SLN is an important component of the β2-adrenergic-mediated increase in energy expenditure.
FIGURE 6.
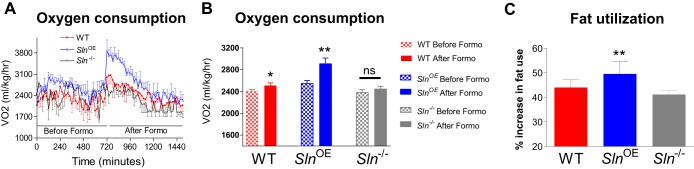
Formoterol treatment increases energy expenditure in SlnOE but not in Sln−/− mice. A and B, oxygen consumption before and after treatment with formoterol, a β2-adrenergic receptor-selective agonist (n = 8). C, percentage change in fatty acid utilization after formoterol administration. *, p = 0.05; **, p < 0.01; ns, not significant.
DISCUSSION
We have reported previously that loss of SLN predisposes mice to diet-induced obesity, which indicates that SLN may play a role in energy balance (12). A major objective of this study was to understand how increasing SLN expression levels affect energy expenditure and contribute to whole-body metabolism using SlnOE mice. During the course of our study, we observed that SlnOE mice consume more calories (compared with Sln−/− and WT mice) when fed ad libitum. Therefore, we reasoned that a pair feeding strategy will show the intrinsic differences in metabolic rate between these mice. A key finding is that pair feeding of SlnOE mice leads to loss of body weight and depletion of fat depots compared with Sln−/− mice. This finding suggests that increasing the expression levels of SLN in both fast- and slow-twitch muscle can lead to a higher energy cost for muscle work because there was no difference in the physical activity level between groups. In addition, these studies were done under thermoneutrality to minimize the contribution from thermogenic mechanisms. Therefore, the higher energy expenditure seen here is mostly due to SLN-mediated energy expenditure.
We propose that a higher SLN to SERCA ratio can be energetically costly. The data from this study suggest that the ratio of SLN to SERCA is a key determinant of energy expenditure and that regulating SLN expression levels can be an important factor in regulating muscle metabolism. We found that SlnOE mice had higher oxygen consumption and consumed more calories. We also observed that SLN is important for a β-adrenergic-mediated increase in energy expenditure. On the basis of these data, we suggest that SLN is an important component of basal metabolic rate and increasing SLN levels can result in higher basal metabolic rate.
An important question we addressed here is the role of SLN in diet-induced thermogenesis. Our studies showed that SlnOE mice fed a HFD gained less weight and maintained a healthy metabolic profile in comparison with WT mice. This is an exciting finding that suggests that SLN can affect energy metabolism in muscle and, thereby, contribute to whole-body metabolism and energy balance. The detailed molecular mechanisms of how SLN regulates whole-body energy metabolism remains to be understood. In this study, for the first time, we show that increasing SLN level in muscle can increase energy cost, leading to less fat deposition. Second, we show that, only in SlnOE mice, mitochondrial biogenesis is higher in skeletal muscles but not in Sln−/− mice. In support of this, there was also an increase in the transcriptional regulators of mitochondrial biogenesis, PPARδ and PGC1α, suggesting that SLN is involved in programming fast-twitch muscle into an oxidative phenotype. This is further confirmed by our data showing higher oxygen consumption and lower RER, an indication of increased oxidative metabolism. Interestingly, a higher oxidative capacity of SlnOE muscle occurred without a change in skeletal muscle fiber type composition. These data suggest that increasing the SLN/SERCA ratio leads to increased uncoupling of SERCA from Ca2+ transport and sustenance of elevated cytosolic Ca2+, thereby activating Ca2+-dependent signaling pathways, e.g. calcineurin/NFAT, to mediate the transcription of genes especially involved in oxidative metabolism and mitochondrial biogenesis (29–35).
However, further work is necessary to completely establish the interplay between SLN, Ca2+ signaling, and transcriptional regulation of mitochondrial biogenesis. Here we propose a working model (Fig. 7) for SLN-mediated signaling in muscle. We suggest that increasing SLN activity could lead to enhanced futile cycling of the SERCA pump and increased ATP hydrolysis, thereby creating a chronic energy demand. At the same time, an increase in cytosolic Ca2+ (because of uncoupling of SERCA by SLN) could directly activate mitochondrial enzymes to increase oxidative phosphorylation and ATP synthesis (36–43). Moreover, uncoupling of SERCA activity, and, hence, an increase in cytosolic Ca2+, can trigger Ca2+-dependent signaling pathways, promoting mitochondrial biogenesis. Therefore, we propose that SLN/SERCA interaction plays a dual role. It creates an energy demand in muscle on one hand and, at the same time, activates Ca2+-dependent signaling to increase ATP production through increased mitochondrial biogenesis (Fig. 7).
FIGURE 7.
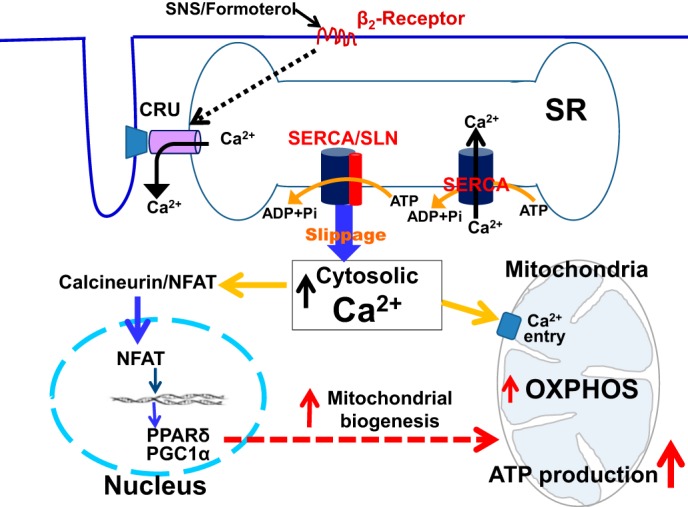
Proposed mechanism to show how SLN/SERCA interaction affects muscle metabolism. SERCA uses ATP hydrolysis to actively transport Ca2+ from the cytosol into the sarcoplasmic reticulum lumen. SLN binding to SERCA causes uncoupling of Ca2+ transport from ATP hydrolysis. This leads to futile cycling of the pump and increased ATP hydrolysis/heat production, thereby creating energy demand. At the same time, uncoupling of SERCA prolongs the cytosolic Ca2+ transient, thereby activating the mitochondrial oxidative metabolism and ATP synthesis (i) and Ca2+-dependent signaling pathways promoting mitochondrial biogenesis (ii). Therefore, SLN plays a dual role. It creates an energy demand and signals mitochondria to increase ATP production. The SLN-mediated increase in metabolism can also be recruited by SNS stimulation.
Collectively, our findings, for the first time, demonstrate that SLN in muscle is an important player in energy expenditure and whole-body metabolism. These findings have broad implications for understanding how muscle can be tapped to increase energy expenditure. Unlike other organs, striated muscle constitutes ∼40% of the total body mass and is the major consumer of fuels (4, 5, 44). Moreover, cardiac and skeletal muscle together can consume more than 80% of total body fuel (glucose and fatty acids) during acute physiological demand. Therefore, mechanisms that increase energy expenditure in muscle can be a powerful approach to control obesity. Although exercise is known as the best mechanism to increase energy expenditure, studies suggest that skeletal muscle can also be activated through other means to increase energy expenditure. Unlike in rodents, SLN is highly abundant in adult human skeletal muscle (45), and mutations in the chromosomal locus containing SLN are associated with obesity (46). On the basis of these observations and the data presented here, we propose that manipulating the SLN level/activity in skeletal muscle can be an attractive strategy to increase energy expenditure in muscle in addition to exercise.
Acknowledgments
We thank Drs. Sanjeewa A. Goonasekera and Jeffery D. Molkentin for skeletal muscle-specific sarcolipin overexpression mice (SlnOE). We also thank the Ohio State University's Comparative Pathology and Mouse Phenotyping Shared Resource for histology (supported in part by NCI/National Institutes of Health Grant P30 CA016058) and the histology core of Sanford-Burnham Medical Research, Orlando for SDH staining.
This work was supported, in whole or in part, by National Institutes of Health Grants R01-HL 088555 and R01 DK098240-01. This work was also supported by American Diabetes Association Basic Science Research Award 7-13-BS-131.
- SLN
- sarcolipin
- SERCA
- sarcoplasmic reticulum Ca2+ ATPase
- HFD
- high-fat diet
- SDH
- succinate dehydrogenase
- TA
- tibialis anterior
- VO2
- oxygen consumption
- VCO2
- CO2 production
- RER
- respiratory exchange ratio
- WAT
- white adipose tissue
- PPAR
- peroxisome proliferator-activated receptor
- CamKII
- Ca2+/calmodulin-dependent protein kinase II
- NFAT
- nuclear factor of activate T-cells
- PGC1α
- PPAR γ coactivator 1α.
REFERENCES
- 1. Hurt R. T., Kulisek C., Buchanan L. A., McClave S. A. (2010) The obesity epidemic: challenges, health initiatives, and implications for gastroenterologists. Gastroenterol. Hepatol. 6, 780–792 [PMC free article] [PubMed] [Google Scholar]
- 2. Lowell B. B., Spiegelman B. M. (2000) Towards a molecular understanding of adaptive thermogenesis. Nature 404, 652–660 [DOI] [PubMed] [Google Scholar]
- 3. Wijers S. L., Saris W. H., van Marken Lichtenbelt W. D. (2009) Recent advances in adaptive thermogenesis: potential implications for the treatment of obesity. Obes. Rev. 10, 218–226 [DOI] [PubMed] [Google Scholar]
- 4. Weibel E. R., Hoppeler H. (2005) Exercise-induced maximal metabolic rate scales with muscle aerobic capacity. J. Exp. Biol. 208, 1635–1644 [DOI] [PubMed] [Google Scholar]
- 5. Engeli S., Birkenfeld A. L., Badin P. M., Bourlier V., Louche K., Viguerie N., Thalamas C., Montastier E., Larrouy D., Harant I., de Glisezinski I., Lieske S., Reinke J., Beckmann B., Langin D., Jordan J., Moro C. (2012) Natriuretic peptides enhance the oxidative capacity of human skeletal muscle. J. Clin. Invest. 122, 4675–4679 [DOI] [PMC free article] [PubMed] [Google Scholar]
- 6. van den Berg S. A., van Marken Lichtenbelt W., Willems van Dijk K., Schrauwen P. (2011) Skeletal muscle mitochondrial uncoupling, adaptive thermogenesis and energy expenditure. Curr. Opin. Clin. Nutr. Metab. Care 14, 243–249 [DOI] [PubMed] [Google Scholar]
- 7. Tseng Y. H., Cypess A. M., Kahn C. R. (2010) Cellular bioenergetics as a target for obesity therapy. Nat. Rev. Drug Discov. 9, 465–482 [DOI] [PMC free article] [PubMed] [Google Scholar]
- 8. Reis M., Farage M., de Meis L. (2002) Thermogenesis and energy expenditure: control of heat production by the Ca2+-ATPase of fast and slow muscle. Mol. Membr. Biol. 19, 301–310 [DOI] [PubMed] [Google Scholar]
- 9. Babu G. J., Bhupathy P., Timofeyev V., Petrashevskaya N. N., Reiser P. J., Chiamvimonvat N., Periasamy M. (2007) Ablation of sarcolipin enhances sarcoplasmic reticulum calcium transport and atrial contractility. Proc. Natl. Acad. Sci. U.S.A. 104, 17867–17872 [DOI] [PMC free article] [PubMed] [Google Scholar]
- 10. Mall S., Broadbridge R., Harrison S. L., Gore M. G., Lee A. G., East J. M. (2006) The presence of sarcolipin results in increased heat production by Ca2+-ATPase. J. Biol. Chem. 281, 36597–36602 [DOI] [PubMed] [Google Scholar]
- 11. Sahoo S. K., Shaikh S. A., Sopariwala D. H., Bal N. C., Periasamy M. (2013) Sarcolipin protein interaction with sarco(endo)plasmic reticulum Ca2+ ATPase (SERCA) is distinct from phospholamban protein, and only sarcolipin can promote uncoupling of the SERCA pump. J. Biol. Chem. 288, 6881–6889 [DOI] [PMC free article] [PubMed] [Google Scholar]
- 12. Bal N. C., Maurya S. K., Sopariwala D. H., Sahoo S. K., Gupta S. C., Shaikh S. A., Pant M., Rowland L. A., Bombardier E., Goonasekera S. A., Tupling A. R., Molkentin J. D., Periasamy M. (2012) Sarcolipin is a newly identified regulator of muscle-based thermogenesis in mammals. Nat. Med. 18, 1575–1579 [DOI] [PMC free article] [PubMed] [Google Scholar]
- 13. Brennan K. J., Hardeman E. C. (1993) Quantitative analysis of the human α-skeletal actin gene in transgenic mice. J. Biol. Chem. 268, 719–725 [PubMed] [Google Scholar]
- 14. Blanco C. E., Sieck G. C., Edgerton V. R. (1988) Quantitative histochemical determination of succinic dehydrogenase activity in skeletal muscle fibres. Histochem. J. 20, 230–243 [DOI] [PubMed] [Google Scholar]
- 15. Rao X., Zhong J., Xu X., Jordan B., Maurya S., Braunstein Z., Wang T. Y., Huang W., Aggarwal S., Periasamy M., Rajagopalan S., Mehta K., Sun Q. (2013) Exercise Protects against diet-induced insulin resistance through downregulation of protein kinase Cβ in mice. PLoS ONE 8, e81364. [DOI] [PMC free article] [PubMed] [Google Scholar]
- 16. Yang F., Zhang X., Maiseyeu A., Mihai G., Yasmeen R., DiSilvestro D., Maurya S. K., Periasamy M., Bergdall K. V., Duester G., Sen C. K., Roy S., Lee L. J., Rajagopalan S., Ziouzenkova O. (2012) The prolonged survival of fibroblasts with forced lipid catabolism in visceral fat following encapsulation in alginate-poly-l-lysine. Biomaterials 33, 5638–5649 [DOI] [PMC free article] [PubMed] [Google Scholar]
- 17. Tupling A. R., Bombardier E., Gupta S. C., Hussain D., Vigna C., Bloemberg D., Quadrilatero J., Trivieri M. G., Babu G. J., Backx P. H., Periasamy M., MacLennan D. H., Gramolini A. O. (2011) Enhanced Ca2+ transport and muscle relaxation in skeletal muscle from sarcolipin-null mice. Am. J. Physiol. Cell Physiol. 301, C841–C849 [DOI] [PMC free article] [PubMed] [Google Scholar]
- 18. Smith I. C., Bombardier E., Vigna C., Tupling A. R. (2013) ATP consumption by sarcoplasmic reticulum Ca2+ pumps accounts for 40–50% of resting metabolic rate in mouse fast and slow twitch skeletal muscle. PLoS ONE 8, e68924. [DOI] [PMC free article] [PubMed] [Google Scholar]
- 19. Wright D. C., Geiger P. C., Holloszy J. O., Han D. H. (2005) Contraction- and hypoxia-stimulated glucose transport is mediated by a Ca2+-dependent mechanism in slow-twitch rat soleus muscle. Am. J. Physiol. Endocrinol. Metab. 288, E1062–E1066 [DOI] [PubMed] [Google Scholar]
- 20. Kanzleiter T., Rath M., Penkov D., Puchkov D., Schulz N., Blasi F., Schürmann A. (2014) Pknox1/Prep1 regulates mitochondrial oxidative phosphorylation components in skeletal muscle. Mol. Cell Biol. 34, 290–298 [DOI] [PMC free article] [PubMed] [Google Scholar]
- 21. Gerhart-Hines Z., Dominy J. E., Jr., Blättler S. M., Jedrychowski M. P., Banks A. S., Lim J. H., Chim H., Gygi S. P., Puigserver P. (2011) The cAMP/PKA pathway rapidly activates SIRT1 to promote fatty acid oxidation independently of changes in NAD+. Mol. Cell 44, 851–863 [DOI] [PMC free article] [PubMed] [Google Scholar]
- 22. Zechner C., Lai L., Zechner J. F., Geng T., Yan Z., Rumsey J. W., Collia D., Chen Z., Wozniak D. F., Leone T. C., Kelly D. P. (2010) Total skeletal muscle PGC-1 deficiency uncouples mitochondrial derangements from fiber type determination and insulin sensitivity. Cell Metab. 12, 633–642 [DOI] [PMC free article] [PubMed] [Google Scholar]
- 23. Wu Z., Puigserver P., Andersson U., Zhang C., Adelmant G., Mootha V., Troy A., Cinti S., Lowell B., Scarpulla R. C., Spiegelman B. M. (1999) Mechanisms controlling mitochondrial biogenesis and respiration through the thermogenic coactivator PGC-1. Cell 98, 115–124 [DOI] [PubMed] [Google Scholar]
- 24. Wende A. R., Schaeffer P. J., Parker G. J., Zechner C., Han D. H., Chen M. M., Hancock C. R., Lehman J. J., Huss J. M., McClain D. A., Holloszy J. O., Kelly D. P. (2007) A role for the transcriptional coactivator PGC-1α in muscle refueling. J. Biol. Chem. 282, 36642–36651 [DOI] [PubMed] [Google Scholar]
- 25. Lai L., Wang M., Martin O. J., Leone T. C., Vega R. B., Han X., Kelly D. P. (2014) A role for peroxisome proliferator-activated receptor γ coactivator 1 (PGC-1) in the regulation of cardiac mitochondrial phospholipid biosynthesis. J. Biol. Chem. 289, 2250–2259 [DOI] [PMC free article] [PubMed] [Google Scholar]
- 26. Narkar V. A., Downes M., Yu R. T., Embler E., Wang Y. X., Banayo E., Mihaylova M. M., Nelson M. C., Zou Y., Juguilon H., Kang H., Shaw R. J., Evans R. M. (2008) AMPK and PPARδ agonists are exercise mimetics. Cell 134, 405–415 [DOI] [PMC free article] [PubMed] [Google Scholar]
- 27. Gan Z., Rumsey J., Hazen B. C., Lai L., Leone T. C., Vega R. B., Xie H., Conley K. E., Auwerx J., Smith S. R., Olson E. N., Kralli A., Kelly D. P. (2013) Nuclear receptor/microRNA circuitry links muscle fiber type to energy metabolism. J. Clin. Invest. 123, 2564–2575 [DOI] [PMC free article] [PubMed] [Google Scholar]
- 28. Lee P., Day R. O., Greenfield J. R., Ho K. K. (2013) Formoterol, a highly β2-selective agonist, increases energy expenditure and fat utilisation in men. Int. J. Obes. 37, 593–597 [DOI] [PubMed] [Google Scholar]
- 29. Chin E. R., Olson E. N., Richardson J. A., Yang Q., Humphries C., Shelton J. M., Wu H., Zhu W., Bassel-Duby R., Williams R. S. (1998) A calcineurin-dependent transcriptional pathway controls skeletal muscle fiber type. Genes Dev. 12, 2499–2509 [DOI] [PMC free article] [PubMed] [Google Scholar]
- 30. Mercier J., Perez-Martin A., Bigard X., Ventura R. (1999) Muscle plasticity and metabolism: effects of exercise and chronic diseases. Mol. Aspects Med. 20, 319–373 [DOI] [PubMed] [Google Scholar]
- 31. Alevizopoulos A., Dusserre Y., Rüegg U., Mermod N. (1997) Regulation of the transforming growth factor β-responsive transcription factor CTF-1 by calcineurin and calcium/calmodulin-dependent protein kinase IV. J. Biol. Chem. 272, 23597–23605 [DOI] [PubMed] [Google Scholar]
- 32. Hughes S. M., Chi M. M., Lowry O. H., Gundersen K. (1999) Myogenin induces a shift of enzyme activity from glycolytic to oxidative metabolism in muscles of transgenic mice. J. Cell Biol. 145, 633–642 [DOI] [PMC free article] [PubMed] [Google Scholar]
- 33. Handschin C., Rhee J., Lin J., Tarr P. T., Spiegelman B. M. (2003) An autoregulatory loop controls peroxisome proliferator-activated receptor γ coactivator 1α expression in muscle. Proc. Natl. Acad. Sci. U.S.A. 100, 7111–7116 [DOI] [PMC free article] [PubMed] [Google Scholar]
- 34. Ryder J. W., Bassel-Duby R., Olson E. N., Zierath J. R. (2003) Skeletal muscle reprogramming by activation of calcineurin improves insulin action on metabolic pathways. J. Biol. Chem. 278, 44298–44304 [DOI] [PubMed] [Google Scholar]
- 35. Schaeffer P. J., Wende A. R., Magee C. J., Neilson J. R., Leone T. C., Chen F., Kelly D. P. (2004) Calcineurin and calcium/calmodulin-dependent protein kinase activate distinct metabolic gene regulatory programs in cardiac muscle. J. Biol. Chem. 279, 39593–39603 [DOI] [PubMed] [Google Scholar]
- 36. MacDonald M. J., Brown L. J. (1996) Calcium activation of mitochondrial glycerol phosphate dehydrogenase restudied. Arch. Biochem. Biophys. 326, 79–84 [DOI] [PubMed] [Google Scholar]
- 37. Hopper R. K., Carroll S., Aponte A. M., Johnson D. T., French S., Shen R. F., Witzmann F. A., Harris R. A., Balaban R. S. (2006) Mitochondrial matrix phosphoproteome: effect of extra mitochondrial calcium. Biochemistry 45, 2524–2536 [DOI] [PMC free article] [PubMed] [Google Scholar]
- 38. Hubbard M. J., McHugh N. J. (1996) Mitochondrial ATP synthase F1-β-subunit is a calcium-binding protein. FEBS Lett. 391, 323–329 [DOI] [PubMed] [Google Scholar]
- 39. Boerries M., Most P., Gledhill J. R., Walker J. E., Katus H. A., Koch W. J., Aebi U., Schoenenberger C. A. (2007) Ca2+ -dependent interaction of S100A1 with F1-ATPase leads to an increased ATP content in cardiomyocytes. Mol. Cell Biol. 27, 4365–4373 [DOI] [PMC free article] [PubMed] [Google Scholar]
- 40. McCormack J. G., Denton R. M. (1990) The role of mitochondrial Ca2+ transport and matrix Ca2+ in signal transduction in mammalian tissues. Biochim. Biophys. Acta. 1018, 287–291 [DOI] [PubMed] [Google Scholar]
- 41. Robb-Gaspers L. D., Burnett P., Rutter G. A., Denton R. M., Rizzuto R., Thomas A. P. (1998) Integrating cytosolic calcium signals into mitochondrial metabolic responses. EMBO J. 17, 4987–5000 [DOI] [PMC free article] [PubMed] [Google Scholar]
- 42. Jouaville L. S., Pinton P., Bastianutto C., Rutter G. A., Rizzuto R. (1999) Regulation of mitochondrial ATP synthesis by calcium: evidence for a long-term metabolic priming. Proc. Natl. Acad. Sci. U.S.A. 96, 13807–13812 [DOI] [PMC free article] [PubMed] [Google Scholar]
- 43. Tarasov A. I., Griffiths E. J., Rutter G. A. (2012) Regulation of ATP production by mitochondrial Ca2+. Cell Calcium 52, 28–35 [DOI] [PMC free article] [PubMed] [Google Scholar]
- 44. Rolfe D. F., Brown G. C. (1997) Cellular energy utilization and molecular origin of standard metabolic rate in mammals. Physiol. Rev. 77, 731–758 [DOI] [PubMed] [Google Scholar]
- 45. Fajardo V. A., Bombardier E., Vigna C., Devji T., Bloemberg D., Gamu D., Gramolini A. O., Quadrilatero J., Tupling A. R. (2013) Co-expression of SERCA isoforms, phospholamban and sarcolipin in human skeletal muscle fibers. PLoS ONE 8, e84304. [DOI] [PMC free article] [PubMed] [Google Scholar]
- 46. Bochukova E. G., Huang N., Keogh J., Henning E., Purmann C., Blaszczyk K., Saeed S., Hamilton-Shield J., Clayton-Smith J., O'Rahilly S., Hurles M. E., Farooqi I. S. (2010) Large, rare chromosomal deletions associated with severe early-onset obesity. Nature 463, 666–670 [DOI] [PMC free article] [PubMed] [Google Scholar]