

Background: Astrocytes contain glycogen, an energy buffer in the brain.
Results: Stimulation with insulin and IGF-1 decreases cytosolic glucose concentration in astrocytes without affecting glucose entry across the astrocyte plasma membrane.
Conclusion: Insulin and IGF-1 boost the process of glycogen formation.
Significance: This is the first high temporal resolution measurement of the decrease of glucose levels in astrocytes resulting from insulin and IGF-1 stimulation.
Keywords: Astrocyte, Fluorescence Resonance Energy Transfer (FRET), Glucose Metabolism, Glycogen, Insulin, Insulin-like Growth Factor (IGF)
Abstract
Astrocytes contain glycogen, an energy buffer, which can bridge local short term energy requirements in the brain. Glycogen levels reflect a dynamic equilibrium between glycogen synthesis and glycogenolysis. Many factors that include hormones and neuropeptides, such as insulin and insulin-like growth factor 1 (IGF-1) likely modulate glycogen stores in astrocytes, but detailed mechanisms at the cellular level are sparse. We used a glucose nanosensor based on Förster resonance energy transfer to monitor cytosolic glucose concentration with high temporal resolution and a cytochemical approach to determine glycogen stores in single cells. The results show that after glucose depletion, glycogen stores are replenished. Insulin and IGF-1 boost the process of glycogen formation. Although astrocytes appear to express glucose transporter GLUT4, glucose entry across the astrocyte plasma membrane is not affected by insulin. Stimulation of cells with insulin and IGF-1 decreased cytosolic glucose concentration, likely because of elevated glucose utilization for glycogen synthesis.
Introduction
Electrical activity in the CNS demands an efficient energy supply. Most of the energy consumed in the brain is attributable to restoration of the membrane resting potential after neuronal depolarization, which is accomplished by Na+/K+-ATPase (1). Astrocytes form an intimately connected network with neurons and with endothelial cells, where the end feet form well defined rosette-like structures, adjacent to the vessel wall (2). This acts as a conduit for glucose and other molecules for neuronal metabolism (3, 4). Astrocytes are a site of prevalent glucose uptake (5), as well as lactate formation and release (6, 7). It is thought that lactate is taken up by neurons and used as a fuel for aerobic generation of energy (8). However, the significance of lactate shuttling from astrocytes toward neurons in vivo is still controversial (9, 10).
Glycogen in the brain is localized almost exclusively in astrocytes (11, 12). Even though the glycogen content in astrocytes is relatively low compared with that in the liver and skeletal muscle, it is of great importance for neuronal function (13). There is compelling evidence that glycogen utilization can sustain neuronal activity during hypoglycemia and during periods of high neuronal activity (13–15). The utilization of astrocyte glycogen is accelerated both by a lack of energy substrate (16) and an increase in neuronal activity (17, 18). For example, sleep deprivation was shown to deplete glycogen content (19). Glycogen is seen as a short term energy buffer to bridge an increased demand for brain energy rather than an energy reserve for sustained expenditure (20). It has also been suggested that a large fraction of available glucose is temporarily converted to glycogen and subsequently released in a pathway known as the glycogen shunt (21). Glycogen levels reflect a dynamic equilibrium between glycogen synthesis and degradation, i.e. glycogenolysis (22).
The content of glycogen in astrocytes is modulated by a number of factors including hormones (23, 24). Insulin receptors are widely distributed throughout the CNS (25) and are also found in astrocytes (26, 27). It is thought that little or no insulin is produced in the brain (28, 29); however, insulin can enter the brain via circumventricular regions that lack a tight blood-brain barrier (30) or via a receptor-mediated active transport system (31–35). There is increasing evidence that insulin receptor signaling is required for neuron survival (36) and the regulation of food intake (37–39) and that it affects cognition and memory (40–43). It is assumed that insulin deficiency contributes to the neurological and psychiatric complications of diabetes (44–46). In addition, defects in insulin action in the CNS may be linked to the pathogenesis of neurodegenerative disorders such as Alzheimer disease (47) and Parkinson disease (48). In patients with Alzheimer disease, insulin levels are higher in plasma and lower in cerebrospinal fluid compared with control subjects (49, 50).
Insulin-like growth factor 1 (IGF-1)3 is closely related in primary sequence and biological activity to insulin, and receptors of both molecules are known to have a joint PI3K/Akt pathway (27, 51). IGF-1 crosses the blood-brain barrier (52), and IGF-1 receptors are expressed by both astrocytes and neurons (53). There is a certain degree of cross-talk between insulin, IGF-1, and their receptors (51). Insulin/IGF-1 pathways may have a role in the regulation of longevity (54), and dysfunction of these pathways may contribute to the progressive loss of neurons in Alzheimer disease and Parkinson disease (55).
In cultures of rodent astrocytes, increased levels of insulin resulted in increased cell growth (56). Furthermore, the application of insulin or IGF-1 to astrocyte cultures was shown to stimulate the formation of glycogen (15, 56–58). However, the mechanism by which insulin and IGF-1 modulate glycogen stores in astrocytes is still poorly understood, and it is only speculated that insulin stimulation regulates glucose uptake into astrocytes (23, 58). The uptake may involve glucose transporter GLUT4, the expression of which in astrocytes was recently confirmed with immunocytochemical staining (59). In the present study, we have addressed this question using a glucose nanosensor based on FRET, which allows high temporal resolution measurement of the dynamic glucose concentration in single cells (60).
EXPERIMENTAL PROCEDURES
Cell Culture and Plasmid Transfection
Cultures were prepared from the cortex of 2-day-old rats as described previously (61). The cells were subcultured onto 22-mm diameter poly-l-lysine-coated glass coverslips and grown in 25 mm d-glucose Dulbecco's Eagle's medium, containing 10% fetal bovine serum, 1 mm pyruvate, 2 mm glutamine, and 25 μg/ml penicillin/streptomycin in 95% air, 5% CO2. After 1–3 days, the cells were transfected with FRET-based glucose nanosensor FLII12GLU-700μΔ6 (Addgene 17866) (62) at a concentration of 1 μg/ml using FuGENE 6 lipofection medium according to the manufacturer's instructions (Promega, Madison, WI). Ultroser G (3%; Pall Biosepra, Cergy-Saint-Christophe, France) was added to the lipofection medium 3 h after transfection. Glucose nanosensor FLII12GLU-700μΔ6 consists of two fluorophores, cyan fluorescence protein (CFP) and YFP, fused to the N and C termini of glucose/galactose-binding protein. Glucose binding to glucose/galactose-binding protein causes a conformational change in the nanosensor, and consequently fluorophores move closer increasing FRET efficacy, which results in the YFP/CFP (FRET) ratio increase. Upon expression, the glucose nanosensor was uniformly distributed in the cytosol of astrocytes.
Extracellular Solutions
The extracellular solutions contained 131.8 mm NaCl, 5 mm KCl, 10 mm HEPES, 2 mm MgCl2 (Kemika, Zagreb, Croatia), 1.8 mm CaCl2 (Riedel De Haen AG, Seeleze, Hannover, Germany), 0.5 mm NaH2PO4, 5 mm NaHCO3, with pH adjusted to 7.2 with NaOH (63). d-Glucose was added to this solution to achieve a concentration of 3 mm. Extracellular solutions with 0 and 10 mm d-glucose were prepared by adjusting the concentration of NaCl to sustain the desired osmolarity. Unless otherwise stated, all chemicals were obtained from Sigma-Aldrich. Extracellular solution osmolarity was between 295 and 305 mOsm, measured with Osmomat 030 (Gonotech, Berlin, Germany).
Acquisition of the FRET Signal
Imaging was performed 1–2 days after transfection on a fluorescence microscope (Zeiss Axiovert 135; Zeiss, Oberkochen, Germany), equipped with a water immersion objective (C-Apochromat 63×/1.2 NA), with a CCD camera and a Polychrome IV monochromator (Till Photonocs, Graefelfing, Germany) for the generation of a light source with a wavelength 436 nm. Dual emission intensity ratios were recorded using an image splitter (Optical Insights, Tuscon, AZ). The image was passed through a dichroic mirror (505 nm) to produce two wavelength-separated images, and each image passed different emission filters (465/30 nm for ECFP and 535/30 nm for EYFP). The side by side image was projected to the camera image sensor. Images were acquired at intervals of 10 s, and exposure time was 0.7 s. Coverslips with transfected astrocytes were mounted in a superfusion recording chamber on the microscope stage. Imaging was performed at room temperature (22–24 °C). Only one cell was recorded in each experiment. Before the beginning of the experiments, 300 μl of the extracellular solution was applied to the cells. Insulin (1 μm) or IGF-1 (100 nm) was added to the cells by the superfusion system. In experiments with wortmannin, a selective PI3K inhibitor, cells were preincubated with 100 nm wortmannin for 15 min. In experiments with picropodophyllotoxin (PPP), an IGF-1 kinase inhibitor, cells were preincubated with 100 nm PPP for 1 h. Superfusion flow rates were 4–10 ml/min (Perfusion Valve Controller, model VC-8; Warner Instruments, Hamden, CT). The application method had no significant effect on the FRET ratio, as reported previously (63). In experiments with the addition of bolus solution, 300 μl of extracellular solution was added by pipette to 300 μl of bath solution in the recording chamber.
Data Analysis
The YFP/CFP (FRET) ratio was obtained by integration of the fluorescence signal ratio over the entire image of the cells using Till Vision software (Till Photonics, Graefelfing, Germany). The internal glucose concentration was calculated as described previously (63). The fall time was measured as the time for the ratio to decrease from 80% to 20% of the maximal value (see Fig. 3). Similarly, the rise time of the FRET ratio signal was measured as the time for the ratio to rise from 20% to 80% of the maximal value, using a custom-written Matlab (Matworks) routine.
FIGURE 3.

Insulin treatment does not affect the rate of glucose flux into astrocytes. a, intermittent superfusion of cells with extracellular solution containing the following d-glucose concentrations: 10 mm d-glucose for 3 min, 0 mm d-glucose for 5 min (gray line), and 10 mm d-glucose for 3 min in control untreated cells in and in cells treated with insulin (1 μm) during recordings. The time for the FRET ratio signal to rise or fall from 20% to 80% of the maximal change was determined (dashed lines), and the time interval between these two values was measured (separately for fall time20–80% and rise time20–80%). In addition, the rates of fall and rise of the FRET ratio signal were determined as indicated by linear regression line fitted to the fall of the FRET ratio signal (for details, see “Experimental Procedures”). b, fall and rise times of the FRET ratio signal in control cells without insulin (white bars, n = 10) and in insulin-treated cells (gray bars, n = 10). There was no significant difference in the fall or rise time between the two experimental settings (fall time20–80%, 24.3 ± 1.2 s (n = 10) versus 24.0 ± 1.9 s (n = 10), p = 0.91 and rise time20–80%, 16.6 ± 0.1 s (n = 10) versus 16.7 ± 1.0 s (n = 10), p = 0.92, respectively). Bars represent the means ± S.E. No differences in insulin-stimulated cells compared with control cells (fall rates were 0.16 ± 0.01 s−1 in control cells and 0.17 ± 0.02 s−1 in insulin-stimulated cells, p = 0.65; rise rates were 0.25 ± 0.01 s−1 in control cells and 0.24 ± 0.03 s−1 in insulin-stimulated cells, p = 0.69) were observed (not shown).
The amplitude (a) and the time constant (τ) were calculated in SigmaPlot software. The data were fitted to the following equation: FRET ratio = y0 + a(1 − exp(−t/τ)), where y0 is the initial value of the FRET ratio. The fall and rise rates in the FRET ratio signal were determined from the slope of the straight line manually fitted to the curve (see Fig. 3). The figures were assembled for display using Adobe Photoshop and Corel Draw software. The data are expressed as means ± S.E. The normality of the data distribution was tested using the Shapiro-Wilk test. The Student's paired or unpaired two-tailed test was used to compare two samples or two data points of the same sample. Differences between two samples were tested by the Student's t test. Differences between three or more samples were tested by the Kruskal-Wallis one-way analysis of variance on ranks, as indicated, and tested post hoc by the Dunn method when appropriate.
Periodic Acid-Schiff Staining
Cytosolic localization of glycogen was performed using the periodic acid-Schiff (PAS) method (64). Cells were subcultured onto 22-mm diameter poly-l-lysine-coated coverslips 1 day before the experiment. After the different treatments (2 h of glucose deprivation; 2 h of glucose deprivation + 2 h of recovery; and 2 h of glucose deprivation + 2 h of recovery with added insulin (100 nm) or IGF-1 (10 nm)), cells were washed with ice-cold PBS and fixed for 5 min at room temperature with 3.7% paraformaldehyde in 90% ethanol and washed three times with 70% (v/v) ethanol. After incubation for 30 min at room temperature in 1% (w/v) periodic acid dissolved in 70% ethanol, the cells were washed three times with 70% ethanol and stained for 60 min at room temperature in 0.5% (w/v) basic fuchsine dissolved in acid ethanol (ethanol/water/concentrated HCl, 80:19:1 v/v/v). After staining, the cells were rinsed three times with 70% ethanol, dehydrated in absolute ethanol, and mounted with Eukitt (Sigma).
Images were acquired with a Zeiss LSM 510 confocal microscope through a Plan Apochromat oil immersion objective (63×, NA = 1.4), excited by a 543-nm He/Ne laser line, and filtered with a 560-nm low pass emission filter. Images were taken systematically across the entire coverslip, and the entire cell on the sampled images was analyzed. Cells were analyzed quantitatively using LSM 510 imaging software (Zeiss). The mean fluorescence intensity of PAS staining per cell was determined by averaging all pixel fluorescence intensities in the region of interest, corresponding to the cell cross-sectional area. The data are given as means ± S.E. in percentage of maximal fluorescence.
Immunocytochemistry
To identify the expression of an insulin receptor (IR) and IGF-1 receptor (IGF1R) in rat astrocytes, double immunostaining was performed using the primary rabbit anti-IR antibody (ab175251; Abcam), primary rabbit anti-IGF1R (ab131476; Abcam), primary mouse anti-glial fibrillary acidic protein, secondary goat anti-rabbit antibody conjugated to fluorescent dye Alexa Fluor 546 (Molecular Probes, Invitrogen), and secondary goat anti-mouse antibody conjugated to fluorescent dye Alexa Fluor 488 (Molecular Probes).
Cells were washed with PBS and fixed in 4% paraformaldehyde in PBS for 15 min and 0.1% Triton X-100 for 10 min at room temperature. Nonspecific staining was reduced by incubating cells in blocking buffer containing 3% BSA and 10% goat serum in PBS at 37 °C for 1 h. The cells were incubated sequentially with primary antibody anti-glial fibrillary acidic protein (diluted 1:100) in 3% BSA in PBS at 37 °C for 2 h. The cells were then rinsed with PBS and incubated with anti-IR or anti-IGF1R antibody in 3% BSA in PBS at 37 °C for 2 h. Next the cells were washed with PBS and stained with two secondary antibodies, conjugated to Alexa Fluor 546 and Alexa Fluor 488 (both diluted 1:600), in 3% BSA in PBS at 37 °C for 45 min. Control cells were incubated with secondary antibodies alone. After washing, they were mounted on glass slides using the Light Antifade kit (Invitrogen). Images of immunolabeled cells were acquired using a LSM 510 confocal microscope (Zeiss) equipped with a Plan Apochromat oil immersion objective (63×, NA = 1.4), excited by the 543-nm helium/neon laser line, filtered with the 560-nm low pass emission filter and a 488-nm argon laser line, and filtered with a 505–530-nm band pass emission filter. All experiments were performed at room temperature.
RESULTS
To study the dynamics of cytosolic glucose levels in astrocytes in response to the application of insulin or IGF-1, we transfected astrocytes with the plasmid-encoding FRET-based glucose nanosensor (63) and used a CCD camera in combination with an image splitter to simultaneously record CFP and YFP emission images (Fig. 1). The cells were initially bathed in the extracellular solution containing 10 mm d-glucose and then superfused with the extracellular solution without d-glucose. Omitting d-glucose from the extracellular solution resulted in the decrease in the YFP/CFP (FRET) ratio, indicating a decrease in the cytosolic glucose concentration. The exchange of glucose-free external solution with 10 mm d-glucose solution resulted in an increase in the FRET ratio, indicating glucose entry into the cell via glucose transporters (GLUTs) within 1 min (Fig. 1). Thus glucose nanosensor is functionally expressed in astrocytes, consistent with previous reports (63).
FIGURE 1.

Functional expression of FRET-based glucose nanosensor FLII12GLU-700μΔ6 in a cultured astrocyte. a, CFP and YFP emission images show the expression of the FLII12GLU-700μΔ6 fluorescent nanosensor in an astrocyte. The upper panels show an astrocyte in the medium containing 10 mm d-glucose; the lower panels show the same cell after superfusion with 0 mm d-glucose. Scale bar, 10 μm. b, integration of the ratio over the entire cell was used to quantify the change in the ratio. Superfusion of cells initially bathed in high glucose solution (10 mm) with the solution containing 0 mm glucose (gray lines) induced an increase in the CFP fluorescence intensity (left panel) and a decrease in the YFP intensity (middle panel), thus decreasing the YFP/CFP ratio (right panel) and indicating a decrease in the cytosolic glucose levels. Subsequent superfusion with 10 mm d-glucose induced an increase in the FRET ratio, indicating an increase of intracellular d-glucose caused by glucose entry into the cell. fluo, fluorescence; a.u., arbitrary units.
Cytosolic Glucose Level in Astrocytes Is Decreased by Insulin
We used immunocytochemical labeling of IRs to demonstrate that astrocytes in culture express IRs, as already reported (26, 27) (Fig. 2, a–c). In control cells incubated with secondary antibodies alone, no detectable signal was observed. We next tested whether the addition of extracellular insulin affects the dynamics of cytosolic glucose in astrocytes. Astrocytes were superfused for 300 s with insulin in extracellular solution containing 3 mm d-glucose (Fig. 2, d–f). In 48% of recordings (10 of 21 cells), application of insulin resulted in a significant decrease in the FRET ratio, which indicates a decrease in cytosolic glucose concentration (63). Two types of responses to 1 μm insulin stimuli were observed. In the first type of responses (Fig. 2d; 7 of 21 cells), the decrease in cytosolic glucose concentration was persistent and continued beyond the removal of insulin from the extracellular solution. In these experiments, a ∼1% decline (-0.014 ± 0.003) in the FRET ratio was observed, which corresponds to the 6% decrease in the intracellular d-glucose concentration (Fig. 2d). In the second type of responses (Fig. 2e, 3 of 21 cells), astrocytes responded to insulin stimulation with an initial transient decrease followed by an increase in the glucose levels. Of 21 cells, 11 were unresponsive. When cells were exposed to 100 nm insulin (n = 16 cells), no FRET response was observed, indicating no change in the intracellular glucose levels (not shown). Similarly, in control experiments in which either cells were superfused with extracellular solution (Fig. 2f, n = 11) or extracellular solution was added acutely as a bolus (n = 25 cells; not shown), no significant change in the FRET ratio was observed.
FIGURE 2.

Activation of insulin receptors decreases glucose levels in cultured astrocytes. a–c, astrocytes immunolabeled with antibodies against insulin receptors (a, red), against astrocytic marker glial fibrillary acidic protein (b, green), and overlay of the signals (c). Scale bar, 20 μm. d–f, representative (upper panels) and mean (lower panels) time-dependent changes in the YFP/CFP (FRET) ratio signal upon insulin or vehicle stimulation. Insulin stimulation decreases the FRET ratio signal, reflecting the decrease in cytosolic concentration of glucose. Two types of responses to insulin treatments (1 μm, black bars) were observed: persistent (d, filled circles; n = 7 cells) and transient (e, filled circles; n = 3 cells). The time constant of the decrease in the FRET ratio after insulin stimulation for persistent events was 28.2 ± 5.7 s, and the average amplitude was −0.014 ± 0.003 (n = 7, paired Student's t test, p = 0.001). The amplitude of the decrease in the FRET ratio for transient events 90 s after the addition of insulin was 0.5% (paired Student's t test, p = 0.05) (d, white circles). Astrocytes pretreated with wortmannin (100 nm) for 15 min were exposed to the same experimental conditions as nonpretreated cells. The mean change in the FRET ratio from 330 to 490 s on insulin stimulation was significantly lower in cells pretreated with wortmannin (n = 23 cells) compared with nonpretreated cells (p = 0.05). f, cells superfused with vehicle extracellular solution (control) showed no significant change in the FRET ratio (n = 11 cells). Student's t test for paired data: *, p = 0.05; **, p = 0.01; ***, p = 0.001. conc., concentration; Int., internal; Rel., relative.
To inhibit the insulin signaling pathway (27), cells were preincubated with wortmannin, a PI3K inhibitor (65). After stimulation with insulin (1 μm), cells pretreated with wortmannin (100 nm) displayed a significantly smaller change in the FRET ratio (Fig. 2d, open circles) compared with nonpretreated cells with a persistent glucose response. Acute addition of wortmannin did not affect the cytosolic glucose concentration (n = 7 cells; not shown). These results indicate that the observed decrease in glucose levels in isolated astrocytes is insulin-dependent.
Glucose Flux across the Plasma Membrane of Astrocytes Is Not Affected by Insulin
We examined whether insulin affects the dynamics of glucose entry, which could be mediated via insulin-sensitive glucose transporters. To estimate the influence of insulin on glucose entry in astrocytes, at different intervals, we superfused cells with extracellular solution containing either a high or zero concentration of d-glucose: 10 mm d-glucose for 3 min, 0 mm d-glucose for 5 min, and 10 mm d-glucose for 3 min. In a separate set of experiments, insulin (1 μm) was included in all solutions during the recordings. To determine the potential differences in glucose entry (transport across the plasma membrane) between control untreated and insulin-stimulated cells, the rise times20–80% (glucose entry) and fall times20–80% (glucose utilization) of the maximal FRET ratio changes, reflecting dynamic changes in cytosolic glucose levels, were determined for both experiment settings and compared. The measurements revealed that the rise time20–80% and the fall time20–80% of the FRET ratio signals were not significantly different between control untreated cells and insulin-stimulated cells (Fig. 3), indicating that the glucose entry and utilization are not affected by insulin. The rise and fall times measured were not limited by the temporal resolution of the superfusion system (63).
We further tested whether the rates of the FRET ratio changes, i.e. rise rates (glucose entry) and fall rates (glucose utilization), differ in insulin-stimulated cells compared with control untreated cells. We did not observe any significant differences in the rates of FRET ratio changes between insulin-stimulated and control cells (Fig. 3). Similarly, we found no changes in the amplitudes of FRET signal increases or decreases (p = 0.63 and p = 0.67, respectively). Although astrocytes in culture were shown to express GLUT4 (59), an insulin-sensitive glucose transporter in fat and muscle cells, these results clearly indicate that in astrocytes glucose membrane flux is not affected by insulin treatment.
Cytosolic Glucose Level in Astrocytes Is Decreased by IGF-1 Stimulation
We next tested whether the addition of extracellular IGF-1 also affects the dynamics of cytosolic glucose in astrocytes (Fig. 4). We performed immunocytochemical IGF1R labeling to confirm that the primary culture of astrocytes expresses IGF1R (Fig. 4, a–c). In cells incubated with secondary antibodies alone, no detectable signal was observed.
FIGURE 4.

Activation of IGF-1 receptors decreases glucose levels in cultured astrocytes. a–c, astrocytes immunolabeled with antibodies against IGF-1 receptors (a, red), astrocytic marker glial fibrillary acidic protein (b, green), and overlay of both signals (c). Scale bar, 20 μm. d and e, representative (upper panel) and mean (lower panel) time-dependent changes of the YFP/CFP (FRET) ratio signal upon IGF-1 or vehicle stimulation. IGF-1 stimulation (100 nm, black line) decreases the cytosolic glucose concentration in astrocytes (filled circles). Cells pretreated with 100 nm PPP (open circles), an IGF-1 receptor kinase inhibitor, were exposed to the same experimental conditions as nonpretreated cells. The mean change in the FRET ratio recorded on IGF-1 stimulation in PPP-pretreated cells was significantly lower (n = 20 cells) than in nonpretreated cells (n = 13 cells; p = 0.00017 at 600 s and p = 0.0014 at 900 s; Student's t test). e, cells superfused with vehicle extracellular solution (control) showed no significant change in the FRET ratio (n = 15 cells). Student's t test for paired data: *, p = 0.05; **, p = 0.01; ***, p = 0.001. conc., concentration; Int., internal; Rel., relative.
An application of IGF-1 (100 nm) to astrocytes resulted in a significant decrease in the FRET ratio (Fig. 4, d and e), which indicates a decrease in the cytosolic glucose concentration (63). Of a total of 26 astrocytes recorded, 13 (50%) showed a ∼2% decrease in the mean FRET ratio (−0.022 ± 0.004) 300 s after the addition of IGF-1, which corresponds to a 9% decrease in the intracellular concentration of d-glucose. The decrease was statistically different from the initial FRET ratio level (Fig. 4d, filled circles). The FRET ratio then further decreased to 3% after 600 s (cinternal at 900 s = 0.29 ± 0.01 mm). Cells pretreated with PPP (Fig. 4d, open circles), an IGF-1 kinase inhibitor (66), displayed a smaller decrease in intracellular glucose concentration on IGF-1 stimulation compared with nonpretreated cells (p < 0.001 at 600 s and p < 0.01 at 900 s, Student's t test cinternal at 900 s = 0.32 ± 0.01 mm), indicating that the observed decrease in glucose levels was IGF-1-dependent (Fig. 4). Of 26 cells, 13 were unresponsive.
In control experiments where extracellular solution was added acutely as a bolus to nonpretreated (Fig. 4e) and PPP-pretreated cells (not shown), no significant change in the FRET ratio was observed (n = 15 and n = 20 cells, respectively). Moreover, acute addition of PPP did not affect the cytosolic glucose concentration (n = 6 cells; not shown).
Insulin and IGF-1 Augment Glycogen Stores in Astrocytes
We next examined whether the intracellular glycogen content in astrocytes depends on insulin and IGF-1 treatment. PAS staining and confocal microscopy were performed to visualize and analyze the glycogen content in astrocytes exposed to glucose-free and glucose-rich extracellular solution with insulin or IGF-1 stimulation (Fig. 5a). We found that the glycogen content was significantly lower in astrocytes exposed to glucose deprivation for 2 h compared with astrocytes that were first exposed to glucose deprivation for 2 h and then to refeeding for 2 h in DMEM containing 5.55 mm glucose (Fig. 5b; p < 0.05). Both insulin and IGF-1 further augmented the glycogen levels, as indicated by the PAS staining ∼1.4-fold increase (p < 0.001) when the cells were stimulated with insulin or IGF-1 during glucose deprivation and refeeding compared with unstimulated cells. We found that insulin and IGF-1 have similar effects on the replenishing of glycogen stores in astrocytes (Fig. 5b; p = 0.15).
FIGURE 5.
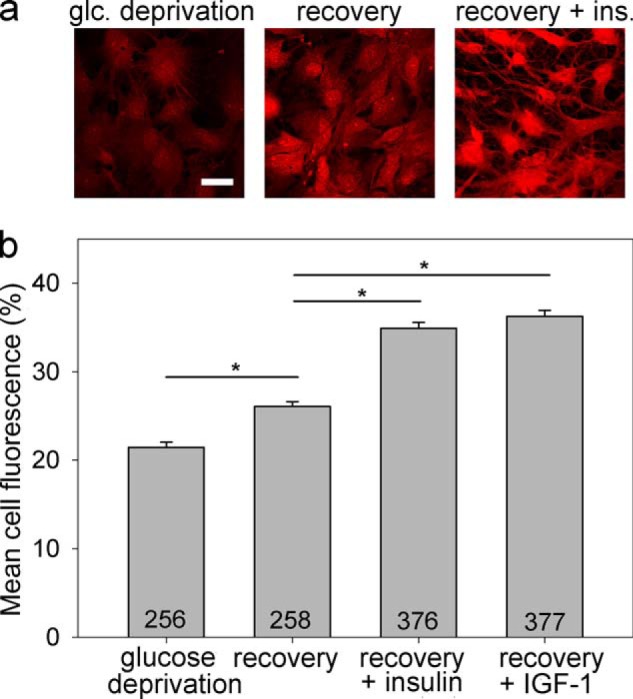
Glycogen content in astrocytes is insulin- and IGF-1-dependent. Glycogen content was determined by PAS staining. Representative images of cells positively stained with PAS (red fluorescence) after exposure to glucose-free extracellular solution for 2 h (a, left panel), glucose deprivation for 2 h, and then refeeding in 5.55 mm glucose-rich solution for 2 h (a, middle panel), and on exposure to the same experimental procedure as in the middle panel with the addition of insulin (a, right panel). The intensity of PAS staining is related to the glycogen content in the cell. Scale bar, 20 μm. b, mean fluorescence intensity of PAS staining per cell area (% of mean red fluorescence intensity per cell area over a maximal fluorescence intensity of 255 arbitrary units). Experiments were performed in cells exposed for 2 h to glucose-free extracellular solution (glucose deprivation; PAS staining: 21.4 ± 0.6% (n = 256)) after initially being exposed to glucose deprivation and then to 2 h of refeeding in the glucose-rich solution (recovery; DMEM with 5.55 mm glucose; PAS staining: 26.1 ± 0.6%; (n = 258)) and also in cells treated with either insulin (recovery + insulin; 100 nm; PAS staining: 34.9 ± 0.6% (n = 376)) or IGF-1 (recovery + IGF-1; 10 nm; PAS staining: 36.3 ± 0.7% (n = 377)) during glucose deprivation and refeeding. The numbers denote the number of cells analyzed. *, p < 0.05 (differences were tested by Kruskal-Wallis analysis of variance on ranks, and post hoc by the Dunn method); three independent experiments were performed. glc, glucose; ins., insulin.
DISCUSSION
The role of insulin and IGF-1 in the CNS is poorly understood; however, it has been linked to the regulation of glucose uptake into astrocytes (23, 58). Here, we show directly that insulin and IGF-1 enhance glycogen levels in single isolated astrocytes, consistent with previous reports (15, 27, 57). Furthermore, we show that in astrocytes insulin and IGF-1 stimulation decrease the cytosolic glucose concentration, which likely reflects the increased use of glucose in glycogen synthesis.
Insulin and IGF-1 Increase Glycogen Content in Astrocytes Independently of Glucose Transport across the Plasma Membrane
In the present study, we show that insulin and IGF-1 affect the dynamics of glycogen stores in astrocytes by enhancing the accumulation of glycogen (57). The glycogen content in a cell depends on the intracellular levels of glucose, which in turn may also be dependent on the glucose transport across the plasma membrane via GLUTs. In fat and muscle cells, GLUT4, a unique insulin-sensitive glucose transporter, is translocated in the presence of insulin from the cell interior to the plasma membrane, enabling glucose entry (67). Astrocytes appear to express GLUT1 and GLUT3 at a high level but very little GLUT2 and GLUT4 (27). In vivo, in CNS GLUT4 has been shown to be expressed in the pituitary, the hypothalamus, the medulla (68), and the cerebellum (69) but not in the cortex. It has also been found in forebrain microvascular endothelium (70) and in vascular structures within the ventromedial hypothalamus, which suggests that GLUT4 may have a functional role in the blood-brain barrier (71). A recent study indicates that cultured astrocytes also express GLUT4 (59). Stimulation of astrocytes with insulin in an experiment in which we intermittently superfused cells with extracellular solution containing either high concentration of d-glucose or no glucose resulted in equal dynamics of the intracellular glucose changes compared with experiments where cells were not treated with insulin (Fig. 3). This provides functional evidence that insulin, although it increases intracellular glycogen content in astrocytes, does not affect glucose transport across the plasma membrane. This may be due to nontranslocation behavior of the GLUT4 transporter in astrocytes.
Insulin and IGF-1 Decrease Cytosolic Glucose Concentration in Astrocytes via Intracellular Signaling Pathways
It is known that insulin crosses the blood-brain barrier and may have multiple functions in the brain (72). The mechanism by which insulinoid stimulation leads to an increased level of glycogen has not been sufficiently elucidated (73). Both insulin and IGF-1 are known to have a mutual PI3K/Akt pathway (27, 51). PI3K/Akt phosphorylates and inactivates glycogen synthase kinase 3 (GSK-3), decreasing the rate of phosphorylation of glycogen synthase, thus increasing its activity (74). Glycogen synthase is universally distributed in the brain and is found in both neurons and astrocytes (75, 76), although higher levels were observed in astrocytes (75). On the other hand, glycogen phosphorylase is a key enzyme in glycogen degradation in astrocytes (77). Astrocytes express two isoforms of glycogen phosphorylase with distinct regulatory properties and are named after the respective organ of their main expression: the muscle isoform, MM, and the brain isoform, BB (11). Isoform MM is predominantly activated by phosphorylation, triggered by extracellular stimuli (11). Thus the MM isoform is primarily tailored to respond to extracellular control via signals triggering the phosphorylation cascade, whereas the BB isoform is mainly adapted to provide energy for internal needs (78).
We show that the availability of intracellular glucose after insulin or IGF-1 stimulation is decreased, which indicates that the stimulated glycogen synthesis exceeds glucose utilization in astrocytes (see Figs. 2 and 4). According to previous studies with radioisotopes, the maximum stimuli for forming glycogen is at 100 nm for insulin and 10 nm for IGF-1 (57). The maximum decrease in the cytosolic glucose concentration was 6% for insulin and 9% for IGF-1 after 300 s of stimulation. The kinetics of glucose concentration decay after IGF-1 was more sustained compared with the insulin stimulation, where the kinetics was faster at the beginning. This difference is characterized by significantly lower glucose level in cells 300 s after stimulation by IGF-1 (p = 0.022; Figs. 2, d and e, and 4d). After stimulation with insulin, we have observed persistent or transient intracellular glucose level changes, which are likely due to heterogeneity of astrocytes (79). In some cells tested, the insulin stimulation lastingly shifts the glucose equilibrium toward glucose utilization, whereas in other ones the glucose equilibrium was only transiently changed, returning to initial values within ∼150 s, likely because of increased glucose delivery. The inhibition of glycogen synthesis by preincubation of cells with wortmannin diminished the decrease in insulin-stimulated glucose levels (Fig. 2d). This is in agreement with the view that insulin signaling augments numerous cellular processes that utilize glucose as an energy source, which in turn results in a significant decrease in internal glucose concentration (80). In addition, GSK-3β is also negatively regulated by the PKC and PKA, which are also known to be activated by insulin or IGF-1, as determined in Rat1, NIH 3T3, and HEK293 cells (81, 82). Moreover, the inhibition of glycogen synthesis with PPP preincubation, an IGF-1 kinase inhibitor, diminished the decrease in IGF-1 stimulated glucose levels (Fig. 4d). However, in view of the common evolutionary origins of insulin and IGF-1 and their similar structure, there is a certain degree of interference between them (51, 83), which we summarize in Fig. 6.
FIGURE 6.

Modulation of glycogen stores in astrocytes by insulin and IGF-1. After the binding of insulin or IGF-1 to their receptors, several mutual signaling pathways may be activated. The pathway leading to glycogen synthesis is the PI3K/Akt pathway. Activation of the PI3K/Akt pathway inactivates GSK-3β. GSK-3β is also inactivated through the PKA and PKC pathways. Inactivated GSK-3β results in less phosphorylated and thus more active glycogen synthase (GS), which in turn depletes intracellular glucose 6-phosphate (G6P) and lowers the glucose concentration. GLUT1 and GLUT3 are major glucose transporters in astrocytes; GLUT4 is also present. Glucose is phosphorylated by hexokinase (HK) to produce glucose 6-phosphate, which in turn negatively regulates the activity of hexokinase. The effect of IGF-1 is inhibited by a selective IGF1R inhibitor, PPP, and the PI3K/Akt pathway is inhibited by wortmannin, a selective PI3K inhibitor.
In conclusion, we show here that the availability of cytosolic glucose after stimulation with insulin and IGF-1 is decreased in astrocytes, which suggests that stimulated glycogen synthesis and cytosolic glucose utilization exceed the delivery of glucose in astrocytes. The results of the present study also demonstrate that after glucose depletion, glycogen stores are rebuilt where insulin and IGF-1 boost the process of glycogen formation. It is thought that insulin and IGF-1 signaling is involved in the formation of cognition and memory (40–43). Our data clearly support the idea that dysfunction of insulinoid signaling may lead to insufficient replenishing of glycogen stores. The lack of a short term energy buffer may then affect processes involved in neurodegenerative disorders, psychiatric disorders, and regulation of food intake.
This work was supported by Grants P3 310, J3 4051, and J3 4146 from the Slovenian Research Agency, COST Action BM1002, and an EduGlia Initial Training Network European Union (ITN EU) grant.
- IGF
- insulin-like growth factor
- CFP
- cyan fluorescence protein
- PPP
- picropodophyllotoxin
- PAS
- periodic acid-Schiff
- IR
- insulin receptor
- IGF1R
- IGF-1 receptor
- GLUT
- glucose transporter
- GSK
- glycogen synthase kinase.
REFERENCES
- 1. Attwell D., Laughlin S. B. (2001) An energy budget for signaling in the grey matter of the brain. J. Cereb. Blood Flow Metab. 21, 1133–1145 [DOI] [PubMed] [Google Scholar]
- 2. Kacem K., Lacombe P., Seylaz J., Bonvento G. (1998) Structural organization of the perivascular astrocyte endfeet and their relationship with the endothelial glucose transporter: a confocal microscopy study. Glia 23, 1–10 [PubMed] [Google Scholar]
- 3. DiNuzzo M., Mangia S., Maraviglia B., Giove F. (2010) Glycogenolysis in astrocytes supports blood-borne glucose channeling not glycogen-derived lactate shuttling to neurons: evidence from mathematical modeling. J. Cereb. Blood Flow Metab. 30, 1895–1904 [DOI] [PMC free article] [PubMed] [Google Scholar]
- 4. DiNuzzo M., Maraviglia B., Giove F. (2011) Why does the brain (not) have glycogen? BioEssays 33, 319–326 [DOI] [PubMed] [Google Scholar]
- 5. Tsacopoulos M., Magistretti P. J. (1996) Metabolic coupling between glia and neurons. J. Neurosci. 16, 877–885 [DOI] [PMC free article] [PubMed] [Google Scholar]
- 6. Walz W., Mukerji S. (1988) Lactate production and release in cultured astrocytes. Neurosci. Lett. 86, 296–300 [DOI] [PubMed] [Google Scholar]
- 7. Dringen R., Gebhardt R., Hamprecht B. (1993) Glycogen in astrocytes: possible function as lactate supply for neighboring cells. Brain Res. 623, 208–214 [DOI] [PubMed] [Google Scholar]
- 8. Dringen R., Wiesinger H., Hamprecht B. (1993) Uptake of l-lactate by cultured rat brain neurons. Neurosci. Lett. 163, 5–7 [DOI] [PubMed] [Google Scholar]
- 9. Mangia S., Simpson I. A., Vannucci S. J., Carruthers A. (2009) The in vivo neuron-to-astrocyte lactate shuttle in human brain: evidence from modeling of measured lactate levels during visual stimulation. J. Neurochem. 109, 55–62 [DOI] [PMC free article] [PubMed] [Google Scholar]
- 10. Pellerin L., Bouzier-Sore A. K., Aubert A., Serres S., Merle M., Costalat R., Magistretti P. J. (2007) Activity-dependent regulation of energy metabolism by astrocytes: an update. Glia 55, 1251–1262 [DOI] [PubMed] [Google Scholar]
- 11. Pfeiffer-Guglielmi B., Fleckenstein B., Jung G., Hamprecht B. (2003) Immunocytochemical localization of glycogen phosphorylase isozymes in rat nervous tissues by using isozyme-specific antibodies. J. Neurochem. 85, 73–81 [DOI] [PubMed] [Google Scholar]
- 12. Cataldo A. M., Broadwell R. D. (1986) Cytochemical identification of cerebral glycogen and glucose-6-phosphatase activity under normal and experimental conditions: II. choroid plexus and ependymal epithelia, endothelia and pericytes. J. Neurocytol. 15, 511–524 [DOI] [PubMed] [Google Scholar]
- 13. Brown A. M., Ransom B. R. (2007) Astrocyte glycogen and brain energy metabolism. Glia 55, 1263–1271 [DOI] [PubMed] [Google Scholar]
- 14. Suh S. W., Bergher J. P., Anderson C. M., Treadway J. L., Fosgerau K., Swanson R. A. (2007) Astrocyte glycogen sustains neuronal activity during hypoglycemia: studies with the glycogen phosphorylase inhibitor CP-316,819 ([R-R*,S*]-5-chloro-N-[2-hydroxy-3-(methoxymethylamino)-3-oxo-1-(phenylmethyl)pro pyl]-1H-indole-2-carboxamide). J. Pharmacol. Exp. Ther. 321, 45–50 [DOI] [PubMed] [Google Scholar]
- 15. Ransom B. R., Fern R. (1997) Does astrocytic glycogen benefit axon function and survival in CNS white matter during glucose deprivation? Glia 21, 134–141 [PubMed] [Google Scholar]
- 16. Choi I. Y., Seaquist E. R., Gruetter R. (2003) Effect of hypoglycemia on brain glycogen metabolism in vivo. J. Neurosci. Res. 72, 25–32 [DOI] [PMC free article] [PubMed] [Google Scholar]
- 17. Swanson R. A. (1992) Physiologic coupling of glial glycogen metabolism to neuronal activity in brain. Can. J. Physiol. Pharmacol. 70, S138–S144 [DOI] [PubMed] [Google Scholar]
- 18. Cruz N. F., Dienel G. A. (2002) High glycogen levels in brains of rats with minimal environmental stimuli: implications for metabolic contributions of working astrocytes. J. Cereb. Blood Flow Metab. 22, 1476–1489 [DOI] [PubMed] [Google Scholar]
- 19. Kong J., Shepel P. N., Holden C. P., Mackiewicz M., Pack A. I., Geiger J. D. (2002) Brain glycogen decreases with increased periods of wakefulness: implications for homeostatic drive to sleep. J. Neurosci. 22, 5581–5587 [DOI] [PMC free article] [PubMed] [Google Scholar]
- 20. Brown A. M., Tekkök S. B., Ransom B. R. (2003) Glycogen regulation and functional role in mouse white matter. J. Physiol. 549, 501–512 [DOI] [PMC free article] [PubMed] [Google Scholar]
- 21. Shulman R. G., Hyder F., Rothman D. L. (2001) Cerebral energetics and the glycogen shunt: neurochemical basis of functional imaging. Proc. Natl. Acad. Sci. U.S.A. 98, 6417–6422 [DOI] [PMC free article] [PubMed] [Google Scholar]
- 22. Walls A. B., Heimbürger C. M., Bouman S. D., Schousboe A., Waagepetersen H. S. (2009) Robust glycogen shunt activity in astrocytes: Effects of glutamatergic and adrenergic agents. Neuroscience 158, 284–292 [DOI] [PubMed] [Google Scholar]
- 23. Wiesinger H., Hamprecht B., Dringen R. (1997) Metabolic pathways for glucose in astrocytes. Glia 21, 22–34 [DOI] [PubMed] [Google Scholar]
- 24. Magistretti P. J. (1988) Regulation of glycogenolysis by neurotransmitters in the central nervous system. Diabete Metab. 14, 237–246 [PubMed] [Google Scholar]
- 25. Havrankova J., Roth J., Brownstein M. (1978) Insulin receptors are widely distributed in the central nervous system of the rat. Nature 272, 827–829 [DOI] [PubMed] [Google Scholar]
- 26. Zhu S. Q., Kum W., Ho S. K., Young J. D., Cockram C. S. (1990) Structure-function relationships of insulin receptor interactions in cultured mouse astrocytes. Brain Res. 529, 329–332 [DOI] [PubMed] [Google Scholar]
- 27. Heni M., Hennige A. M., Peter A., Siegel-Axel D., Ordelheide A. M., Krebs N., Machicao F., Fritsche A., Häring H. U., Staiger H. (2011) Insulin promotes glycogen storage and cell proliferation in primary human astrocytes. PLoS One 6, e21594. [DOI] [PMC free article] [PubMed] [Google Scholar]
- 28. Woods S. C., Seeley R. J., Baskin D. G., Schwartz M. W. (2003) Insulin and the blood-brain barrier. Curr. Pharm. Des. 9, 795–800 [DOI] [PubMed] [Google Scholar]
- 29. Banks W. A. (2004) The source of cerebral insulin. Eur. J. Pharmacol. 490, 5–12 [DOI] [PubMed] [Google Scholar]
- 30. Weindl A., Sofroniew M. V. (1981) Relation of neuropeptides to mammalian circumventricular organs. Adv. Biochem. Psychopharmacol. 28, 303–320 [PubMed] [Google Scholar]
- 31. Baskin D. G., Figlewicz D. P., Woods S. C., Porte D., Jr., Dorsa D. M. (1987) Insulin in the brain. Annu. Rev. Physiol. 49, 335–347 [DOI] [PubMed] [Google Scholar]
- 32. Baura G. D., Foster D. M., Porte D., Jr., Kahn S. E., Bergman R. N., Cobelli C., Schwartz M. W. (1993) Saturable transport of insulin from plasma into the central nervous system of dogs in vivo: A mechanism for regulated insulin delivery to the brain. J. Clin. Invest. 92, 1824–1830 [DOI] [PMC free article] [PubMed] [Google Scholar]
- 33. Steffens A. B., Scheurink A. J., Porte D., Jr., Woods S. C. (1988) Penetration of peripheral glucose and insulin into cerebrospinal fluid in rats. Am. J. Physiol. 255, R200–R204 [DOI] [PubMed] [Google Scholar]
- 34. Banks W. A., Jaspan J. B., Huang W., Kastin A. J. (1997) Transport of insulin across the blood-brain barrier: saturability at euglycemic doses of insulin. Peptides 18, 1423–1429 [DOI] [PubMed] [Google Scholar]
- 35. Schwartz M. W., Sipols A., Kahn S. E., Lattemann D. F., Taborsky G. J., Jr., Bergman R. N., Woods S. C., Porte D., Jr. (1990) Kinetics and specificity of insulin uptake from plasma into cerebrospinal fluid. Am. J. Physiol. 259, E378–E383 [DOI] [PubMed] [Google Scholar]
- 36. Schubert M., Brazil D. P., Burks D. J., Kushner J. A., Ye J., Flint C. L., Farhang-Fallah J., Dikkes P., Warot X. M., Rio C., Corfas G., White M. F. (2003) Insulin receptor substrate-2 deficiency impairs brain growth and promotes tau phosphorylation. J. Neurosci. 23, 7084–7092 [DOI] [PMC free article] [PubMed] [Google Scholar]
- 37. Woods S. C., Lotter E. C., McKay L. D., Porte D., Jr. (1979) Chronic intracerebroventricular infusion of insulin reduces food intake and body weight of baboons. Nature 282, 503–505 [DOI] [PubMed] [Google Scholar]
- 38. Brüning J. C., Gautam D., Burks D. J., Gillette J., Schubert M., Orban P. C., Klein R., Krone W., Müller-Wieland D., Kahn C. R. (2000) Role of brain insulin receptor in control of body weight and reproduction. Science 289, 2122–2125 [DOI] [PubMed] [Google Scholar]
- 39. Rodin J., Wack J., Ferrannini E., DeFronzo R. A. (1985) Effect of insulin and glucose on feeding behavior. Metab. Clin. Exp. 34, 826–831 [DOI] [PubMed] [Google Scholar]
- 40. Craft S., Baker L. D., Montine T. J., Minoshima S., Watson G. S., Claxton A., Arbuckle M., Callaghan M., Tsai E., Plymate S. R., Green P. S., Leverenz J., Cross D., Gerton B. (2012) Intranasal insulin therapy for Alzheimer disease and amnestic mild cognitive impairment: a pilot clinical trial. Arch. Neurol. 69, 29–38 [DOI] [PMC free article] [PubMed] [Google Scholar]
- 41. Benedict C., Hallschmid M., Schultes B., Born J., Kern W. (2007) Intranasal insulin to improve memory function in humans. Neuroendocrinology 86, 136–142 [DOI] [PubMed] [Google Scholar]
- 42. Craft S., Asthana S., Newcomer J. W., Wilkinson C. W., Matos I. T., Baker L. D., Cherrier M., Lofgreen C., Latendresse S., Petrova A., Plymate S., Raskind M., Grimwood K., Veith R. C. (1999) Enhancement of memory in Alzheimer disease with insulin and somatostatin, but not glucose. Arch. Gen. Psychiatry 56, 1135–1140 [DOI] [PubMed] [Google Scholar]
- 43. Kern W., Peters A., Fruehwald-Schultes B., Deininger E., Born J., Fehm H. L. (2001) Improving influence of insulin on cognitive functions in humans. Neuroendocrinology 74, 270–280 [DOI] [PubMed] [Google Scholar]
- 44. Kodl C. T., Seaquist E. R. (2008) Cognitive dysfunction and diabetes mellitus. Endocr. Rev. 29, 494–511 [DOI] [PMC free article] [PubMed] [Google Scholar]
- 45. McEwen B. S., Magariños A. M., Reagan L. P. (2002) Studies of hormone action in the hippocampal formation: possible relevance to depression and diabetes. J. Psychosom. Res. 53, 883–890 [DOI] [PubMed] [Google Scholar]
- 46. Reagan L. P. (2007) Insulin signaling effects on memory and mood. Curr. Opin. Pharmacol. 7, 633–637 [DOI] [PMC free article] [PubMed] [Google Scholar]
- 47. Frölich L., Blum-Degen D., Bernstein H. G., Engelsberger S., Humrich J., Laufer S., Muschner D., Thalheimer A., Türk A., Hoyer S., Zöchling R., Boissl K. W., Jellinger K., Riederer P. (1998) Brain insulin and insulin receptors in aging and sporadic Alzheimer's disease. J. Neural Transm. 105, 423–438 [DOI] [PubMed] [Google Scholar]
- 48. Takahashi M., Yamada T., Tooyama I., Moroo I., Kimura H., Yamamoto T., Okada H. (1996) Insulin receptor mRNA in the substantia nigra in Parkinson's disease. Neurosci. Lett. 204, 201–204 [DOI] [PubMed] [Google Scholar]
- 49. Craft S., Peskind E., Schwartz M. W., Schellenberg G. D., Raskind M., Porte D., Jr. (1998) Cerebrospinal fluid and plasma insulin levels in Alzheimer's disease: relationship to severity of dementia and apolipoprotein E genotype. Neurology 50, 164–168 [DOI] [PubMed] [Google Scholar]
- 50. Gil-Bea F. J., Solas M., Solomon A., Mugueta C., Winblad B., Kivipelto M., Ramirez M. J., Cedazo-Mínguez A. (2010) Insulin levels are decreased in the cerebrospinal fluid of women with prodomal Alzheimer's disease. J. Alzheimers Dis. 22, 405–413 [DOI] [PubMed] [Google Scholar]
- 51. Werner H., Weinstein D., Bentov I. (2008) Similarities and differences between insulin and IGF-I: structures, receptors, and signalling pathways. Arch. Physiol. Biochem. 114, 17–22 [DOI] [PubMed] [Google Scholar]
- 52. Armstrong C. S., Wuarin L., Ishii D. N. (2000) Uptake of circulating insulin-like growth factor-I into the cerebrospinal fluid of normal and diabetic rats and normalization of IGF-II mRNA content in diabetic rat brain. J. Neurosci. Res. 59, 649–660 [DOI] [PubMed] [Google Scholar]
- 53. Ocrant I., Valentino K. L., Eng L. F., Hintz R. L., Wilson D. M., Rosenfeld R. G. (1988) Structural and immunohistochemical characterization of insulin-like growth factor I and II receptors in the murine central nervous system. Endocrinology 123, 1023–1034 [DOI] [PubMed] [Google Scholar]
- 54. Cheng C. L., Gao T. Q., Wang Z., Li D. D. (2005) Role of insulin/insulin-like growth factor 1 signaling pathway in longevity. World J. Gastroenterol. 11, 1891–1895 [DOI] [PMC free article] [PubMed] [Google Scholar]
- 55. Bassil F., Fernagut P. O., Bezard E., Meissner W. G. (2014) Insulin, IGF-1 and GLP-1 signaling in neurodegenerative disorders: targets for disease modification? Prog. Neurobiol. 118, 1–18 [DOI] [PubMed] [Google Scholar]
- 56. Kum W., Zhu S. Q., Ho S. K., Young J. D., Cockram C. S. (1992) Effect of insulin on glucose and glycogen metabolism and leucine incorporation into protein in cultured mouse astrocytes. Glia 6, 264–268 [DOI] [PubMed] [Google Scholar]
- 57. Dringen R., Hamprecht B. (1992) Glucose, insulin, and insulin-like growth factor I regulate the glycogen content of astroglia-rich primary cultures. J. Neurochem. 58, 511–517 [DOI] [PubMed] [Google Scholar]
- 58. Hamai M., Minokoshi Y., Shimazu T. (1999) l-Glutamate and insulin enhance glycogen synthesis in cultured astrocytes from the rat brain through different intracellular mechanisms. J. Neurochem. 73, 400–407 [DOI] [PubMed] [Google Scholar]
- 59. Nijland P. G., Michailidou I., Witte M. E., Mizee M. R., van der Pol S. M., van Het Hof B., Reijerkerk A., Pellerin L., van der Valk P., de Vries H. E., van Horssen J. (2014) Cellular distribution of glucose and monocarboxylate transporters in human brain white matter and multiple sclerosis lesions. Glia 62, 1125–1141 [DOI] [PubMed] [Google Scholar]
- 60. Bittner C. X., Loaiza A., Ruminot I., Larenas V., Sotelo-Hitschfeld T., Gutierrez R., Cordova A., Valdebenito R., Frommer W. B., Barros L. F. (2010) High resolution measurement of the glycolytic rate. Front. Neuroenergetics 2, pii. [DOI] [PMC free article] [PubMed] [Google Scholar]
- 61. Schwartz J. P., Wilson D. J. (1992) Preparation and characterization of type 1 astrocytes cultured from adult rat cortex, cerebellum, and striatum. Glia 5, 75–80 [DOI] [PubMed] [Google Scholar]
- 62. Takanaga H., Chaudhuri B., Frommer W. B. (2008) GLUT1 and GLUT9 as major contributors to glucose influx in HepG2 cells identified by a high sensitivity intramolecular FRET glucose sensor. Biochim. Biophys. Acta 1778, 1091–1099 [DOI] [PMC free article] [PubMed] [Google Scholar]
- 63. Prebil M., Vardjan N., Jensen J., Zorec R., Kreft M. (2011) Dynamic monitoring of cytosolic glucose in single astrocytes. Glia 59, 903–913 [DOI] [PubMed] [Google Scholar]
- 64. Rosenberg P. A., Dichter M. A. (1985) Glycogen accumulation in rat cerebral cortex in dissociated cell culture. J. Neurosci. Methods 15, 101–112 [DOI] [PubMed] [Google Scholar]
- 65. Nakanishi S., Catt K. J., Balla T. (1995) A wortmannin-sensitive phosphatidylinositol 4-kinase that regulates hormone-sensitive pools of inositolphospholipids. Proc. Natl. Acad. Sci. U.S.A. 92, 5317–5321 [DOI] [PMC free article] [PubMed] [Google Scholar]
- 66. Girnita A., Girnita L., del Prete F., Bartolazzi A., Larsson O., Axelson M. (2004) Cyclolignans as inhibitors of the insulin-like growth factor-1 receptor and malignant cell growth. Cancer Res. 64, 236–242 [DOI] [PubMed] [Google Scholar]
- 67. Manolescu A. R., Witkowska K., Kinnaird A., Cessford T., Cheeseman C. (2007) Facilitated hexose transporters: new perspectives on form and function. Physiology 22, 234–240 [DOI] [PubMed] [Google Scholar]
- 68. Brant A. M., Jess T. J., Milligan G., Brown C. M., Gould G. W. (1993) Immunological analysis of glucose transporters expressed in different regions of the rat brain and central nervous system. Biochem. Biophys. Res. Commun. 192, 1297–1302 [DOI] [PubMed] [Google Scholar]
- 69. Rayner D. V., Thomas M. E., Trayhurn P. (1994) Glucose transporters (GLUTs 1–4) and their mRNAs in regions of the rat brain: insulin-sensitive transporter expression in the cerebellum. Can. J. Physiol. Pharmacol. 72, 476–479 [DOI] [PubMed] [Google Scholar]
- 70. McCall A. L., van Bueren A. M., Huang L., Stenbit A., Celnik E., Charron M. J. (1997) Forebrain endothelium expresses GLUT4, the insulin-responsive glucose transporter. Brain Res. 744, 318–326 [DOI] [PubMed] [Google Scholar]
- 71. Ngarmukos C., Baur E. L., Kumagai A. K. (2001) Co-localization of GLUT1 and GLUT4 in the blood-brain barrier of the rat ventromedial hypothalamus. Brain Res. 900, 1–8 [DOI] [PubMed] [Google Scholar]
- 72. Laron Z. (2009) Insulin and the brain. Arch. Physiol. Biochem. 115, 112–116 [DOI] [PubMed] [Google Scholar]
- 73. Dent P., Lavoinne A., Nakielny S., Caudwell F. B., Watt P., Cohen P. (1990) The molecular mechanism by which insulin stimulates glycogen synthesis in mammalian skeletal muscle. Nature 348, 302–308 [DOI] [PubMed] [Google Scholar]
- 74. Cross D. A., Alessi D. R., Cohen P., Andjelkovich M., Hemmings B. A. (1995) Inhibition of glycogen synthase kinase-3 by insulin mediated by protein kinase B. Nature 378, 785–789 [DOI] [PubMed] [Google Scholar]
- 75. Pellegri G., Rossier C., Magistretti P. J., Martin J. L. (1996) Cloning, localization and induction of mouse brain glycogen synthase. Brain Res. Mol. Brain Res. 38, 191–199 [DOI] [PubMed] [Google Scholar]
- 76. Inoue N., Matsukado Y., Goto S., Miyamoto E. (1988) Localization of glycogen synthase in brain. J. Neurochem. 50, 400–405 [DOI] [PubMed] [Google Scholar]
- 77. Pfeiffer B., Elmer K., Roggendorf W., Reinhart P. H., Hamprecht B. (1990) Immunohistochemical demonstration of glycogen phosphorylase in rat brain slices. Histochemistry 94, 73–80 [DOI] [PubMed] [Google Scholar]
- 78. Crerar M. M., Karlsson O., Fletterick R. J., Hwang P. K. (1995) Chimeric muscle and brain glycogen phosphorylases define protein domains governing isozyme-specific responses to allosteric activation. J. Biol. Chem. 270, 13748–13756 [DOI] [PubMed] [Google Scholar]
- 79. Sofroniew M. V., Vinters H. V. (2010) Astrocytes: biology and pathology. Acta Neuropathol. 119, 7–35 [DOI] [PMC free article] [PubMed] [Google Scholar]
- 80. Saltiel A. R., Kahn C. R. (2001) Insulin signalling and the regulation of glucose and lipid metabolism. Nature 414, 799–806 [DOI] [PubMed] [Google Scholar]
- 81. Goode N., Hughes K., Woodgett J. R., Parker P. J. (1992) Differential regulation of glycogen synthase kinase-3 beta by protein kinase C isotypes. J. Biol. Chem. 267, 16878–16882 [PubMed] [Google Scholar]
- 82. Fang X., Yu S. X., Lu Y., Bast R. C., Jr., Woodgett J. R., Mills G. B. (2000) Phosphorylation and inactivation of glycogen synthase kinase 3 by protein kinase A. Proc. Natl. Acad. Sci. U.S.A. 97, 11960–11965 [DOI] [PMC free article] [PubMed] [Google Scholar]
- 83. Blakesley V. A., Scrimgeour A., Esposito D., Le Roith D. (1996) Signaling via the insulin-like growth factor-I receptor: does it differ from insulin receptor signaling? Cytokine Growth Factor Rev. 7, 153–159 [DOI] [PubMed] [Google Scholar]