Abstract
α-Chlorofatty aldehydes (α-ClFALDs) are produced by hypochlorous acid targeting plasmalogens during neutrophil activation. This study investigated the reaction of the α-chlorinated carbon of α-ClFALD with the nucleophile, GSH. Utilizing ESI/MS/MS, the reaction product of GSH and the 16-carbon α-ClFALD, 2-chlorohexadecanal (2-ClHDA), was characterized. The resulting conjugate of 2-ClHDA and GSH (HDA-GSH) has an intact free aldehyde, and the chlorine at the α-carbon is ejected. Stable isotope-labeled [d4]HDA-GSH was synthesized, which further confirmed the structure, and was used to quantify natural α-ClFALD conjugates of GSH (FALD-GSH) using reverse-phase LC with detection by ESI/MS/MS using selected reaction monitoring. HDA-GSH is elevated in RAW 264.7 cells treated with physiologically relevant concentrations of exogenous 2-ClHDA. Furthermore, PMA-treated primary human neutrophils have elevated levels of HDA-GSH and the conjugate of 2-chlorooctadecanal (2-ClODA) and GSH (ODA-GSH), as well as elevated levels of 2-ClHDA and 2-ClODA. Production of both conjugates in PMA-stimulated neutrophils was reduced by 3-aminotriazole pretreatment, which also blocks endogenous α-ClFALD production. Additionally, plasma FALD-GSH levels were elevated in the K/BxN mouse arthritis model. Taken together, these studies demonstrate novel peptidoaldehydes derived from GSH and α-ClFALD in activated human neutrophils and in vivo in K/BxN mice.
Keywords: myeloperoxidase, fatty aldehydes, plasmalogen, hypochlorous acid
Phagocytes are critical in bacterial killing and in the progression and resolution of inflammation. The sequelae of inflammation include the concerted role of activated neutrophils, monocytes, and macrophages releasing numerous bioactive molecules including reactive oxygen species and proteases. One mechanism during phagocyte activation involves the reactive oxygen species hydrogen peroxide being used by myeloperoxidase (MPO) resulting in hypochlorous acid production (1, 2). Previous studies have shown that hypochlorous acid targets the vinyl ether linkage of plasmalogens liberating α-chlorofatty aldehydes (α-ClFALDs) (3). Plasmalogens are an abundant subclass of phospholipid found in many cells and tissues but are particularly enriched in phagocytes, endothelial cells, myocardium, lung, and brain (4–8). α-ClFALDs have previously been shown to accumulate in activated human neutrophils and monocytes (9, 10) and are elevated in human aortic atherosclerotic plaques and infarcted rat myocardium (11, 12). Several studies have suggested that α-ClFALDs contribute to tissue injury by mechanisms that include the following: 1) eliciting both endothelial dysfunction (13) and neuronal apoptosis (14), 2) inhibition of eNOS activity (15), 3) neutrophil chemotaxis (9), 4) eliciting myocardial contractile dysfunction (12), and 5) activating the nuclear factor κB pathway in endothelial cells (16).
Although α-ClFALD is produced during phagocyte activation and has numerous biological functions, α-ClFALD-mediated mechanisms impacting cell function remain to be resolved. α-ClFALD can be metabolized to α-chlorofatty acid (α-ClFA) and α-chlorofatty alcohol (α-ClFOH) (17, 18). Recently, α-ClFA has been shown to induce endoplasmic reticulum stress and apoptosis (19). Regarding biological activities attributed to α-ClFALD, it is possible that some may be mediated through its metabolism to α-ClFA. However, other fates of α-ClFALD seem likely due to the inherent reactive aldehyde and α-chlorinated carbon of this molecule. Although we have shown that α-ClFALD forms reversible Schiff base adducts with amines (20), the electrophilic properties of the α-chlorinated carbon of α-ClFALD have not been examined as a target of cellular nucleophiles. The metabolism of lipid oxidation products such as 4-hydroxy-2-(E)-nonenal (21), biosynthesis and metabolism of leukotrienes (22), and detoxification of xenobiotics (23) are all heavily reliant on conjugation to glutathione (GSH). Because the nucleophilic thiol of GSH is known to modify unsaturated and halogenated carbons either chemically or catalyzed by glutathione-S-transferase (23), the studies herein examined the electrophilic nature of the α-chlorinated carbon of α-ClFALD as a target of the nucleophilic thiol of glutathione.
Understanding α-ClFALD metabolism and the cellular impact of α-ClFALD metabolites is critical to better understand the role of chlorinated lipids in inflammatory pathologies. Accordingly, the present study examined the reactivity of 2-chlorohexadecanal (2-ClHDA) with GSH and the production of α-ClFALD conjugates of GSH (FALD-GSH) in activated neutrophils. The results demonstrate that α-ClFALD chemically reacts with GSH to produce a novel class of peptidoaldehydes (FALD-GSH) and identify FALD-GSH production in activated neutrophils as well as in vivo in the plasma of a mouse arthritis model.
MATERIALS AND METHODS
Materials
HPLC-grade methanol, acetonitrile, and isopropanol were purchased from Fisher Scientific. TLC plates (20 × 20 cm, 40 Å silica gel) were obtained from EMB Millipore. [7,7,8,8-d4]hexadecanoic acid was purchased from Medical Isotopes. All other chemicals were purchased from Sigma-Aldrich or Fisher Scientific.
Instrumentation
MS was performed using a Thermo Fisher TSQ Quantum Ultra mass spectrometer (Thermo Fisher, Waltham, MA). For experiments requiring LC/MS, a Thermo Fisher Surveyor LC system was coupled to the Quantum Ultra. LC/MS data analysis was performed using XCalibur software (Thermo Fisher).
2-ClHDA and GSH in vitro reaction products and TLC purification
Unless otherwise indicated, all reactions were carried out in PBS (pH 7.4), methanol, and ethyl ether at a ratio of 0.6:1.5:2. Briefly, 2-ClHDA or hexadecanal (HDA) (3 μmol) was first suspended in 73 μl of ethyl ether in a clean, borosilicate reaction vessel. Fifty-five microliters of methanol was then added ± N-ethylmaleimide (NEM; 2.25 μmol). Finally, GSH (1.5 μmol) was added in 22 μl PBS, and the reaction mixture was vortexed and allowed to react in a sealed reaction vessel at 37°C for 4 h. Reaction aliquots (10 μl) were loaded onto 40 Å silica gel TLC plates. Mobile phase for TLC was composed of chloroform-acetone-methanol-water-acetic acid (6:8:2:2:1 v/v/v/v/v). TLC plates where visualized with ninhydrin or 2,4-dinitrophenylhydrazine (DNPH). TLC lanes used for purification were not stained but scraped and extracted using 1 ml of acetonitrile-water (7:3, v/v) supplemented with 0.25% formic acid. The solution was centrifuged at 2,000 g for 5 min and the supernatant removed. The supernatant was dried under nitrogen and suspended in 150 μl acetonitrile-water (7:3, v/v) supplemented with 0.1% formic acid for ESI/MS/MS analysis.
ESI/MS/MS characterization of 2-ClHDA and GSH in vitro reaction products
TLC-purified 2-ClHDA conjugates of GSH (HDA-GSH) was diluted 2,000× with acetonitrile-water (7:3) containing 0.1% formic acid, which was analyzed by ESI/MS/MS by direct infusion at a flow rate of 5 μl/min. For ESI/MS/MS, the ionization energy and temperature were set at 3,700 V and 270°C for positive ion mode and 2,600 V and 270°C for negative ion mode. A collision energy of 15 eV and collision gas of 1.0 Torr argon were used for MS/MS analyses in both the positive and negative ion modes.
DNPH derivatization of HDA-GSH
Sixty micrograms of synthetic HDA-GSH was suspended in 100 μl of water-acetonitrile (1:1, v/v) in a reaction vessel. One hundred microliters of 3.1 mg/ml DNPH in 2 M HCl was added, and the reaction was vortexed every minute for 15 min. Subsequently, 1 ml of water was added, and the reaction product was purified using a C-18 solid-phase extraction (SPE) column (Supelclean™ LC-18 SPE Tube, 100 mg). Reaction products were eluted with 1 ml methanol. The eluted product was dried under N2 and suspended in 300 μl water-acetonitrile (3:1, v/v). Free DNPH was then removed with three washes of 500 μl chloroform. The remaining aqueous layer was dried and suspended in 200 μl water-acetonitrile-isopropanol (3:3:2, v/v/v) containing 0.15% formic acid. Ten microliters of the SPE-purified derivative was diluted 50-fold and analyzed by ESI/MS/MS in direct injection mode.
Synthesis of stable isotope-labeled HDA-GSH
Commercially available [7,7,8,8-d4]hexadecanoic acid was converted to 2-bromo-[7,7,8,8-d4]hexadecanal (2-Br-[d4]HDA) as previously described (24). One hundred and fifty milligrams of 2-Br-[d4]HDA was then reacted with 300 mg GSH in 3 ml of ethyl ether-methanol-water (2:1.5:0.6, v/v/v) for 4 h at 37°C. Reaction products were then extracted in ethyl ether by the addition of 10 ml water and 15 ml ethyl ether. The collected ethyl ether layer including interface was extracted and dried to a white solid. The white solid was sequentially washed three times with 10 ml hexane, two times with 10 ml methanol, and two times with 10 ml water to remove any remaining free 2-Br-[d4]HDA and GSH. The final product was dried by lyophilization, weighed, and the purity of the resultant [d4]HDA-GSH product confirmed by direction infusion ESI/MS/MS.
RAW 264.7 cell treatments with 2-ClHDA
RAW 264.7 cells were treated with either 0, 1, 5, 25, or 50 μM 2-ClHDA in DMEM supplemented with 2% FBS for 8 h. The medium was then removed, and cells were washed with PBS. The cells were scraped in 1.25 ml PBS containing 10 mM NEM and immediately frozen. NEM was added to the final cell homogenate solution to block free GSH sulfhydryls from spontaneously reacting with α-ClFALD following cell incubations.
Human neutrophil studies
Whole blood (50–150 ml) was taken from healthy volunteers and anticoagulated with EDTA (final concentration 5.4 mM) prior to the isolation of neutrophils using a Ficoll-Hypaque gradient as previously described (9). These studies were approved and authorized by the Saint Louis University Institutional Review Board Protocol 9952. Informed consent was obtained from the human subjects. Neutrophils were diluted to 1 million neutrophils per ml in HBSS. PMA (200 nM) in ethanol (0.1%) and 10 mM 3-aminotriazole (AT) were then added as indicated. Incubations were for 0–60 min at 37°C. At the end of each reaction, 10 mM NEM was added, and the neutrophils were immediately frozen prior to extraction.
Quantification of α-ClFALD in human neutrophils
Neutrophil lipids were extracted using a modified Bligh and Dyer procedure in the presence of 2-chloro-[7,7,8,8-d4]hexadecanal (25). Subsequently, α-ClFALD molecular species in lipid extracts were derivatized to their pentafluorobenzyl (PFB) oximes, using PFB hydroxylamine, and these derivatives were used to quantify α-ClFALD molecular species using GC/MS with selected ion monitoring detection and negative ion chemical ionization as previously described (11, 26).
Extraction and quantification of FALD-GSH
To extract and quantitate FALD-GSH, 90 fmol of [d4]HDA-GSH and 1 vol of methanol-acetonitrile (1:1, v/v) were added to 100 μl of the RAW 264.7 cell homogenate, and 45 fmol of [d4]HDA-GSH and 1 vol of methanol-acetonitrile (1:1, v/v) were added to 1 ml neutrophil suspension. Both solutions were then vortexed for 30 s, sonicated in a sonication bath for 15 s, and vortexed for another 30 s. The resulting solution was centrifuged at 1,000 g for 5 min, and the supernatant removed. The supernatant was loaded on a Strata-X column (60 mg bed weight) that was preconditioned with 1.2 ml methanol followed by 1.2 ml water-methanol (4:1, v/v). Columns were washed two times with 0.6 ml water-methanol (4:1, v/v), and then HDA-GSH was eluted with 1.2 ml of methanol-acetonitrile (3:1, v/v) containing 0.25% formic acid. The eluted adduct was dried under nitrogen and suspended in 100 μl of 6:4:5 acetonitrile-isopropanol-water containing 0.15% formic acid for analysis by LC/MS/MS. LC was performed using a Phenomenex Onyx C-18 column (50 × 2.0 mm) with ESI/MS/MS detection using selected reaction monitoring (SRM). Two mobile phases were used for LC. Solvent A was water containing 0.15% formic acid, and solvent B was acetonitrile-isopropanol (3:2, v/v) containing 0.15% formic acid. Initial column conditions were 65/35 (A/B) at a flow rate of 200 μl/min, which was held for 2 min following the injection of 25 μl of the Strata-X purified solutions onto the column. Subsequently, GSH adducts of 2-ClHDA were eluted by a 3 min linear gradient to 100% solvent B.
K/BxN mouse model
All animal procedures were conducted in accordance with guidelines published in the Guide for the Care and Use of Laboratory Animals (National Research Council, National Academy Press, Washington, DC, 1996) and were approved by the Animal Care Committee of Saint Louis University. KRN mice (obtained from Dr. K. C. Choi, Washington University in St. Louis, School of Medicine) were bred in house. The KRN mice were crossed with NOD/Lt mice (Jackson Laboratory; model 001976). Pups were screened by fluorescence-activated cell sorting analysis as previously described (27). CD4 Vβ6-positive mice were maintained on normal chow and euthanized at 9 weeks to obtain whole blood via cardiac puncture. Mice at this age have significant joint swelling of all four paws, and 50 μl of serum from these mice can robustly induce arthritis in C57BL/6J mice (27). To measure FALD-GSH, 45 fmol of [d4]HDA-GSH was added to 25 μl of plasma and sequentially diluted with 150 μl water containing 0.1% formic acid and then 640 μl methanol-acetonitrile (3:1, v/v). Diluted plasma was subsequently centrifuged 10 min at 16,100 gmax at 4°C to pellet precipitated protein. The resultant supernatant was collected and diluted with 470 μl water containing 0.1% formic acid prior to purification and quantification of FALD-GSH using Strata-X columns and LC/MS/MS (vide supra). Total plasma α-ClFA molecular species were measured from 25 μl of plasma subjected to base hydrolysis in the presence of 105 fmol 2-chloro-[d4]hexadecanoic acid (internal standard), and total fatty acid was extracted (11, 26). Fatty acids were then subjected to reverse-phase HPLC using a Phenomenex Onyx monolithic C-18 column (50 × 2.0 mm) and detected using ESI/MS/MS by SRM as previously described (11, 26).
Statistical analyses
Student’s t-test was used for comparisons between two groups. For comparisons between three or more groups to the control condition ANOVA was performed with the Dunnett post hoc test. In other cases when appropriate, Tukey’s post hoc test was used. All data are presented as mean ± SEM unless otherwise indicated.
RESULTS
In vitro adducts of 2-ClHDA with GSH
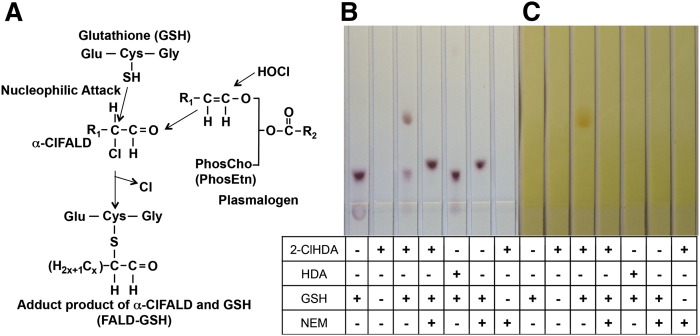
Based on the premise that the α-carbon of α-ClFALD is a target for modification by cellular nucleophiles, we examined the reactivity of 2-ClHDA with GSH (Fig. 1A). In initial studies, 2-ClHDA and GSH were reacted at a 2:1 molar excess of 2-ClHDA for 4 h. Reaction products were separated on silica gel TLC, and a novel reaction product was detected (Rf ≈ 2.4) using either ninhydrin or DNPH staining (Fig. 1B, C, lane 3). Both the reaction product and GSH are stained by ninhydrin (Fig. 1B), which readily stains the amine of GSH but does not stain 2-ClHDA. Additionally, the reaction product is stained by DNPH (Fig. 1C), which stains aldehydes but does not stain GSH. The importance of the α-chlorinated carbon for GSH attack is highlighted by the demonstration that no novel products were observed in reactions between GSH and HDA, which does not contain an α-chlorinated carbon (Fig. 1 B, C, lane 5). In other reactions, NEM was added to the reaction solution just prior to GSH. Under these conditions, 2-ClHDA did not form an adduct with GSH (Fig. 1B, C, lane 6), indicating that NEM is a preferred target for GSH compared with 2-ClHDA, and GSH adducts with 2-ClHDA are through a thiol-related mechanism. The NEM-GSH reaction product was visualized with the ninhydrin stain (Fig. 1B, lane 6).
Fig. 1.
TLC separation of reaction products from incubations of 2-ClHDA with GSH. Proposed mechanism for peptidoaldehyde production initiated by plasmalogen oxidation by HOCl (A). GSH (10 mM) was incubated with 2-ClHDA or HDA (20 mM) in the presence or absence of NEM (15 mM) for 4 h. Reaction products were resolved by silica TLC and were visualized by either ninhydrin staining (B) or DNPH staining (C) as described in Materials and Methods. The bottom half of the developed TLC plates are shown in B and C. PhosCho, phosphocholine; PhosEtn, phosphoethanolamine.
Characterization of the reaction product of 2-ClHDA and GSH by MS
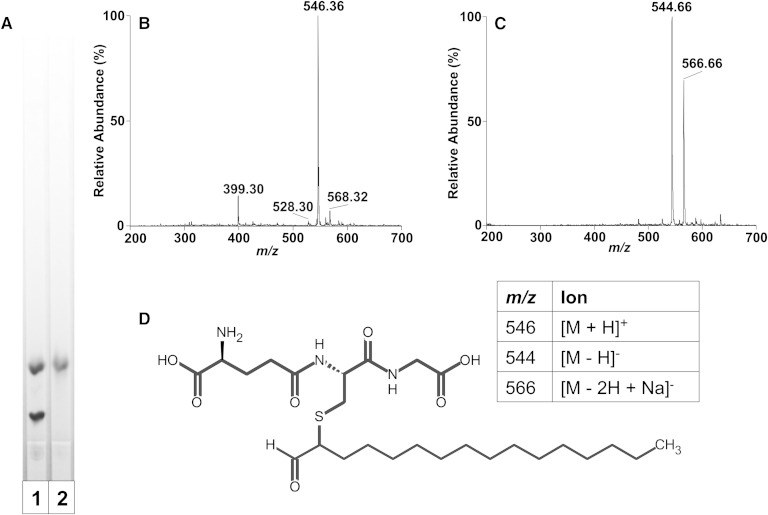
To characterize the product of the reaction of GSH with 2-ClHDA, the novel band (Rf ≈ 2.4) resolved on TLC was extracted and then subjected to ESI/MS/MS. Initially, the TLC-purified reaction product was subjected to a second TLC step to confirm the purity of the material as well as confirm the stability of the product after purification (Fig. 2A). In positive ion mode using ESI/MS, the purified reaction product was detected as a major ion at m/z 546.36 (Fig. 2B). This spectra indicates the product is not monochlorinated because there is no corresponding signature M + 2 ion associated with 37Cl. Thus, nucleophilic attack of the α-chlorinated carbon of α-ClFALD results in chlorine ejection during adduct formation. Taken together, nucleophilic attack of GSH on the α-chlorinated carbon, TLC evidence that the product contains amines and a free aldehyde, and the positive ion spectra shown in Fig. 2B support the structure shown in Fig. 2D. This proposed product has a C-S bond bridging the GSH cysteine to the α-carbon of 2-ClHDA while retaining a free aldehyde. This fatty aldehyde-GSH (FALD-GSH) adduct molecular species, HDA-GSH has a molecular mass of 545.31. Additional minor ions found in the positive ion scan of HDA-GSH are at m/z 568.32 and 528.30, which represent the sodiated adduct and the protonated adduct with the loss of water, respectively. The fourth ion found in the positive survey scan, m/z 399.30, is a common fragment of GSH adducts of lipids (28), which corresponds to the loss of glutamate and water from the parent ion, m/z 546.36. The TLC-purified HDA-GSH adduct was also subjected to negative ion ESI/MS, which complements the positive ion scan. The predominant ions are the [M − H]− and [M − H + Na]− at m/z 544.66 and 566.66, respectively.
Fig. 2.
ESI/MS of TLC-purified 2-ClHDA adduct with GSH. The purity and stability of the TLC-purified reaction product from 2-ClHDA incubations with GSH (HDA-GSH) were confirmed by TLC and ninhydrin staining (A). Lanes 1 and 2 show TLC analysis of the reaction products before and after TLC purification, respectively. Purified reaction product was analyzed by positive ion (B) and negative ion (C) ESI/MS by direct infusion as described in Materials and Methods. (D) The putative molecular structure of the reaction product from 2-ClHDA and GSH reactions (HDA-GSH).
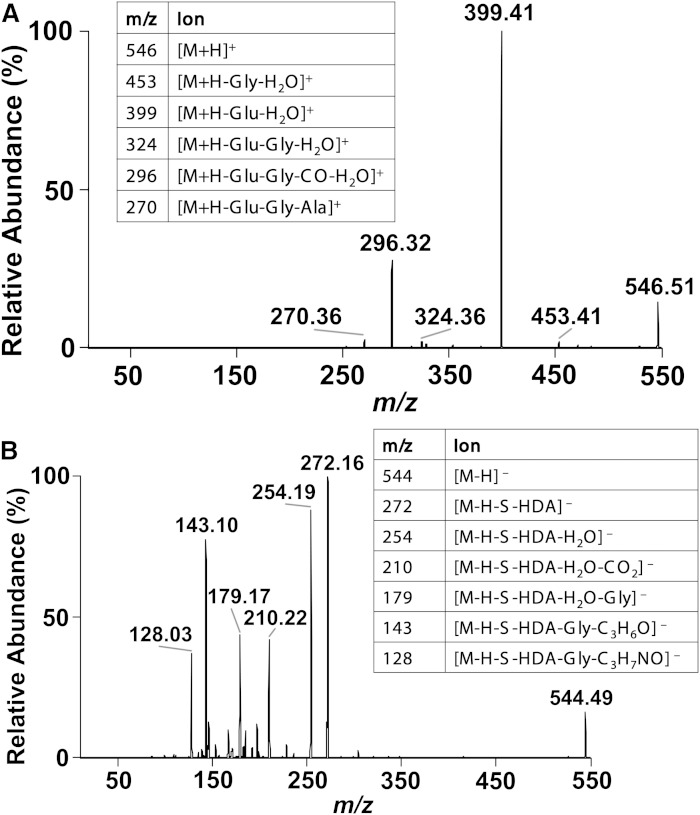
Further structural confirmation included MS/MS analyses of HDA-GSH in both positive and negative ion modes. The positive parent ion, m/z 546.36 [M + H]+, fragments into two major ions, m/z 399.41 and m/z 296.2 (Fig. 3A). The m/z 399.41 fragment ion corresponds with the loss of glutamate and water. The m/z 296.32 fragment ion is from the additional loss of both glycine moiety and the cysteine carbonyl from the m/z 399.41 fragment ion. The negative parent ion, m/z 544.66 [M − H]−, fragments into multiple ions (Fig. 3B) that directly correspond to the known fragmentation of GSH (29, 30). The predominating ion, m/z 272.16, is the cleavage of HDA-GSH at the sulfhydryl as shown in the Fig. 3B inset. Both the positive and negative ion survey scan and parent ion fragmentations support the structure proposed in Fig. 2D.
Fig. 3.
ESI/MS/MS of HDA-GSH. TLC-purified HDA-GSH was analyzed by direct infusion ESI and subjected to MS/MS analysis at 15 eV and 1.0 Torr. MS/MS spectra for the [M + H]+ parent ion at m/z 546.36 (A) and the [M − H]− parent ion at m/z 544.66 (B) are shown. Inset tables provide likely fragment ion assignments.
Characterization of DNPH-HDA-GSH
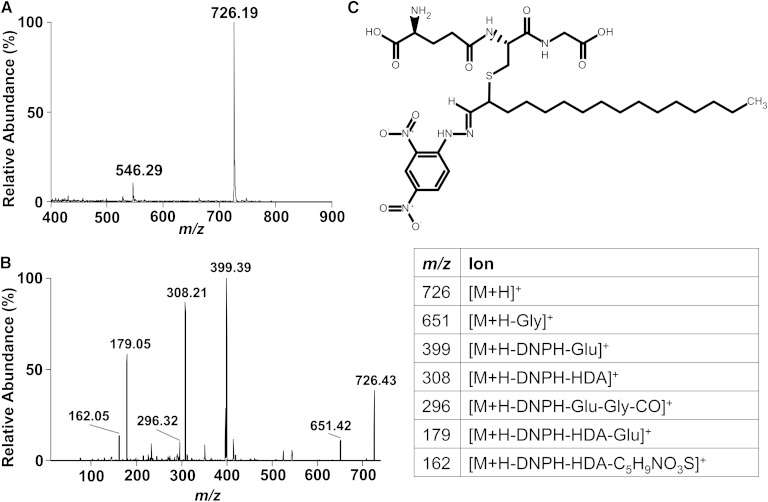
TLC-purified HDA-GSH as shown in Fig. 1C was readily stained by DNPH as HDA-GSH retains a free aldehyde. Based on this finding, the purified DNPH derivative of HDA-GSH was analyzed by ESI/MS/MS. In positive survey mode (Fig. 4A), the DNPH-HDA-GSH derivative is detected as the [M + H]+ at m/z 726.19, which is consistent with DNPH forming a hydrazone with HDA-GSH with a molecular mass of 725.34 (Fig. 4C). MS/MS of m/z 726.19 yielded fragment positive ions that were consistent with that observed with fragmentation of HDA-GSH (e.g., m/z 399.39 and 296.32) as well as new ions from GSH fragmentation (m/z 308.21, 179.05, and 162.05).
Fig. 4.
ESI/MS and MS/MS analysis of DNPH-HDA-GSH. HDA-GSH was derivatized with DNPH and analyzed by direct infusion in positive ion mode. The [M + H]+ of the derivatized product was detected, m/z 726.19 (A), which supports a hydrazone bond formation between DNPH and HDA-GSH and structure shown in C. MS/MS analysis of the [M + H]+ ion at m/z 726.19 is shown in B, and the associated table provides likely fragmentation ion assignments.
Characterization of [d4]HDA-GSH
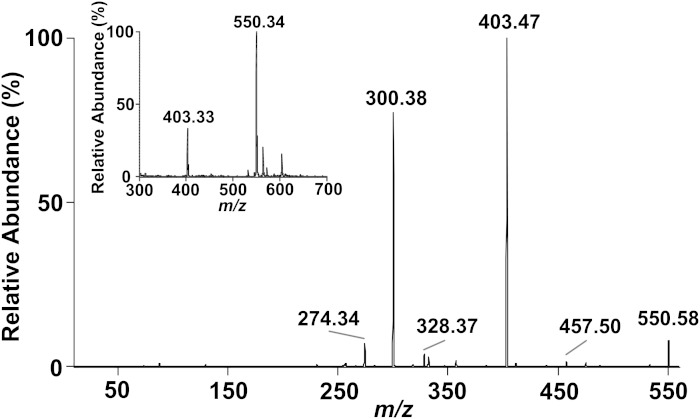
To quantitate α-ClFALD produced in primary cells forming adducts with GSH, the deuterated HDA-GSH, [d4]HDA-GSH, was synthesized. Purified [d4]HDA-GSH was weighed, and its purity and structure were verified by direct infusion ESI/MS/MS analysis. Survey scans in the positive ion mode showed that the predominant molecular ions of [d4]HDA-GSH were shifted 4 amu compared with HDA-GSH (see Fig. 2) with ions at m/z 550.34, 572.34, and 403.33 representing [M + H]+, [M + Na]+, and [M + H − glutamate − water]+, respectively (Fig. 5, inset). MS/MS analysis of m/z 550.34 from [d4]HDA-GSH showed a similar fragmentation to that of HDA-GSH (see Fig. 3A) with 4 amu shifts in the fragment ions (Fig. 5). It should be noted that this deuterated analog and the MS data further support the structure shown in Fig. 2D.
Fig. 5.
ESI/MS and MS/MS analysis of [d4]HDA-GSH. Synthetic [d4]HDA-GSH was analyzed by direct infusion in the positive ion mode with MS/MS analyses as described in Fig. 3. MS/MS analysis of the [M + H]+ ion at m/z 550.35 displays a distinct 4 amu shift compared with the HDA-GSH fragment ions. Survey mode positive ions of synthetic [d4]HDA-GSH are shown in the spectra of the inset.
Quantitation of HDA-GSH by LC-MS/MS
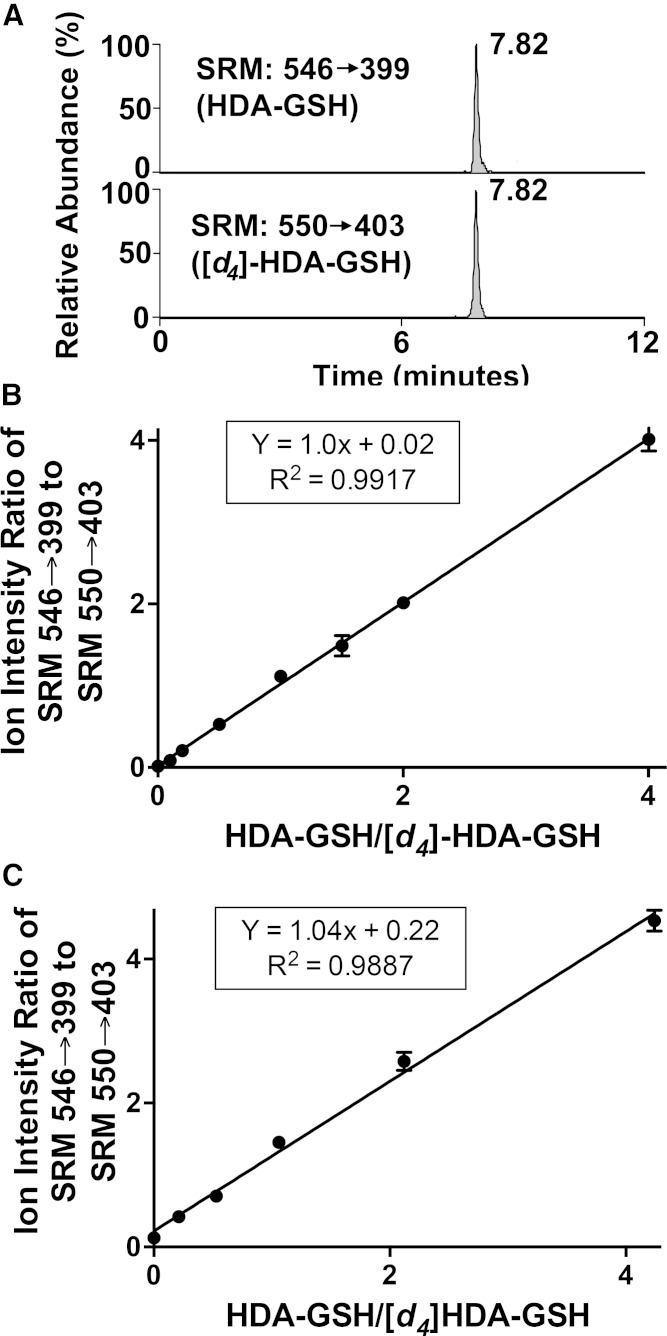
Utilizing purified natural HDA-GSH and [d4]HDA-GSH, a quantitative LC/MS/MS technique was developed. Fragmentation information was exploited to monitor HDA-GSH using SRM. The SRM of 546.34 → 399.41 and 550.34 → 403.41 were used to detect HDA-GSH and [d4]HDA-GSH, respectively. Additionally, 2-chlorooctadecanal (2-ClODA) conjugates of GSH (ODA-GSH) were detected by the SRM 574.34 → 427.41. Fig. 6A shows a chromatogram of the natural and deuterated analogs of HDA-GSH, which coelute when subjected to reverse-phase chromatography (Rt = 7.82 min). To confirm that ionization and fragmentation patterns of the deuterated product were comparable to the natural product during this LC/MS/MS analysis, natural HDA-GSH levels were varied while maintaining a constant [d4]HDA-GSH level. The response plot is shown in Fig. 6B, which demonstrates that [d4]HDA-GSH and HDA-GSH give an equal ion intensity response with a calibration line with a slope = 1. Furthermore, the calibration response was similar between natural HDA-GSH and deuterated HDA-GSH in the presence of neutrophil lysate extract in the solvent matrix (Fig. 6C). This detection method provides reliable detection of HDA-GSH at levels as low as 5 fmol.
Fig. 6.
Stable isotope dilution quantitation of HDA-GSH by LC/ESI/MS/MS. Based on the fragmentation ions shown in Figs. 3 and 4, LC/MS with SRM detection was used to quantify HDA-GSH. Using LC/MS, 15 fmol HDA-GSH and 15 fmol [d4]HDA-GSH were detected in the SRM scan mode, SRM 546 → 399 and m/z 550 → 403, respectively (as indicated in A). In triplicate, selected amounts of HDA-GSH in the presence of a fixed amount of [d4]HDA-GSH (7 fmol) were extracted in the presence (C) and absence (B) of neutrophil homogenate (not stimulated) and then were subjected to LC/MS/MS as described in Materials and Methods. For samples extracted in the presence of neutrophil homogenate, extracts were subjected to Strata-X SPE purification prior to LC/MS/MS. The peak area ratios were plotted versus the ratio of the HDA-GSH and [d4]HDA-GSH injected yielding response lines as calculated in the insets using linear regression (B, C).
HDA-GSH quantitation in chemical reactions and HDA-GSH production in RAW 264.7 cells treated with 2-ClHDA
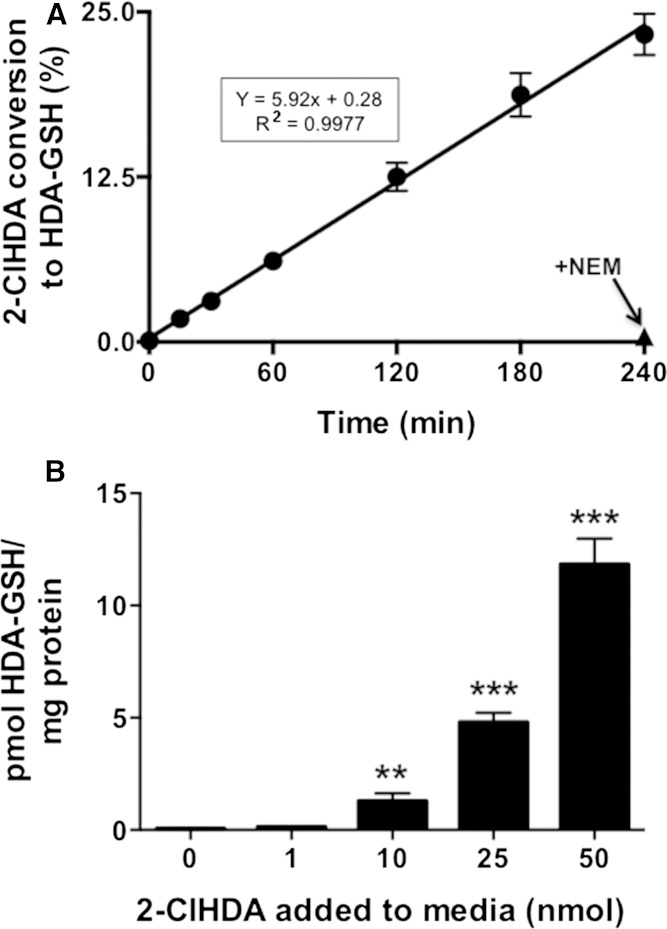
Using the LC/MS/MS method for the quantification of FALD-GSH, we tested the time-dependent incorporation of 20 μM 2-ClHDA into FALD-GSH adducts in the presence of 2 mM GSH. Under these conditions ∼6% of the 2-ClHDA precursor is converted to FALD-GSH per hour, and this rate is linear for up to 4 h (Fig. 7A). To determine whether cells are capable of producing HDA-GSH in the presence of physiological levels of 2-ClHDA, RAW 264.7 mouse macrophages were treated with 2-ClHDA for 8 h and then analyzed for HDA-GSH production. RAW 264.7 cells were chosen as they are a well-characterized macrophage cell line, but incapable of producing 2-ClHDA. To enhance sensitivity and reproducibility of detection, HDA-GSH was first purified from cell homogenate using Strata-X columns as described in the Materials and Methods. No HDA-GSH was detected in the control treatment (ethanol vehicle alone was added), while HDA-GSH levels were elevated in a precursor-dependent manner between 1 and 50 nmol 2-ClHDA (Fig. 7B).
Fig. 7.
Quantitation of HDA-GSH production in chemical reactions and in RAW 264.7 cells treated with 2-ClHDA. GSH (200 nmol) and 2-ClHDA (2 nmol) were incubated in 70% ethanol for the indicated times (A). RAW 264.7 cells were treated with indicated concentrations of 2-ClHDA for 8 h (B). [d4]HDA-GSH was added to either chemical reactions (A) or cell homogenates (B), and glutathione adducts of 2-ClHDA were purified by Strata-X SPE. HDA-GSH produced was quantified using the added [d4]HDA-GSH as internal standard following LC/ESI/MS/MS with SRM detection as described in Materials and Methods. ** P < 0.01 and *** P < 0.001 for comparisons with no 2-ClHDA added to media; n = 3 for each treatment.
HDA-GSH and ODA-GSH accumulation in PMA-stimulated neutrophils
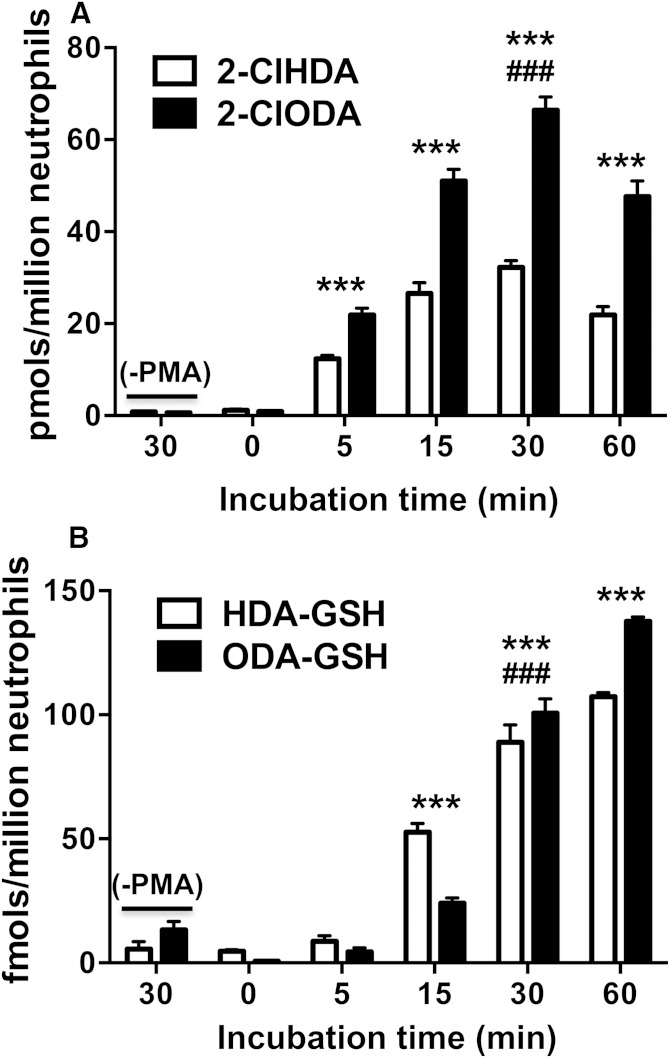
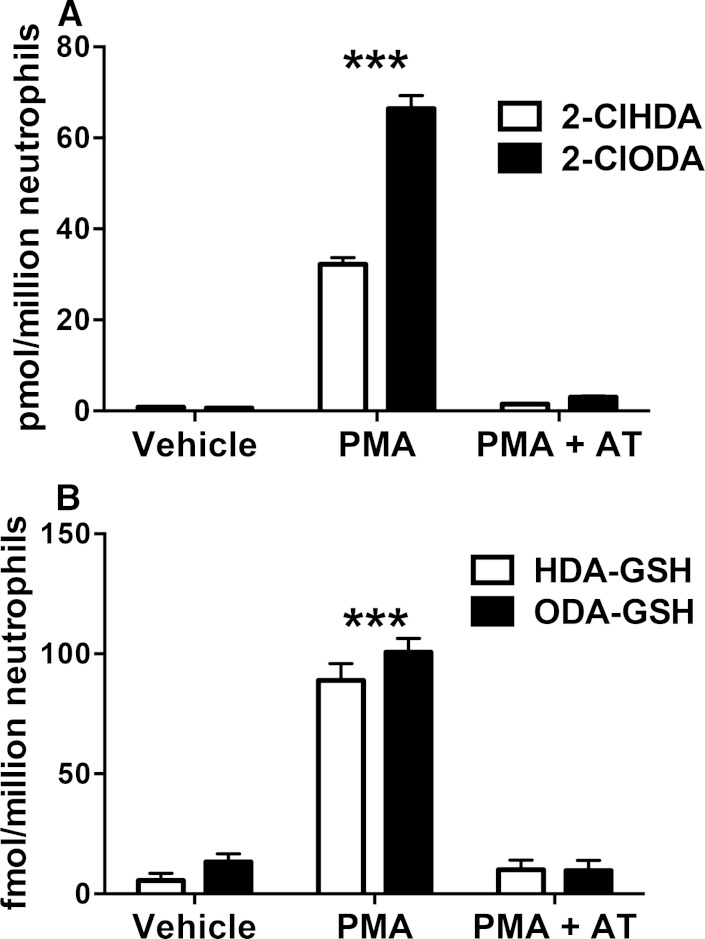
Isolated primary human neutrophils stimulated with PMA produce α-ClFALD (9) and were, therefore, assayed for the production of α-ClFALD adducts of GSH. Fig. 8A shows the time course of α-ClFALD production in neutrophils treated with 200 nM PMA. Both 2-ClHDA and 2-ClODA molecular species were elevated by 5 min, peak by 30 min, and begin to decline by 60 min. Interestingly, the production of HDA-GSH and ODA-GSH adducts do not directly mirror 2-ClHDA and 2-ClODA levels at these time points (Fig. 8B). Instead, there appears to be differential conversion of 2-ClHDA and 2-ClODA to their GSH adducts. Importantly, both 2-ClHDA and 2-ClODA levels were reduced in 200 nM PMA-treated neutrophils at 30 min that were pretreated with an inhibitor (AT) that prevents HOCl production (Fig. 9A). Likewise, HDA-GSH and ODA-GSH levels were significantly reduced in AT-pretreated, PMA-treated neutrophils (Fig. 9B). Inhibition of α-ClFALD and their GSH adducts (HDA-GSH and ODA-GSH) by AT demonstrate the dependence of HDA-GSH and ODA-GSH production on α-ClFALD and MPO activity in activated neutrophils.
Fig. 8.
Time course of α-ClFALD and FALD-GSH accumulation in PMA-activated human neutrophils. Isolated primary human neutrophils (1 × 10⁶) were incubated in the presence and absence of 200 nM PMA at 37°C for indicated time intervals. 2-ClHDA and 2-ClODA (A) as well as HDA-GSH and ODA-GSH (B) were quantitated by GC/MS and LC/MS/MS, respectively, as described in Materials and Methods. n = 3 for each treatment. *** P < 0.001 for comparisons of each FALD-GSH molecular species at indicated time points compared to those at t = 0. ### P < 0.001 for comparisons of each FALD-GSH molecular species following 30 min incubations in the presence and absence of PMA.
Fig. 9.
AT inhibition of α-ClFALD and FALD-GSH adduct production in human neutrophils. Isolated primary human neutrophils (1 × 10⁶) were incubated in the presence and absence of 200 nM PMA as well as the presence and absence of AT at 37°C for 30 min. 2-ClHDA and 2-ClODA (A) as well as HDA-GSH and ODA-GSH (B) were quantitated by GC/MS and LC/MS/MS, respectively, as described in Materials and Methods. n = 3 for each treatment. *** P < 0.001 for both molecular species when compared with the same molecular species in either vehicle control or PMA + AT as assessed by ANOVA with Tukey’s post hoc test.
Elevations in plasma α-ClFA and FALD-GSH in K/BxN mice
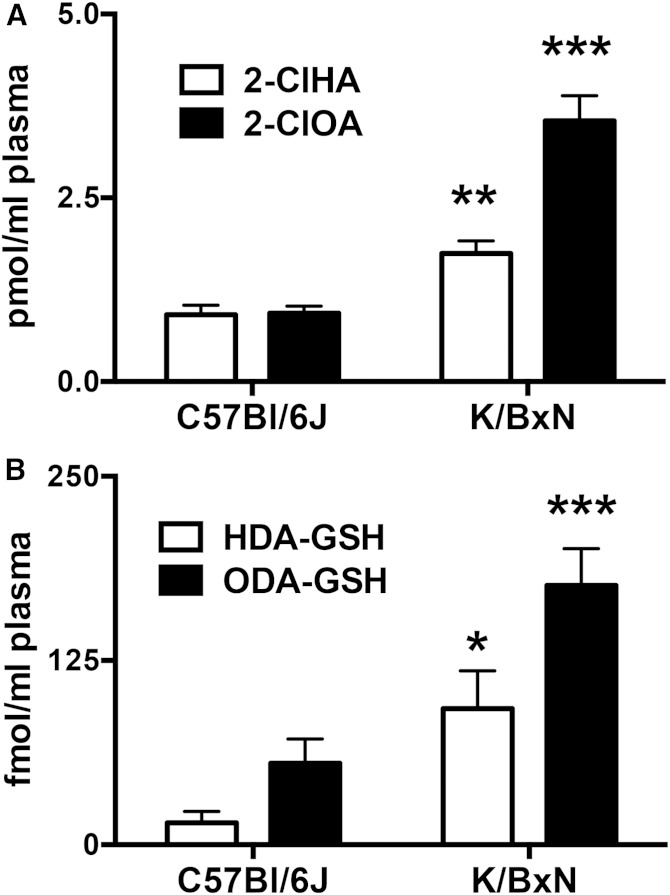
The K/BxN mouse model of arthritis is mediated in part by neutrophil activation (27, 31). Accordingly, we examined whether FALD-GSH is elevated in the plasma of these mice compared with age-matched C57Bl/6J mice. The α-ClFA molecular species 2-chlorohexadecanoic acid (2-ClHA) and 2-chlorooctadecanoic acid (2-ClOA) are elevated in the plasma of K/BxN mice (Fig. 10A). 2-ClHA and 2-ClOA are the oxidation products of 2-ClHDA and 2-ClODA (17, 18). Furthermore, the GSH adducts of 2-ClHDA and 2-ClODA, HDA-GSH and ODA-GSH, are elevated in the plasma of K/BxN mice (Fig. 10B).
Fig. 10.
Plasma levels of FALD-GSH and α-ClFA are elevated in the K/BxN murine model of arthritis. 2-ClHA and 2-ClOA (A) as well as HDA-GSH and ODA-GSH (B) were quantitated from mouse plasma by LC/MS/MS as described in Materials and Methods. n = 3 for each treatment. ** P < 0.01 and *** P < 0.001 for comparisons between C57Bl/6J and K/BxN mice of each indicated analyte.
DISCUSSION
α-ClFALD production in MPO-containing phagocytes and during inflammatory processes has previously been described (9–12). However, the mechanisms underlying the biological properties and metabolism of α-ClFALD are not completely known. The present study reveals for the first time the production of a novel class of peptidoaldehydes resulting from α-ClFALD being targeted by GSH nucleophilic attack. We predicted that the α-chlorinated carbon of α-ClFALD would be reactive with the GSH sulfhydryl group. Indeed, a unique reaction product was found as a result of treating α-ClFALD with GSH. The attack on this fatty aldehyde was dependent on the presence of the α-chlorinated carbon because nonchlorinated HDA did not react with GSH. Furthermore, the reaction product from the treatment of 2-ClHDA with GSH retained a free aldehyde as well as amine groups as demonstrated by DPNH and ninhydrin staining of TLC-purified reaction products, respectively (Fig. 1). These findings also supported the structure of the adduct shown in Fig. 2D, which would be produced from GSH attack of the α-chlorinated carbon accompanied by chlorine ejection. This structure was further supported by the following: 1) positive and negative ion MS/MS of the 2-ClHDA-GSH adduct product, 2) MS/MS in the positive ion mode of the DNPH hydrazone derivative of the 2-ClHDA-GSH adduct product, 3) analogous survey mode and MS/MS mode molecular ions with a 4 amu shift of the 2-ClHDA-GSH adduct containing 4 deuteriums, and 4) the absence of a chlorine signature ion in the adduct product (e.g., M and M + 2 ions at a 3 to 1 ratio due to the natural abundance of 35Cl and 37Cl were not observed).
MS/MS analyses of HDA-GSH and [d4]HDA-GSH revealed the common loss of glutamate and water yielding the robust fragment ions m/z 399 and m/z 403, respectively, These fragment ions were used for both SRM detection of HDA-GSH and [d4]HDA-GSH and method development to quantify FALD-GSH species in biological samples sequentially subjected to SPE and LC/MS/MS. Response calibration lines comparing ion response of HDA-GSH and [d4]HDA-GSH in the presence and absence of biological matrix (extracted neutrophil lysate) had slopes of 1 demonstrating equal ion intensity response of the natural and deuterated HDA-GSH. It is also likely, and assumed, that ODA-GSH will have a similar response compared with [d4]HDA-GSH because the ionization of the precursor and product is dependent on the protonated amine groups of the peptide component of the parent ion and product ion. Utilizing this method, the production of HDA-GSH in RAW 264.7 mouse macrophage cells treated with 2-ClHDA was examined. Under these conditions, HDA-GSH increased in a concentration-dependent manner in the presence of physiological amounts of 2-ClHDA (9, 10). RAW 264.7 cells produce very minimal MPO activity without prolonged stimulation (32), and therefore, it is unlikely that endogenous 2-ClHDA contributed to HDA-GSH production. The LC/MS/MS method was finally used to show that human neutrophils stimulated with PMA produce HDA-GSH and ODA-GSH from endogenously produced α-ClFALD. The dependence of HDA-GSH and ODA-GSH production on MPO activity in activated neutrophils was confirmed by the ability of the heme enzyme inhibitor, AT (33), to ablate the accumulation of both α-ClFALD and FALD-GSH molecular species in PMA-stimulated neutrophils.
Previous studies have examined the metabolism of α-ClFALD produced in PMA-stimulated neutrophils to α-ClFA and α-ClFOH (17, 18). In those studies, both α-ClFA and α-ClFOH were elevated 15 min following PMA stimulation, although α-ClFALD was elevated as early as 5 min. Similar to α-ClFA and α-ClFOH production, HDA-GSH and ODA-GSH are elevated at 15 min, which collectively suggest that α-ClFALD is cleared by either oxidation (α-ClFA), reduction (α-ClFOH), or nucleophilic attack by GSH. Interestingly, relative levels of HDA-GSH and ODA-GSH did not mirror relative levels of 2-ClHDA and 2-ClODA throughout 60 min of PMA stimulation. HDA-GSH levels were significantly higher than ODA-GSH at 15 min, HDA-GSH and ODA-GSH levels were similar at 30 min, and ODA-GSH was elevated over HDA-GSH at 60 min. In comparison with this changing relative amount of the FALD-GSH species, the relative amounts of 2-ClHDA and 2-ClODA remain the same throughout stimulation with more 2-ClODA present at all time points examined. These findings might be explained by GSH having disparate accessibility to 2-ClHDA and 2-ClODA over time following PMA stimulation. Although GSH can chemically target α-ClFALD in neutrophils, it is also possible that adducts are formed by glutathione S-transferase activity (21, 22), and it is possible that either glutathione S-transferase or GSH used by glutathione S-transferase has disparate accessibility or molecular species preference in forming FALD-GSH molecular species over the time course of PMA stimulation (e.g., 60 min). It should also be noted that neutrophil GSH levels change over the time course of PMA stimulation due to the robust production of oxidants during neutrophil stimulation. It has been reported in human neutrophils that GSH levels decrease from 1.3 to 0.65 nmol per million neutrophils in response to 80 min of PMA stimulation (34). GSH is a target for HOCl during neutrophil activation (34, 35), and this may limit FALD-GSH formation in activated neutrophils. However, it should be appreciated that even with GSH reduced due to neutrophil activation, GSH levels exceed that of the maximal levels of α-ClFALD (e.g., ∼0.1 nmol α-ClFALD per million neutrophils following 30 min of PMA stimulation). It will be interesting in future studies to examine adduct formation from neutrophil-produced α-ClFALD by neighboring cells such as endothelial cells that are spared, or have minimal exposure to, neutrophil-derived HOCl. Additionally, in vivo studies with the K/BxN mouse show elevated plasma levels of both FALD-GSH and α-ClFA compared with C57Bl/6J mice. At the time (9 weeks) that plasma was collected, K/BxN mice display a previously described arthritic phenotype with joint swelling in all four paws, and one of the major mediators of this injury is through neutrophil activation (27, 31). These data are the first to show elevated chlorinated lipids derived from plasmalogen oxidation as well as elevations in the newly discovered FALD-GSH adducts in this arthritis model.
There are similarities in structure between FALD-GSH and leukotriene C4 (LTC4), with each containing GSH coupled to a lipid oxidation product. It is possible that FALD-GSH is metabolized by pathways similar to those previously characterized for cysteinyl leukotrienes including LTC4 transport out of cells, extracellular removal of the glutamate residue by γ-glutamyl transferase to yield leukotriene D4, dipeptidase activity resulting in leukotriene E4 (LTE4) production, and N-acetylation of LTE4 (22). Data herein show the FALD-GSH level produced by activated neutrophils is ∼250 fmol per million cells, and it is possible that this level is higher in either neighboring cells that are exposed to α-ClFALD or in neutrophils at longer postactivation times. In comparison, LTC4 levels in A23187-activated neutrophils ranges from ∼50 to 700 fmol per million cells (36, 37). Taken together, FALD-GSH and LTC4 levels are likely produced at sites of neutrophil activation at levels within an order of magnitude of each other. In addition to identifying potential parallel metabolic pathways of FALD-GSH and peptidoleukotrienes, it will also be important in future studies to examine the biological properties of FALD-GSH and the potential interactions FALD-GSH may have with peptidoleukotrienes.
The precursors of MPO-derived chlorinated lipids are plasmalogens, and the initial chlorinated lipids produced are α-ClFALD. Although α-ClFALD accumulates in activated neutrophils, activated monocytes, human aortic atherosclerotic plaques, and infarcted rat myocardium (9–12), the role of this lipid as a lipid mediator is not fully understood due to its metabolism and chemical reactivity. Results herein provide new insights into the fates and potential mediators of α-ClFALD produced as a result of MPO activity by demonstrating that α-ClFALD is targeted by the nucleophile GSH. Several functions have been attributed to α-ClFALD, and it now seems possible that some of these biological functions might be attributed to peptidoaldehyde FALD-GSH production in target cells.
Footnotes
Abbreviations:
- 2-Br-[d4]HDA
- 2-bromo-[7,7,8,8-d4]hexadecanal
- 2-ClHA
- 2-chlorohexadecanoic acid
- 2-ClHDA
- 2-chlorohexadecanal
- 2-ClOA
- 2-chlorooctadecanoic acid
- 2-ClODA
- 2-chlorooctadecanal
- α-ClFA
- α-chlorofatty acid
- α-ClFALD
- α-chlorofatty aldehyde
- α-ClFOH
- α-chlorofatty alcohol
- AT
- 3-aminotriazole
- DNPH
- 2,4-dinitrophenylhydrazine
- FALD-GSH
- α-ClFALD conjugates of GSH
- HDA
- hexadecanal
- HDA-GSH
- 2-ClHDA conjugates of GSH
- LTC4
- leukotriene C4
- MPO
- myeloperoxidase
- NEM
- N-ethylmaleimide
- ODA-GSH
- 2-ClODA conjugates of GSH
- SPE
- solid-phase extraction
- SRM
- selected reaction monitoring
This work was supported in part by the National Institutes of Health Grants HL074214 (D.A.F.) and AR064821 (R.A.), and by Predoctoral Fellowship Grant 14PRE20380048 (M.A.D.) from the American Heart Association.
REFERENCES
- 1.Harrison J. E., Schultz J. 1976. Studies on the chlorinating activity of myeloperoxidase. J. Biol. Chem. 251: 1371–1374. [PubMed] [Google Scholar]
- 2.Lampert M. B., Weiss S. J. 1983. The chlorinating potential of the human monocyte. Blood. 62: 645–651. [PubMed] [Google Scholar]
- 3.Albert C. J., Crowley J. R., Hsu F. F., Thukkani A. K., Ford D. A. 2001. Reactive chlorinating species produced by myeloperoxidase target the vinyl ether bond of plasmalogens: identification of 2-chlorohexadecanal. J. Biol. Chem. 276: 23733–23741. [DOI] [PubMed] [Google Scholar]
- 4.Chilton F. H., Connell T. R. 1988. 1-ether-linked phosphoglycerides. Major endogenous sources of arachidonate in the human neutrophil. J. Biol. Chem. 263: 5260–5265. [PubMed] [Google Scholar]
- 5.Rüstow B., Kolleck I., Guthmann F., Haupt R., Kunze D., Stevens P. 1994. Synthesis and secretion of plasmalogens by type-II pneumocytes. Biochem. J. 302: 665–668. [DOI] [PMC free article] [PubMed] [Google Scholar]
- 6.Dorman R. V., Dreyfus H., Freysz L., Horrocks L. A. 1976. Ether lipid content of phosphoglycerides from the retina and brain of chicken and calf. Biochim. Biophys. Acta. 486: 55–59. [DOI] [PubMed] [Google Scholar]
- 7.Murphy E. J., Joseph L., Stephens R., Horrocks L. A. 1992. Phospholipid composition of cultured human endothelial cells. Lipids. 27: 150–153. [DOI] [PubMed] [Google Scholar]
- 8.Gross R. W. 1984. High plasmalogen and arachidonic acid content of canine myocardial sarcolemma: a fast atom bombardment mass spectroscopic and gas chromatography-mass spectroscopic characterization. Biochemistry. 23: 158–165. [DOI] [PubMed] [Google Scholar]
- 9.Thukkani A. K., Hsu F. F., Crowley J. R., Wysolmerski R. B., Albert C. J., Ford D. A. 2002. Reactive chlorinating species produced during neutrophil activation target tissue plasmalogens: production of the chemoattractant, 2-chlorohexadecanal. J. Biol. Chem. 277: 3842–3849. [DOI] [PubMed] [Google Scholar]
- 10.Thukkani A. K., Albert C. J., Wildsmith K. R., Messner M. C., Martinson B. D., Hsu F. F., Ford D. A. 2003. Myeloperoxidase-derived reactive chlorinating species from human monocytes target plasmalogens in low density lipoprotein. J. Biol. Chem. 278: 36365–36372. [DOI] [PubMed] [Google Scholar]
- 11.Thukkani A. K., McHowat J., Hsu F. F., Brennan M. L., Hazen S. L., Ford D. A. 2003. Identification of alpha-chloro fatty aldehydes and unsaturated lysophosphatidylcholine molecular species in human atherosclerotic lesions. Circulation. 108: 3128–3133. [DOI] [PubMed] [Google Scholar]
- 12.Thukkani A. K., Martinson B. D., Albert C. J., Vogler G. A., Ford D. A. 2005. Neutrophil-mediated accumulation of 2-ClHDA during myocardial infarction: 2-ClHDA-mediated myocardial injury. Am. J. Physiol. Heart Circ. Physiol. 288: H2955–H2964. [DOI] [PubMed] [Google Scholar]
- 13.Ullen A., Fauler G., Bernhart E., Nusshold C., Reicher H., Leis H-J., Malle E., Sattler W. 2012. Phloretin ameliorates 2-chlorohexadecanal-mediated brain microvascular endothelial cell dysfunction in vitro. Free Radic. Biol. Med. 53: 1770–1781. [DOI] [PMC free article] [PubMed] [Google Scholar]
- 14.Nusshold C., Kollroser M., Kofeler H., Rechberger G., Reicher H., Ullen A., Bernhart E., Waltl S., Kratzer I., Hermetter A., et al. 2010. Hypochlorite modification of sphingomyelin generates chlorinated lipid species that induce apoptosis and proteome alterations in dopaminergic PC12 neurons in vitro. Free Radic. Biol. Med. 48: 1588–1600. [DOI] [PMC free article] [PubMed] [Google Scholar]
- 15.Marsche G., Heller R., Fauler G., Kovacevic A., Nuszkowski A., Graier W., Sattler W., Malle E. 2004. 2-chlorohexadecanal derived from hypochlorite-modified high-density lipoprotein-associated plasmalogen is a natural inhibitor of endothelial nitric oxide biosynthesis. Arterioscler. Thromb. Vasc. Biol. 24: 2302–2306. [DOI] [PubMed] [Google Scholar]
- 16.Messner M. C., Albert C. J., Ford D. A. 2008. 2-chlorohexadecanal and 2-chlorohexadecanoic acid induce COX-2 expression in human coronary artery endothelial cells. Lipids. 43: 581–588. [DOI] [PMC free article] [PubMed] [Google Scholar]
- 17.Wildsmith K. R., Albert C. J., Anbukumar D. S., Ford D. A. 2006. Metabolism of myeloperoxidase-derived 2-chlorohexadecanal. J. Biol. Chem. 281: 16849–16860. [DOI] [PubMed] [Google Scholar]
- 18.Anbukumar D. S., Shornick L. P., Albert C. J., Steward M. M., Zoeller R. A., Neumann W. L., Ford D. A. 2010. Chlorinated lipid species in activated human neutrophils: Lipid metabolites of 2-chlorohexadecanal. J. Lipid Res. 51: 1085–1092. [DOI] [PMC free article] [PubMed] [Google Scholar]
- 19.Wang W. Y., Albert C. J., Ford D. A. 2014. Alpha-chlorofatty acid accumulates in activated monocytes and causes apoptosis through reactive oxygen species production and endoplasmic reticulum stress. Arterioscler. Thromb. Vasc. Biol. 34: 526–532. [DOI] [PMC free article] [PubMed] [Google Scholar]
- 20.Wildsmith K. R., Albert C. J., Hsu F. F., Kao J. L-F., Ford D. A. 2006. Myeloperoxidase-derived 2-chlorohexadecanal forms Schiff bases with primary amines of ethanolamine glycerophospholipids and lysine. Chem. Phys. Lipids. 139: 157–170. [DOI] [PubMed] [Google Scholar]
- 21.Blair I. A. 2006. Endogenous glutathione adducts. Curr. Drug Metab. 7: 853–872. [DOI] [PubMed] [Google Scholar]
- 22.Murphy R. C., Gijon M. A. 2007. Biosynthesis and metabolism of leukotrienes. Biochem. J. 405: 379–395. [DOI] [PubMed] [Google Scholar]
- 23.Cooper A. J. L., Hanigan M. H. 2010. Enzymes involved in processing glutathione conjugates. In Comprehensive Toxicology. 2nd edition. Vol. 4. C. A. McQueen, editor. Elsevier, Oxford, UK. 323–366. [Google Scholar]
- 24.Albert C. J., Crowley J. R., Hsu F. F., Thukkani A. K., Ford D. A. 2002. Reactive brominating species produced by myeloperoxidase target the vinyl ether bond of plasmalogens: disparate utilization of sodium halides in the production of alpha-halo fatty aldehydes. J. Biol. Chem. 277: 4694–4703. [DOI] [PubMed] [Google Scholar]
- 25.Bligh E. G., Dyer W. J. 1959. A rapid method of total lipid extraction and purification. Can. J. Biochem. Physiol. 37: 911–917. [DOI] [PubMed] [Google Scholar]
- 26.Wacker B. K., Albert C. J., Ford B. A., Ford D. A. 2013. Strategies for the analysis of chlorinated lipids in biological systems. Free Radic. Biol. Med. 59: 92–99. [DOI] [PMC free article] [PubMed] [Google Scholar]
- 27.Monach P. A., Mathis D., Benoist C. 2008. The K/BxN arthritis model. Curr. Protoc. Immunol. 81: 15.22.1–15.22.12. [DOI] [PubMed] [Google Scholar]
- 28.Hevko J. M., Murphy R. C. 2001. Electrospray ionization and tandem mass spectrometry of cysteinyl eicosanoids: leukotriene C4 and fog7. J. Am. Soc. Mass Spectrom. 12: 763–771. [DOI] [PubMed] [Google Scholar]
- 29.Xie C., Zhong D., Chen X. 2013. A fragmentation-based method for the differentiation of glutathione conjugates by high-resolution mass spectrometry with electrospray ionization. Anal. Chim. Acta. 788: 89–98. [DOI] [PubMed] [Google Scholar]
- 30.Baillie T. A., Davis M. R. 1993. Mass spectrometry in the analysis of glutathione conjugates. Biol. Mass Spectrom. 22: 319–325. [DOI] [PubMed] [Google Scholar]
- 31.Wipke B. T., Allen P. M. 2001. Essential role of neutrophils in the initiation and progression of a murine model of rheumatoid arthritis. J. Immunol. 167: 1601–1608. [DOI] [PubMed] [Google Scholar]
- 32.Gomez-Mejiba S. E., Zhai Z., Gimenez M. S., Ashby M. T., Chilakapati J., Kitchin K., Mason R. P., Ramirez D. C. 2010. Myeloperoxidase-induced genomic DNA-centered radicals. J. Biol. Chem. 285: 20062–20071. [DOI] [PMC free article] [PubMed] [Google Scholar]
- 33.Nauseef W. M., Metcalf J. A., Root R. K. 1983. Role of myeloperoxidase in the respiratory burst of human neutrophils. Blood. 61: 483–492. [PubMed] [Google Scholar]
- 34.Bilzer M., Lauterburg B. H. 1991. Glutathione metabolism in activated human neutrophils: stimulation of glutathione synthesis and consumption of glutathione by reactive oxygen species. Eur. J. Clin. Invest. 21: 316–322. [DOI] [PubMed] [Google Scholar]
- 35.Carr A. C., Winterbourn C. C. 1997. Oxidation of neutrophil glutathione and protein thiols by myeloperoxidase-derived hypochlorous acid. Biochem. J. 327: 275–281. [DOI] [PMC free article] [PubMed] [Google Scholar]
- 36.Farias S. E., Zarini S., Precht T., Murphy R. C., Heidenreich K. A. 2007. Transcellular biosynthesis of cysteinyl leukotrienes in rat neuronal and glial cells. J. Neurochem. 103: 1310–1318. [DOI] [PubMed] [Google Scholar]
- 37.Gijón M. A., Zarini S., Murphy R. C. 2007. Biosynthesis of eicosanoids and transcellular metabolism of leukotrienes in murine bone marrow cells. J. Lipid Res. 48: 716–725. [DOI] [PubMed] [Google Scholar]


