Abstract
Enhancers regulate spatiotemporal gene expression and impart cell-specific transcriptional outputs that drive cell identity1. Stretch- or super-enhancers (SEs) are a subset of enhancers especially important for genes associated with cell identity and genetic risk of disease2,3,4,5,6. CD4+ T cells are critical for host defense and autoimmunity. Herein, we analyzed maps of T cell SEs as a non-biased means of identifying key regulatory nodes involved in cell specification. We found that cytokines and cytokine receptors were the dominant class of genes exhibiting SE architecture in T cells. This notwithstanding, the locus encoding Bach2, a key negative regulator of effector differentiation, emerged as the most prominent T cell SE, revealing a network wherein SE-associated genes critical for T cell biology are repressed by BACH2. Disease-associated SNPs for immune-mediated disorders, including rheumatoid arthritis (RA), were highly enriched for T cell-SEs versus typical enhancers (TEs) or SEs in other cell lineages7. Intriguingly, treatment of T cells with the Janus kinase (JAK) inhibitor, tofacitinib, disproportionately altered the expression of RA risk genes with SE structures. Together, these results indicate that genes with SE architecture in T cells encompass a variety of cytokines and cytokine receptors but are controlled by a “guardian” transcription factor, itself endowed with an SE. Thus, enumeration of SEs allows unbiased determination of key regulatory nodes in T cells, which are preferentially modulated by pharmacological intervention.
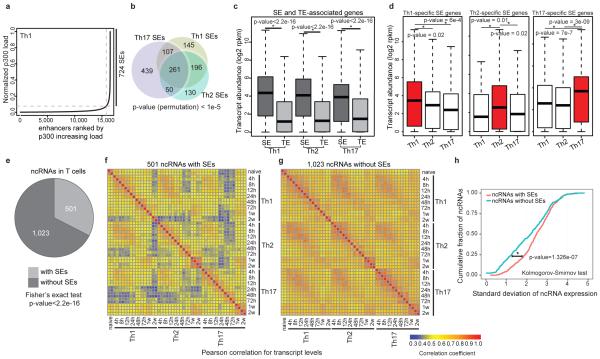
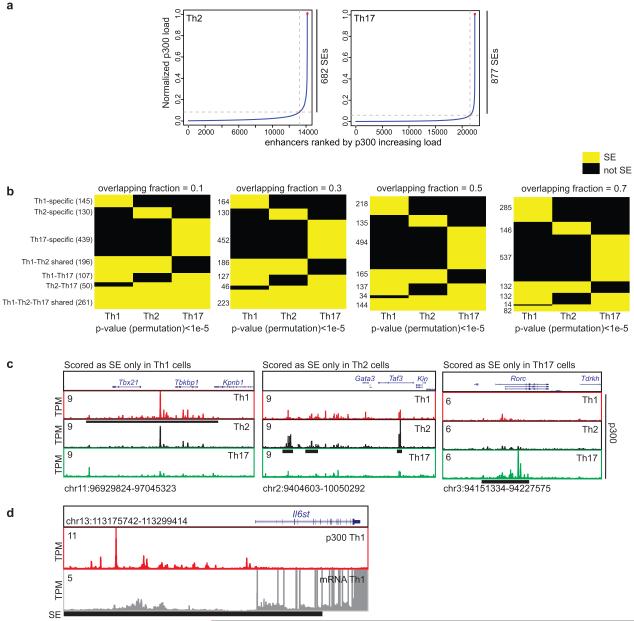
Histone acetyltransferase p300 loading demarcates regions of the genome bearing SE architecture2,8. Using chromatin immunopreciptiation followed by sequencing (ChIP-seq) for p300 protein, we constructed SE catalogues of murine CD4+ T helper (Th)1, Th2, and Th17 cells. As predicted2, the p300 load is exponentially distributed throughout the genome (Fig. 1a, Extended Data Fig. 1a). Approximately, 40% of the p300 signal was found in a small fraction of p300-loaded enhancers in each lineage. The distribution of SEs was lineage-specific even in these closely related cells (Fig. 1b, Extended Data Fig. 1b). Regulatory regions of lineage-specific master transcription factors were endowed with SEs only in the relevant lineage (Extended Data Fig. 1c). We addressed the relationship between SEs and transcriptional activity in T cells by assigning SEs to associated genes using proximity measures4 bearing in mind that alternative methods can conclusively establish such associations6,9. We found that SE architecture conferred significantly higher transcriptional activity compared to typical-enhancer (TE) architecture and this transcriptional activity was lineage-specific (Fig. 1c,d).
Figure 1. SE Structure Predicts Lineage and Stage-Specific Transcription.
(a) Histone acetyltransferase p300 is distributed asymmetrically across the genome in CD4+ T cells with a subset of enhancers (SEs) containing exceptionally high amounts of p300 binding (Table S1).
(b) Closely related CD4+ T cell populations have distinctive SE landscapes. Venn diagram depicts shared and unique SE domains in T cell subsets.
(c) SE-associated genes are highly transcribed compared to typical-enhancer (TE)-associated genes. Proximity measures were used to assign SEs and TEs to their target genes (P-values Wilcoxon rank-sum test).
(d) Presence of lineage-specific SEs predicts cell-selective expression. Three groups of genes associated to unique SE structure in each lineage were defined as Th1, Th2, and Th17-specific SE genes. The expression of lineage-specific SE-associated genes was more significant in the corresponding lineage (P-values Wilcoxon rank-sum test).
(e) SE domains are themselves transcribed in CD4+ T cells. The list of ncRNAs was derived from the map of intergenic transcripts in T cell subsets11. One-third of ncRNAs in T cells, (501/1,524), were transcribed from an SE.
(f-h) The SE structure differentiates highly lineage-specific and dynamic noncoding transcripts from constitutively expressed transcripts across T cell lineages. Pearson correlation coefficients for transcription levels between each pair of differentiation stages were calculated for 501 ncRNAs with SEs (f) and 1,023 ncRNAs without SEs (g). (h) ncRNA transcripts with SEs have larger standard deviation (s.d.) across differentiation stages compared to those without SEs.
Widespread transcription at SEs themselves has been reported in embryonic stem cells and myogenic cells2,10. We next explored the extent to which SE domains were transcribed in T cells by employing high-resolution temporal expression maps of intergenic noncoding RNAs (ncRNAs)11. One-third of the ncRNAs expressed in T cells, (501/1524), were transcribed from an SE10 (Fig. 1e, Extended Data Fig. 1d). Controlling for difference in the size of SEs and TEs, we found 80 ncRNAs per 10 MB of SEs compared to 51 transcripts within TEs. The presence of an SE structure also distinguished highly lineage-specific and dynamic ncRNAs from constitutively expressed ones (Fig. 1f-h).
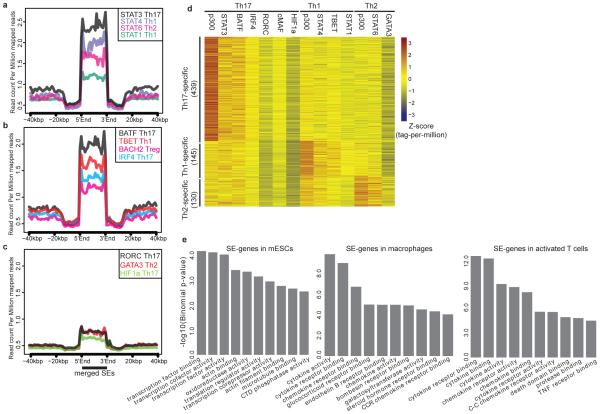
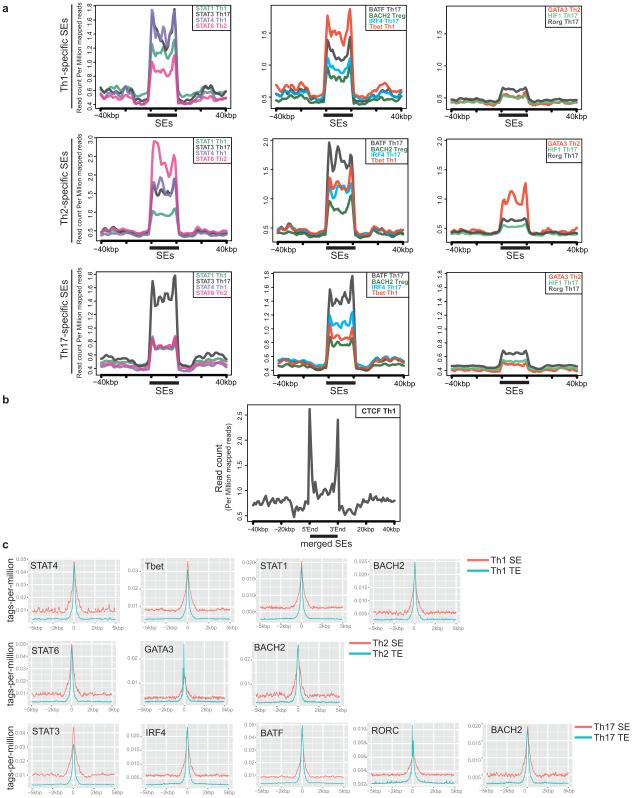
To elucidate the potential role of SEs in T cell biology, we employed ChIP-seq datasets to catalogue binding profiles of 13 transcription factors (TFs) with major roles in T helper cell differentiation across the merged map of SEs12,13,14,15 (Fig. 2a-c). As in ES cells2, STATs prominently bound SEs in CD4+ T cells (Fig. 2a, d). Similarly, BATF, IRF4, and BACH2 were enriched at these regions (Fig. 2b, d). Lineage-specific transcription factors such as T-BET, GATA3, and RORγt showed preferential binding at lineage-specific SEs (Extended Data Fig. 2a). CTCF, an essential genome organizer, appeared to preferentially demarcate SE boundaries6 (Extended Data Fig. 2b). Comparison of the enrichment of TFs at SEs and TEs revealed selective binding of STAT3 at SEs while other TFs demonstrated comparable binding at SEs and TEs (Extended Data Fig. 2c).
Figure 2. Transcription Factors with Major Roles in T Helper Cell Differentiation Occupy SEs.
(a-c) Lineage-predicting transcription factors are enriched at SE domains. The catalogue of SEs in CD4+ T cells was constructed by merging Th1, Th2, and Th17 SEs. Binding patterns of STAT1, STAT3, STAT4 and STAT6 (a), BATF, T-BET, BACH2 and IRF4 (b), and HIF1a, RORγt, and GATA3 (c) are demonstrated at SEs.
(d) Binding of lineage-specific transcription factors correlates with the presence of lineage-specific SEs in T cells (log2 tags-per-million) (Table S2).
(e) Gene ontology (GO) functional categories relevant to cytokines and cytokine receptors are enriched at SE-associated genes in T cells. GO analysis for SE regions was performed using GREAT24 .
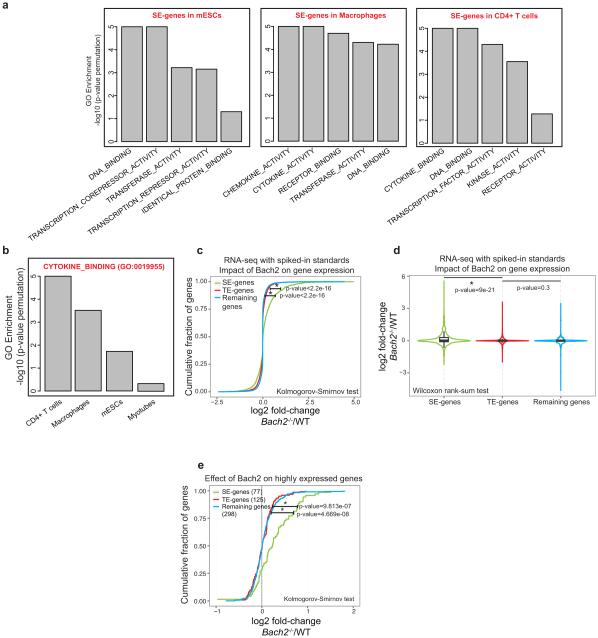
We next compared the identity of SE-associated genes in T cells with those in other cell lineages. In embryonic stem cells (ES), SE structures primarily encompass TFs (Fig. 2e and Extended Data Fig. 3a). In macrophages, chemokine and cytokine activity were the most prominent categories. Instead, in T lymphocytes genes relevant to cytokine biology were preferentially linked to SEs. Moreover, cytokine-related genes were not linked to SEs in non-immune related cells such as myotubes (Extended Data Fig. 3b). Thus, SEs are preferentially associated with genes playing a central role in the biology of specific cell lineages rather than a given class of genes (i.e., TFs). In the case of T cells, SEs project an interactive network reflecting the interactions of lymphocytes, their products and their mode of sensing the inflammatory environment.
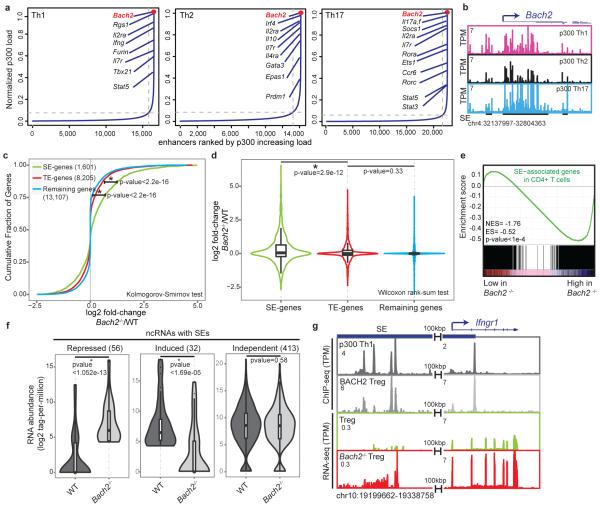
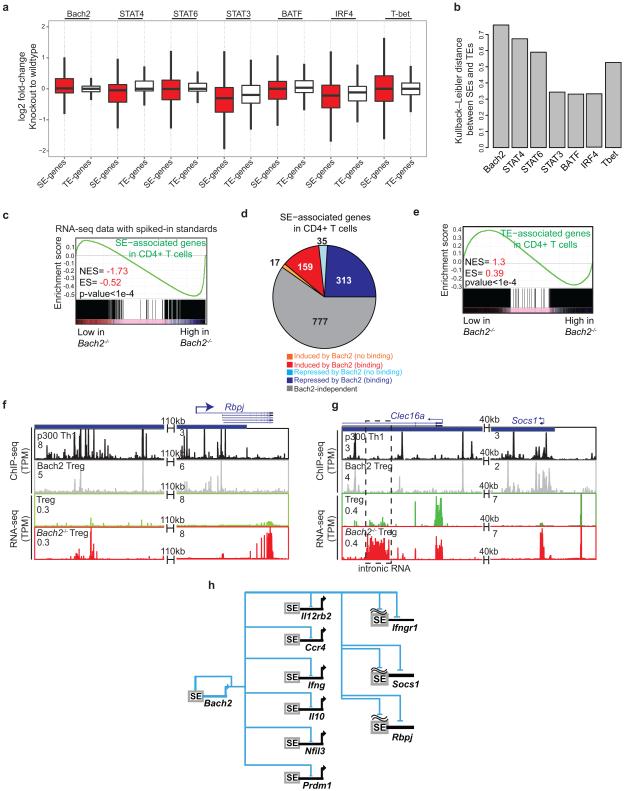
We next ranked T cell SEs based on p300 occupancy (Fig. 3a). Again, SEs with the highest p300 occupancy were typically associated with genes encoding cytokines and their receptors. However, the greatest p300 enrichment was associated with the Bach2 locus, regardless of lineage subset (Fig. 3a-b). This is of interest since BACH2 is a broad regulator of immune activation that acts by stabilizing immunoregulatory capacity and attenuating effector differentiation13. Notably, genetic variations within this locus are associated with numerous immune-mediated diseases including RA16, Crohn’s disease17, multiple sclerosis18, asthma19 and type 1 diabetes (T1D)20. These observations prompted us to investigate the effect of Bach2 deletion on the expression of SE-associated genes in T cells. Transcriptional profiling revealed that Bach2 deficiency significantly affected the expression of genes with SE architecture compared to those with TEs or no enhancer mark in T cells (Fig. 3c-d). These findings were confirmed when we employed synthetic RNA standards ”spiked-in” to rigorously normalize transcriptome data in wildtype and Bach2-deficient cells21 (Methods, Extended Data Fig. 3c-d). This transcriptional difference remained statistically significant when we controlled for higher levels of gene expression for SE-associated genes (Extended Data Fig. 3e). Furthermore, loss of BACH2 led to the largest difference between SEs and TEs in comparison to other TFs such as STATs, BATF, and IRF4 (Extended Data Fig. 4a-b). In particular, 348 genes, 26% of those with SE structure in CD4+ T cells, were repressed by BACH2 (Fig. 3e, Extended Data Fig. 4c-e). In addition to protein-coding genes, a subset of SE-linked ncRNAs (56) were also repressed by BACH2 (Fig. 3f). Transcriptional upregulation at some of these domains correlated with the upregulation of nearby genes in Bach2-deficient cells (Fig. 3g and Extended Data Fig. 4f,g). This previously unrecognized circuitry reveals that a subset of genes and noncoding transcripts endowed with SE architecture in CD4+ T cells are tightly and negatively controlled by the “guardian” transcription factor, BACH2, which itself has a rich cassette of regulatory elements (Extended Data Fig. 4h).
Figure 3. Bach2 is Endowed with the Highest p300-Enriched SE in T cells.
(a) Ranked order of p300-loaded enhancers in T cell subsets demonstrates Bach2 as the strongest SE-associated gene in CD4+ T cells.
(b) Bach2 locus, the top ranked SE, exhibits an exceptional amount of p300 binding.
(c, d) BACH2 preferentially represses SE genes. Wildtype and Bach2-deficient CD4 T cells were polarized to induced regulatory T cells (iTregs) and were processed for total RNA extraction (n=3). Normalized transcript abundance measured by RNA-seq (rpkm) was evaluated in wildtype and Bach2-deficient cells at SE and TE-associated genes and compared to the remaining genes. Cumulative distribution (c) and violin plots (d) show the (log2) fold-change in gene expression for wildtype versus Bach2-deficient cells (Table S3).
(e) The gene-set-enrichment-analysis (GSEA) of SE-associated genes reveals that SE genes are enriched in genes repressed by BACH2.
(f) BACH2 affects a subset of noncoding transcripts at SE domains. Overall, 56 ncRNAs with SE structure are repressed while 32 transcripts are induced by BACH2 (Table S3).
(g) BACH2-associated repression of a noncoding transcript with an SE architecture correlates with the transcriptional repression of a nearby gene (Ifngr1). Direct BACH2 binding along with the transcript levels in wildtype and Bach2-deficient cells measured by RNA-seq were depicted in a 140kbp window accommodating Ifngr1 gene.
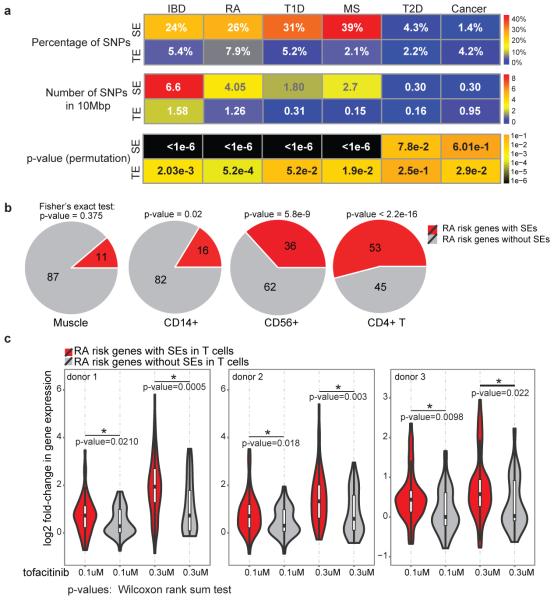
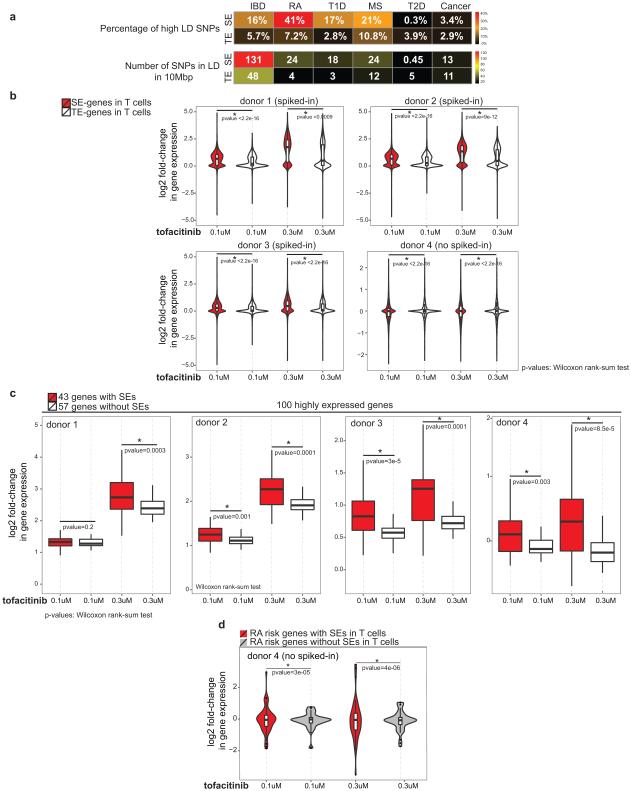
It has been shown that single nucleotide polymorphisms (SNPs) associated with diseases relevant to a particular cell type are more enriched in SEs compared with TEs2,5. CD4+ T cells are important contributors to a wide variety of autoimmune diseases including RA. Thus, we explored the extent to which RA-associated genetic variants were situated within SEs. We delineated SEs in human CD4+ T cell subsets and found that 26% of the SNPs highly associated with RA7 (27/101) fell within SEs (Fig. 4a). In contrast, only 7% of RA SNPs overlapped with TEs (Fig. 4a). Controlling for difference in the size of genomic regions, we found the number of SNPs per 10 MB of SEs was significantly higher than those in TEs (Fig. 4a). Genetic variants associated with other autoimmune disorders such as IBD, MS, and T1D also exhibited preferential enrichment in CD4+ T cell SEs compared to TEs (Fig. 4a). Such enrichment was also present when we considered variants in high linkage disequilibrium (LD) with disease-associated SNPs (Extended Data Fig. 5a). As a comparison, genetic variants associated with T2D and cancer, diseases in which CD4+ T cells are not thought to play major roles, were also assessed and found not to be significantly enriched within T cell SEs (Fig. 4a). We refined these observations by examining “genes” that were affected by RA-associated genetic variants, focusing on 98 candidate genes associated with RA7. While SEs in muscle cells showed little association (Fig. 4b), RA risk genes were preferentially associated with SEs in cytotoxic NK cells (CD56+) and monocytes (CD14+). However, the strongest enrichment occurred in CD4+ T cells, where half of the RA risk genes (53/98) were linked to CD4+ T cell SEs (Fig. 4b).
Figure 4. Rheumatoid Arthritis Risk Genes with SE Structure Are Selectively Targeted by Janus Kinase Inhibitor, tofacitinib.
(a) Single-nucleotide polymorphisms (SNPs) associated with autoimmune diseases including rheumatoid arthritis (RA), inflammatory bowel disease (IBD), multiple sclerosis (MS), and type 1 diabetes (T1D) are preferentially enriched at the SE structure of human CD4+ T cells. In contrast, SNPs associated with disorders in which CD4+ T cells play limited roles, such as T2D and cancer, are not enriched in these genomic domains. A catalogue of 1,426 SEs in human T cells was constructed by aggregating SE predictions in human Th1, Th2, and Th17 cells using H3K27ac data (Table S4). We divided the number of SNPs enriched in SEs/TEs by the total size of SEs (66.5338 MB) and TEs (63.12915 MB) and reported the number of SNPs within every 10 MB of the genome (P-values permutations test).
(b) RA risk genes are linked to SEs in CD4+ T cells. The 98 candidate genes associated to RA were from7.
(c) RA risk genes with SEs are selectively targeted by a Jak-inhibitor, tofacitinib. Violin plots depict the fold-change in expression (log2) after tofacitinib treatment of human CD4+ T cells at RA-risk genes with or without SEs (three donors). To ensure accurate inference of the effect of tofacitinib on transcriptome, spiked-in RNA standards were added and gene expression levels (rpkm) were renormalized based on the spiked-in standards (P-values Wilcoxon rank-sum test).
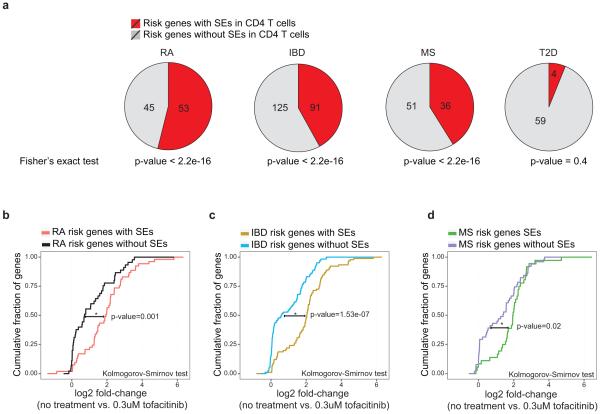
SE structures are thought to be particularly sensitive to perturbation due to the cooperative and synergistic binding of numerous factors at these domains3. Given the enrichment of STATs at SEs and prevalence of SEs at cytokines and their receptors, we measured the effect of tofacitinib, a Janus kinase inhibitor recently approved by the FDA for the treatment of RA, on T cell transcriptomes. We found that tofacitinib treatment had a significantly greater impact on the transcription of genes with SEs than TEs (Extended Data Fig. 5b). Moreover, when genes were ranked based on their transcript levels in T cells, the most highly expressed genes with SEs showed a larger change in their expression compared to those without SEs, emphasizing that tofacitinib discriminates genes with SE structure (Extended Data Fig. 5c). Though harboring the strongest SE in T cells, BACH2 levels were not affected by acute tofacitinib treatment suggesting a STAT-independent regulation. Finally, we related the effect of this RA drug to the genetics of RA and found that tofacitinib treatment disproportionately affected the expression of RA risk genes with SE structure in CD4+ T cells compared to those lacking this chromatin feature (Fig. 4c and Extended Data Fig. 5d). Furthermore, tofacitinib treatment selectively affected IBD22 and MS23 risk genes with SEs (Extended Data Fig. 6).
Herein, we defined helper T cell SE landscape, in the hope of better defining key regulatory nodes in a non-biased fashion. We found that in T cells these nodes largely comprise cytokine and cytokine receptor genes. Thus, T cell “identity” relates largely to the precise regulation of these key effectors and sensors. However, a predominant SE-associated gene in all T cell lineages was Bach2, which may represent the first example of a class of transcriptional regulators that broadly constrains transcription at SEs. Furthermore, SNPs associated with immune-related diseases were enriched at T cell SEs and a drug, which blocks cytokine signaling and is clinically efficacious in autoimmune disease, preferentially impacted SE-associated genes. Hence, our study provides a systematic approach by which the SE map of relevant cell types can be integrated with human genetics to discover drug target genes.
METHODS
Antibodies and reagents
The following antibodies and reagents were obtained from eBioscience: CD4-PerCPCy5.5, CD45RA-PE, CD45RO-eFluor450, CD28-purified. Anti α-CD3 antibody was obtained from BioXcell. CP-690,550 (tofacitinib) was prepared by the National Institute of Health Chemical Genomics Center and dissolved in DMSO. Table S1 summarizes ChIP-seq datasets generated or used for this dataset along with relevant antibodies.
Cell culture and stimulation for tofacitinib treated human T cells
Whole blood from healthy donors was provided from the NIH blood bank and informed consent was obtained from subjects. To obtain lymphocyte population, heparinized whole blood from healthy donor was separated by Ficoll Paque PLUS (Sigma). Naïve CD4+CD45RA+CD45RO− T cell population was sorted on a FACS Aria II (BD Bioscience, San Jose, CA). Cells were activated by plate-bound anti-CD3/anti-CD28 (10 μg/ml) in supplemented RPMI 1640 medium containing 10% FCS, 2 mM glutamine, 100 IU/ml penicillin, 0.1 mg/ml streptomycin, 20mM HEPES buffer (all from Invitrogen, Carlsbad, CA) for 3 days and cultured in the presence of IL-2 for 1 day. During T cell activation, cells were treated with the indicated concentrations of CP-690,550 (tofacitinib).
RNA-sequencing preparation
Total RNA was prepared from approximately 1 million cells by using mirVana miRNA Isolation Kit (AM1560, ABI). 200 ng to 1 μg of total RNA was subsequently used to prepare RNA-seq libraries by using TruSeq SR RNA sample prep kit (FC-122-1001, Illumina) or by a combination of NEBNext RNA library prep kit (New England BioLabs) and Ovation SP Ultralow DR Multiplex system (Nugen) by following the manufacture’s protocol. The libraries were sequenced for 50-cycles (single read) with HiSeq 2000 (Illumina). When indicated, ERCC RNA spike-in mix1 (Invitrogen) was added to the samples based on the cell counts (1 μl of 1/10 dilution to 1 million cells).
RNA-seq analysis
RNA-seq libraries made by Illumina TruSeq were first trimmed using ‘cutadapt’ with “TruSeq Indexed Adapters”. Error-rate of 0.1 was chosen for ‘cutadapt’. Overall, the percentage of trimmed reads was lower than 3% of the total reads across different libraries. Trimmed fastq files were then aligned to mm9 or hg19 reference genomes using tophat with bowtie2 indexes derived based on UCSC annotations. The normalization of RNA-seq libraries shown on the genome-browser was carried out using “bedtools genomecov” to ‘scale’ the bam files to tags-per-million values. ‘HT-seq’ was used to find the counts reads across the UCSC reference genome and DEseq was further employed to characterize differentially regulated genes where repeats were available (Bach2-deficient RNA-seq).
RNA-seq analysis of Bach2-deficient cells
Wildtype and Bach2-deficient naive (CD44− CD62L+ CD25−) CD4+ cells were isolated to >95% purity from C57BL/6 mice reconstituted with mixtures of WT and KO OT-II TCR-transgenic BM. Cells were stimulated at 1×10⁵ cells/96 well plate coated in 5μg/mL α-CD3 in the presence of soluble α-CD28 (5μg/mL), 100IU rhIL-2 and 5ng/mL rhTGF-β for 3 days. Cells were counted using a haematocytometer, or analyzed by FACS for cell size or intracellular Foxp3 content. Cells were harvested and subjected to total RNA extraction (Qiagen RNeasy Plus kit with column-based DNA removal).
RNA-seq with spiked-in standards
ERCC RNA spike-in mix1 (Invitrogen) was added to samples based on the cell counts (1 μl of 1/10 dilution to 1 million cells). The ERCC RNA Spike-In Control Mixes used here comprise a set of 92 polyadenylated transcripts that mimic natural eukaryotic mRNAs. Based on page 12 of the ERCC manual, we calculated the concentrations of the RNA molecules added to total RNA (i.e. number of copies of spiked-in molecules per million cell) (Table S3). It is clear that the standards covers a wide range of copy numbers.
Spiked-in RNA-seq analysis
The spiked-in RNA-Seq libraries were subsequently sequenced on Illumina HiSeq 2000 and then trimmed using ‘cutadapt’ with “TruSeq Indexed Adapters”. The sequences of the ERCC synthetic spiked-in RNAs (http://tools.invitrogen.com/downloads/ERCC92.fa) were then added to both mouse and human genomes (genome.fa). The exon reference (http://tools.invitrogen.com/downloads/ERCC92.gtf) has also been added to the UCSC exon reference.
cat/ERCC/ERCC92.fa >> genome.fa
cat /ERCC/ERCC92.gtf >> genes.gtf.
New bowtie indexes were then built and reads were aligned to the newly built genomes using tophat. The RPKM (reads per kilobase of exon per million) was then computed for each gene and synthetic spiked-in RNA using cufflinks. To renormalize the RNA-seq data using spiked-in control, we followed the same procedure that was recommended by Loven et al21. We used a loess regression to renormalize the RPKM values by using only the spiked-in values to fit the loess. The affy package in R provides a function, loess.normalize, which will perform loess regression on a matrix of values (defined by using the parameter mat) and allows for the user to specify which subset of data to use when fitting the loess (defined by using the parameter subset). For this application the parameters mat and subset were set as a matrix of all RPKM values and the row indices of the ERCC spiked-ins, respectively. The default settings for all other parameters were used. The result of this was a matrix of RPKM values normalized to the control ERCC spiked-ins. Table S3E quantitates the fraction of spiked-in tag counts in each RNA-seq library when tag counts were generated using “htseq-count --mode=intersection-nonempty --stranded=no”.
Chromatin Immunoprecipitation followed by sequencing (ChIP-seq)
For p300, we chemically crosslinked and sonicated cells to generate fractionated genomic DNA. Chromatin immunoprecipitation was performed by using anti-p300 (sc-585, Santa Cruz Biotechnology). The DNA fragments were blunt-end ligated to the Illumina adaptors, amplified, and sequenced by using the Illumina Genome Analyzer II (Illumina, San Diego, CA). Sequence reads of 25 or 36 bps were obtained by using the Illumina Analysis Pipeline. Publically available ChIP-seq datasets are listed in Table S1 and were obtained from several published studies 12-15,26-29.
ChIP-seq analysis
ChIP libraries were sequenced for 36 or 50 cycles on an Illumina Genome Analyzer II or HiSeq 2000, respectively, according to the manufacturer’s instructions. ChIP libraries were aligned to mm9 or hg19 reference genomes using bowtie2 with bowtie indexes derived based on UCSC annotations and Phred+33 selected for qualities. Table S1 summarizes ChIP-seq datasets generated or used for this dataset along with relevant antibodies. Peak-calling for all transcription factors and p300 binding was performed by macs1430 using p-value=1e-7. Control library for all peak-calling libraries was the input DNA performed under Th0 condition. Peaks with FDR values more than 30% were further excluded. Peaks intensities (‘tags’ column) were normalized as tags-per-million reads in the original library. Peak-calling for H3K27ac libraries was performed using SICER31 where the window-size=200bp, gap-size=200bp, and e-value=200. To visualize and normalize ChIP-seq libraries on the UCSC genome-browser, we used “bedtools genomecov” to ‘scale’ the bam files to tags-per-million values. Furthermore, “wigToBigWig” was used to generate bigwig files. Y-axis in all gene tracks is tags-per-million (TPM).
Delineation of super-stretch enhancers (SEs) and typical enhancers (TEs)
In order to accurately delineate SE domains, we followed the same approach that was proposed earlier by Young and colleagues2,3,4. We first merged genomic regions within 12.5 kb of one another (using mergeBed in bedtools). We then ranked all regions in a cell type by increasing total ChIP-seq occupancy of p300 or H3K27 acetylation, scaled the data such that the x and y axis were from 0-1 by normalizing to the largest value, and plotted the intensity of ChIP-seq (Figure 1a). These plots revealed a clear point in the distribution of enhancers where the occupancy signal began increasing rapidly. To geometrically define this point, we found the x-axis point for which a line with a slope of 1 was tangent to the curve. As suggested by Young and colleagues, we defined genomic regions above this point to be super or stretch-enhancers (SEs). All genomic regions below that point that did not harbor promoters (−5/+5kbp of RefSeq TSSs) were then referred as typical enhancers (TEs). The single map of SEs in CD4+ T cells was constructed by merging maps of Th1, Th2, and Th17 SEs (unionBedGraphs). Similarly, TEs in each lineage were delineated as described and then merged in different lineages to build one map for TEs. Since SEs in one lineage can be TEs in other lineages, SE coordinates were then excluded from the final TE map for CD4+ T cells. Tables S1 and S4 summarize the coordinates of SEs in both human and mouse in our study.
Delineation of cell-type specific SEs (Figure 1b and Extended Figure 1b)
To define cell type-specific and shared SE domains, we started from the merged map of SEs in Th1, Th2, and Th17 cells (Table S1). We then used “bedtools intersect” with −f 0.1, 0.3, 0.5 or 0.7 with −a being the coordinate of merged map and −b being the SE coordinates in the corresponding condition and reporting −c in the output (for each entry in A, report the number of overlaps with B and reporting 0 for A entries that have no overlap with B.) We used pheatmap function to demonstrate the shared and unique SEs based on the outputs of “bedtools intersect” for the three cell types. Figure 1b corresponds to f=0.1.
Characterizing SE and TE-associated genes
SE- and TE-associated genes were defined based on the closest genes to these genomic regions (bedtools closest) using RefSeq coordinates of genes. As described in this package, closestBed first searches for features in B (gene coordinates) that overlap a feature in A (SE coordinates). If overlaps are found, gene coordinates that overlaps the highest fraction of SE region is reported. Then in the case of multiple genes overlapping SEs, the gene with the highest fraction of overlap is reported. If no overlaps are found, closestBed looks for the feature in B that is closest (that is, least genomic distance to the start or end of A) to A.
Transcription at Th-specific SE genes (Figure 1d)
We delineated SE-genes as described above for Th1, Th2 and Th17 p300 binding. We defined a gene to be specific to a lineage if that gene was not present in SE-associated genes in other two lineages. We then showed the log2 rpkm values for this list of genes across three different lineages. P-values were calculated using Wilcoxon rank-sum test.
Characterization of long non-coding RNAs (lncRNAs) associated to SEs (Figure 1e-g)
The list of transcribed ncRNAs in T cells was compiled from Hu et al11. Hu et al11 performed the following steps for the identification of ncRNA clusters: 1) call RNA-Seq read enriched islands from intergenic regions using SICER (window = 100 bps, Gap = 200 bps, E-value = 100); 2) keep islands shared by duplicates; 3) pool islands from all samples, independently done for data sets from total RNA-Seq and from PolyA+ RNA-Seq; 4) cluster neighboring islands based on similarity in expression profiles across different samples (r > 0.8). Transcribed regions that overlapped SEs were identified using countOverlaps function in GenomicRanges package in R. To quantitate the correlation levels in transcripts across different T cell lineages and time points, we used ‘cor’ function in R with ‘pearson’ as ‘method’ (no log2 transformation prior the calculation of correlation). Transcript levels for polyA RNAs used for this analysis were extracted from the supplementary table provided in Hu et al manuscript11. Genomic coordinates of these two groups of ncRNA are provided in Table S1.
Cumulative distribution of ncRNAs with and without SEs (Figure 1h)
We used “rowSds” function from library “matrixStats” in R to calculate the standard deviation in each row for expression levels of ncRNAs with and without SEs. We used ggplot and stat_ecdf() to plot the cumulative distribution of standard deviation in these two groups of ncRNAs. Cumulative distribution in Extended Figure 1e shows quantitative shift in standard deviation of transcript levels for ncRNAs with SEs relative to those without SEs (p-value=1.326e-07 Kolmogorov-Smirnov test).
Profile of transcription factor binding at SE genomic regions (Figure 2)
To plot the normalized tags-per-million transcription factor binding at SEs and their flanking 40kbp regions, we used ‘ngs.plot.r’ package32 (e.g. Fig 2a). To generate the enrichment of transcription factors at Th-preferred SEs, we started by counting all tags in .bed files for each transcription factor binding using “bedtools coverage –counts” across the one map of SEs in T cells (Th1/Th2/Th17 merged). Furthermore, in Figure 2d we selected the Th (1, 2, 17)-preferred SEs as genomic regions identified based on overlapping fraction=0.1 identified in Figure 1b. Extended Figure 2a was generated by using ngs.plot on the same set of cell type specific coordinates. The normalization has been done as described in32: “the coverage data is subjected to two steps of normalization. In the first step, the coverage vectors are normalized to be equal length using spline fit where a cubic spline is fit through all data points and values are taken at equal intervals. This first step of length normalization allows regions of variable sizes to be equalized and is particularly useful for custom regions. In the second step, the vectors are normalized against the corresponding library size – i.e., the total read count ”.
Profile of transcription factor binding at constituent elements of SEs (Extended Figure 2c)
We first recovered the original peak regions for p300 binding (constituent enhancers) within SEs from outputs of the peak-calling method (MACS) overlapping SEs/TEs. We then used HOMER ‘annotatePeaks.pl’ function to plot the enrichment of transcription factor binding at constituent enhancers in SEs and TEs.
Gene-ontology analysis for SE-associated genes (Figure 2e and Extended Figure 3a-b)
In Figure 2d, gene-ontology enrichment for SE genomic coordinates was carried out using GREAT24 with default parameters. The top 10 terms based on Bionomial pvalue were selected in Figure 3a. In a completely different approach, we characterized closest genes to SEs. The top GO molecular functions in terms of GSEA “Investigate Gene Sets“. To calculate the statistical significance of these enrichments, we randomly moved the SE regions around the genome 105 times, delineated the closest gene sets to the random genomic domains, and assess relative proportion of a gene set that is captured in the actual data versus the shifted SEs. P-values for this permutation test are reported in Extended Figure 3a.
Gene ontology (GO) functional category relevant to cytokines binding is enriched at SE-associated genes in T cells and to a lesser extent macrophages but not mESCs and myotubes (Extended Figure 3b). To explore whether “cytokine binding” is specific to the SE structure in CD4+ T cells, we explored its association within the SE structures of other cell-types. The GO molecular function associated to cytokine binding (GO:0019955) was chosen. SE associated genes in myotubes were used from Whyte et al4. SE regions in mESC and macrophages were chosen based on datasets reported in Table S1. To calculate the statistical significance of this gene category, we shuffled the SE regions of mESC, macrophage, myotubes and CD4+ T cells around the genome 105 times, delineating the gene sets in proximity to the random genomic domains associated to each cell type. We then assessed the relative proportion of the gene set captured in the actual data versus the shifted SEs. P-values for this permutation test are reported in the bar-graph in Extended Figure 3b.
Analysis of RNA-seq data from Bach2-deficient cells (Figure 3c-d and Extended Figure 3c-e)
The log2 fold-change of average rpkm values in wildtype and knockout repeats were calculated for SE-genes and equal number of randomly selected TE and other genes in the violin plots (Figure 3d and Extended Figure 3d). In Extended Figure 3c-d, the rpkm values for the spiked-in measurements were renormalized based on the spiked-in standards. We used ggplot and geom_violin(scale = "area") to plot the impact of loss of Bach2 on gene expression. All genes in SEs, TEs, or rest of genes were used for the cumulative distribution plots (Figure 3c and Extended Figure 3c). In Extended Figure 3e, we focused on the top 500 highly expressed genes and explored the effect of Bach2 on three categories among them: genes with SEs (77), with TEs (125), and without either SEs or TEs (298). Expression levels among these three categories of genes were comparable (Wilcoxon rank-sum test p-value=0.644). However, Bach2 selectively affected highly expressed SE genes in contrast to those with TEs or no enhancers (Kolmogorov-Smirnov test p-value=9.813e-7 and 4.669e-8).
GSEA plot (Figure 3e and Extended Figure 4c)
The “gene-set” for GSEA was generated based on genes closest to SEs with minimum 1 rpkm value in any of the three lineages (Th1, Th2, Th17 cells). Three repeats for wildtype and Bach2KO RNA-seq data were used in the GSEA analysis with default settings. The p-value for the enrichment was calculated as 0 although -nperm= 10000 was used (with command-line usage of GSEA). In the case of spiked-in GSEA analysis (Extended Figure 4c), two repeats for wildtype and knockouts of renormalized spiked-in data was used.
Pie-chart demonstrating Bach2-dependent SE genes (Extended Figure 4d)
Bach2-up or down regulated genes (Table S3) were delineated by the “DEseq” package in R with FDR<0.05 and fold-change>1.5. Tag counts were calculated using “htseq-count --mode=intersection-nonempty --stranded=no”. Three repeats of RNA-seq data for wildtype and knockout samples (no spiked-in) were used (Table S1). Direct targets of Bach2 genes were identified based on Bach2 ChIP-seq data at these two groups of genes. List of SE genes with at least 1 rpkm expression in Th1, Th2 or Th17 cells were used for this analysis.
Characterization of Bach2-dependent noncoding RNAs (Figure 3g)
We used “bedtools coverage –counts” to quantitate the enrichment of RNA-seq reads at 501 ncRNAs with SE structure in wildtype and Bach2 knockout cells (Table S3). Transcript levels were further normalized to the size of each library (tags-per-million) and average of enrichment in three repeats were calculated. Next, we selected SEs were the noncoding transcripts where 4 fold different between wildtype and knockout cells.
Impact of transcription factors on SE and TE-associated genes (Extended Figure 4a-b)
The fold-change in rpkm values between wildtype and knockout samples was calculated for SE-genes and equal number of randomly selected TE genes. For each transcription factor, the difference between SEs and TEs was quantitated using Kullback-Leibler distance between the two distributions for fold-changes in the two groups of genes using KL.dist function in FNN library in R. The largest difference between SEs and TEs generated because of loss of Bach2, STAT4, and STAT6 suggests the more selective impact of these transcription factors on SEs.
Pruning SNPs (Figure 4a)
To ensure that the SNPs associated with disease are in physically independent segments of the genome, we pruned our lists of SNPs. Data from the 1000 Genomes (release 20110521) were downloaded from the 1000 Genomes open ftp site. SNPs that were present in each of the six disease conditions were extracted. For each disease, the all-vs-all pairwise r2 values were calculated. Finally, all variants were greedily pruned until no pair had an r2 value greater than the threshold (0.5). The number of SNPs pruned for each disease and their genomic coordinates can be found in Table S4.
T cell SEs in human and enrichment of SNPs (Figure 4a and Extended Figure 5a)
Human SEs in T cell subsets were characterized based on H3K27ac data in Th1, Th2 and Th17 cells (Table S4). The methodology for the delineation of SEs for human T cells was the same as the one described for the mouse data. We referred to the merged map of the Th1, Th2, and Th17 SEs as the single map of SEs in CD4+ T cells (Table S4). The lists of tag SNPs for all traits except RA were extracted from the GWAS catalogue (December 2013) and only those with p-values less than 1e-8 were selected. The list of 101 RA SNPs were chosen from the recent meta-analysis of RA GWASs33. The percentages of SNPs within SEs/TEs were calculated based on the number of SNPs falling into the genomic domains labeled as SEs/TEs. To account for the size of the genome that these two types of enhancers span, we divided the number of SNPs enriched in SEs/TEs by the total size of SEs (66.5338 Mbp) and TEs (63.12915 Mbp) and reported the number of SNPs in every 10Mbp of the genome in Figure 4a. The permutation test for the enrichment p-value was calculated by generating 106 permutations of SEs and TEs in the genome (excluding unmappable regions in each permutation) and considering the number of iterations where the number of overlapping SNPs with random SEs/TEs exceeded the observed ones in CD4+ T cells. SNPs in LD with the list of tag SNPs were determined from 1000 Genomes Project using r2=0.9 and distance limit=500 using SNAP toolbox.
RA-risk genes and SEs (Figure 4b)
The list of 98 RA risk genes was extracted from the study of Plenge and colleagues33. H3K27ac data for muscle, CD14+, and CD56+ cells are summarized in Table S4.
Quantitating the effect of tofacitinib on different groups of genes (Figure 4c)
For each donor (except donor-4), the rpkm values with spiked-in were renormalized and the fold-changes at SE/TE genes were reported for each donor. No spiked-in was used for the RNA-seq analysis of donor-4. The p-values were calculated based on Wilcoxon signed-rank test (wilcox.test function in R) for violin and box plots. The violin plots used ‘scale=’area’’. In Extended Figure 4c, for each donor, the top 100 highly expressed genes in non-treated RNA-seq data were selected and categorized as having SEs or not.
IBD, MS and T2D-risk genes and SEs (Extended Figure 6)
The candidate genes associated to RA7, IBD22, MS23, and T2D25 were chosen based on recent meta-analysis of GWAS data. More than half of RA risk genes (53/98) accommodated SEs in CD4+ T cells. In line with the enrichment of SNPs associated to IBD and MS in T cell SEs (Figure 4a), around half of IBD (91/216) and MS risk genes (36/87) were associated to SEs in T cells. In contrast, T2D risk genes showed little association with SEs (4/65) (Fisher’s exact test, pvalue=0.4). RA and IBD risk genes with SEs are selectively targeted by a Jak-inhibitor, tofacitinib. Cumulative plots depict the fold-change in expression (log2) after 0.3uM tofacitinib treatment of human CD4+ T cells at RA (b), IBD (c) and MS(d) risk genes with or without SEs.
Extended Data
Extended Data Figure 1. SE Structures Are Lineage-Specific.
(a) Histone acetyltransferase p300 is distributed asymmetrically across the genome in CD4+ T cells with a subset of enhancers (SEs) containing exceptionally high amounts of p300 binding. Graph demonstrates the ranked distribution of p300 binding measured by ChIP-seq in Th2 and Th17 cells.
(b) Closely related CD4+ T cell populations have distinct SE landscapes. Common and cell-type specific SE domains in T cell subsets are illustrated for various fractions of overlapping genomic regions (f = 0.1, 0.3, 0.5, and 0.7). The overlapping pattern of SEs across CD4+ T cells was statistically significant when these annotations were shuffled across the genome (p-value<10−5).
(c) Lineage-specific presence of SEs for master transcription factor genes in T cells. Genomic loci of genes encoding T-bet, GATA3, and RORγ exhibit SE structures in Th1, Th2, and Th17 cells, respectively. Black-bar represents the genomic location of SEs.
(d) The genomic locus of gene encoding gp130, Il6st, accommodates an SE with high level of transcription. Black-bar represents the genomic location of SE.
Extended Data Figure 2. Transcription Factor Enrichment at SEs.
(a) Lineage-specific transcription factors are enriched at cell type-specific SEs. Binding patterns of STAT4, STAT6, and STAT3 revealed preferential binding at Th1, Th2, and Th17-specific SE regions, respectively. Furthermore, master transcription factors T-bet, GATA3 and RORγt were enriched at lineage-specific SEs. Strong binding of BATF, BACH2, and IRF4 was present in SEs of the all three cell types. Maps of cell type-specific SEs were constructed as described in (Fig. 1b). Normalization of Y-axis takes into account the variable sizes of genomic regions and also the corresponding library size (i.e. the total read count) (Methods).
(b) CTCF binding demarcates the boundaries of SEs. Normalized binding profile of CTCF protein revealed the enrichment of CTCF at boundaries of SE regions.
(c) Comparing the enrichment of TFs at constituent enhancers of SEs and TEs reveals the preferential binding of STAT3 at SEs while other TFs demonstrated comparable binding at SEs and TEs.
Extended Data Figure 3. Identity of SE Associated Genes.
(a) SEs delineate genes playing a central role in the biology of specific cell lineages. Gene ontology (GO) functional categories relevant to cytokine binding are enriched at SE-associated genes in T cells. In ES cells, SE structures primarily encompass DNA binding proteins and transcriptional repressor functions. In macrophages, chemokine and cytokine activity were the most prominent categories. Using a complementary approach to that described in Figure 2a, we characterized genes in proximity of SEs. The top GO molecular functions using GSEA were chosen. To calculate the statistical significance of these gene categories, we shuffled the SE regions around the genome 105 times, delineating the gene sets in proximity to the random genomic domains. We then assessed the relative proportion of a gene set captured in the actual data versus the shifted SEs. –log10 p-values for this permutation test are reported in the bar-graph.
(b) Gene ontology (GO) functional category relevant to cytokines binding is enriched at SE-associated genes in T cells and, to a lesser extent, in macrophages but not mESCs or myotubes. To explore whether “cytokine binding” is specific to the SE structure in CD4+ T cells, we explored its association within the SE structures of other cell-types. The GO molecular function associated to cytokine binding (GO:0019955) was chosen. To calculate the statistical significance of this gene category, we shuffled the SE regions of mESC, macrophage, myotubes and CD4+ T cells around the genome 105 times, delineating the gene sets in proximity to the random genomic domains associated to each cell type. We then assessed the relative proportion of the gene set captured in the actual data versus the shifted SEs. P-values for this permutation test are reported in the bar-graph.
(c, d) BACH2 preferentially represses SE genes. Wildtype and Bach2-deficient CD4+ T cells were polarized to induced regulatory T cells (iTregs) and were subjected to total RNA extraction. RNA standards “spiked-in” were added in proportion to the number of cells present in the sample. The resulting transcriptome data measured by RNA-seq were processed by using standard normalization methods and then renormalized based on spiked-in reads (rpkm) (see Methods). Transcript abundance measured by RNA-seq was evaluated in wildtype and Bach2-deficient cells at SE and TE-associated genes compared to remaining genes (rpkm). Cumulative distribution (c) and violin plots (d) show the (log2) fold-change in gene expression for wildtype versus Bach2-deficient cells for these three groups of genes. SE genes are preferentially affected by loss of BACH2 compared to TE genes (p-value<2.2e-16, Kolmogorov-Smirnov test) or remaining genes (p-value<2.2e-16, Kolmogorov-Smirnov test). P-values for the violin plots (d) were calculated using Wilcoxon rank-sum test.
(e) BACH2 selectively affects SE genes and such selectivity remains statistically significant when controlling for the higher levels of gene expression for the SE genes. Genes were ranked based on their transcriptional activity in Tregs. We focused on the top 500 highly expressed genes and explored the effect of Bach2 on three categories among them: genes with SEs (77), with TEs (125), and without either SEs or TEs (298). Expression levels among these three categories of genes were comparable (Wilcoxon rank-sum test p-value=0.644). However, Bach2 selectively affected highly expressed SE genes in contrast to those with TEs or no enhancers (Kolmogorov-Smirnov test p-value=9.813e-7 and 4.669e-8).
Extended Data Figure 4. BACH2 Acts as a Guardian Transcription Factor.
(a,b) Loss of BACH2, STAT4, and STAT6 have the most selective impact on the expression of SE-genes. The fold-change in expression (in rpkm) between wildtype and knockout samples was calculated for SE-genes and an equal number of randomly selected TE genes (a). For each transcription factor, the difference between SEs and TEs was quantitated using Kullback-Leibler distance (b). The larger difference between SEs and TEs for Bach2, STAT4, and STAT6 suggests the more selective impact of these transcription factors on SEs. STAT4 and T-bet transcriptome data were under Th1, STAT6 under Th2, STAT3, BATF and IRF4 under Th17 and BACH2 under iTreg conditions.
(c) SE-associated genes in CD4+ T cells are repressed by Bach2. To ensure accurate inference of the effect of Bach2 on transcriptome, spiked-in RNA standards were added. The gene-set-enrichment-analysis (GSEA) of SE-associated genes revealed that SE genes were enriched in genes repressed by Bach2 when transcript levels were renormalized using spiked-in RNA standards.
(d) BACH2 acts as a repressor of SE-associated genes. Comparison of the transcriptome data measured by RNA-seq in wildtype and Bach2-deficient cells (DE-seq analysis for three wildtype and knockout samples, FDR<0.05 and fold-change > 1.5) revealed that 348 SE-genes were repressed while 176 were induced by this protein. Integration of Bach2 binding data measured by ChIP-seq characterized the direct targets of BACH2.
(e) The gene-set-enrichment-analysis (GSEA) of TE-associated genes revealed that TE genes are not enriched in genes repressed by Bach2.
(f,g) BACH2-associated transcriptional repression at some SE domains correlates with the downregulation of nearby genes such as Rbpj (f) and Socs1 (g).
(h) Genes and noncoding transcripts endowed with SE architecture in CD4+ T cells are tightly and negatively controlled by the “guardian” transcription factor Bach2 which itself has a rich cassette of regulatory elements. Examples were selected based on direct binding of Bach2 at the gene-body or SE regions measured by ChIP-seq.
Extended Data Figure 5. Rheumatoid Arthritis Risk Genes with SE Structure Are Selectively Targeted by a Janus Kinase Inhibitor, tofacitinib.
(a) Genetic variants in high linkage disequilibrium (LD) with SNPs associated with autoimmune disorders such as RA, IBD, MS, and T1D exhibit preferential enrichment in SEs versus TEs in human CD4 T cells. Variants in LD with SNPs in each disease were determined from 1000 Genomes Project using r2=0.9 and distance limit=500 by SNAP toolbox. The heatmap depicts the percentages of SNPs and total number of SNPs per 10MB within SEs and TEs.
(b) Tofacitinib treatment has a selective impact on SE versus TE genes in human T cells. Violin plots depict the fold-change (log2) in transcript levels due to tofacitinib treatment at SE-versus TE-genes in CD4+ T cells. The p-values were calculated based on Wilcoxon signed-rank test.
(c) Highly expressed genes in T cells with SEs are selectively affected by tofacitinib. For each donor, the top 100 highly expressed genes in non-treated cells were selected and categorized as having SEs or not. The p-values were calculated based on Wilcoxon signed-rank test.
(d) RA risk genes with SEs are selectively targeted by a Jak-inhibitor, tofacitinib. Violin plots depict the fold-change in expression (log2) after tofacitinib treatment of human CD4+ T cells at RA-risk genes with or without SEs (a donor with no spiked-in standard in RNA-seq). P-values were calculated using F-test.
Extended Data Figure 6. Tofacitinib Selectively Affects Autoimmune Disease Risk Genes with SE Structure in T Cells.
(a) RA, IBD, and MS risk genes are linked to SEs in CD4+ T cells. The candidate genes associated to RA7, IBD22, MS23, and T2D25 were chosen based on recent meta-analyses of GWAS data. More than half of RA risk genes (53/98) contained SEs in CD4+ T cells. In line with the enrichment of SNPs associated to IBD and MS in T cell SEs (Figure 4a), around half of IBD (91/216) and MS risk genes (36/87) were associated with SEs in T cells. In contrast, T2D risk genes showed little association with SEs (4/65) (Fisher’s exact test, p-value=0.4).
(b-d) RA and IBD risk genes with SEs are selectively targeted by a Jak-inhibitor, tofacitinib. Cumulative plots depict the fold-change in expression (log2) at RA (b), IBD (c) and MS (d) risk genes with or without SEs after 0.3uM tofacitinib treatment of human CD4+ T cells (p-values Kolmogorov-Smirnov test)
Supplementary Material
Table S1:
(A, B) List of ChIP-seq and RNA-seq datasets generated and used in this study and their associated GEO numbers. Table S1 is a summary of ChIP-seq (first sheet) and RNA-seq (second sheet) datasets that were generated for this study (bold) or have been publically available. GEO numbers refer to the original submission of such datasets.
(C-E) Genomic coordinates of SEs in mouse Th1, Th2, and Th17 cells.
We used p300 binding in Th1, Th2 and Th17 cells to delineate the genomic coordinates for the SE structures in these cell types. We first merged genomic regions within 12.5 kb of one another (using mergeBed in bedtools) and then ranked all regions in a cell type by increasing total ChIP-seq occupancy of p300 binding. When we plotted the intensity of ChIP-seq, these plots revealed a clear point in the distribution of enhancers where the occupancy signal began increasing rapidly. To geometrically define this point, we found the x-axis point for which a line with a slope of 1 was tangential to the curve. As suggested by Young and colleagues, we defined genomic regions above this point to be super or stretch-enhancers (SEs).
(F-G) Genomic coordinates of lncRNAs with or without SEs in T cells.
The list of transcribed ncRNAs in T cells was compiled from Hu et al11. Transcribed regions with SEs were identified using countOverlaps function in GenomicRanges package in R. Transcript levels for PolyA RNAs used for this analysis were extracted from the supplementary table provided in Hu et al manuscript11. The expression level of a ncRNA is measured by the number of tags (from the RNA-Seq-tag-enriched islands within the ncRNA) normalized by the islands\p='\ size and total tag number (in millions)11.
(H-I) Genomic coordinates of merged SEs and TEs in mouse CD4 T cells.
Table S2: Log2 tags-per-million enrichment of proteins across the aggregated map of SEs in mouse T cells.
Genomic coordinates of SEs in Th1, Th2 and Th17 cells were merged to generate the aggregated map of SEs in mouse T cell (1,328 SEs). Binding intensity of transcription factors and p300 was calculated across these 1,328 SEs using \p=``\bedtools coverage \p=n-\counts\p=''\ and then normalized to tags-per-million (reported in log2).
Table S3:
(A-C) Genes and noncoding RNAs regulated by Bach2.
Bach2-up or down regulated genes were delineated by the \p=``\DEseq\p=''\ package in R with p-value<0.05 and fold-change>1.5. Tag counts were calculated using \p=``\htseq-count --mode=intersection-nonempty --stranded=no\p=''\. Three repeats of RNA-seq data for wildtype and knockout samples (with no spiked-in) were used. For ncRNAs, we used \p=``\bedtools coverage \p=n-\counts\p=''\ to quantitate the enrichment of RNA-seq reads at 501 ncRNAs with SE structure in wildtype and Bach2 knockout cells (Table S3). Transcript levels were further normalized to the size of each library (tags-per-million) and average of enrichment in three repeats were calculated. Next, we selected SEs were the noncoding transcripts where 4 fold different between wildtype and knockout cells.
(D) Number of various spiked-in sequences with corresponding molecules per 1 million cells
(E) Tag-counts for the RNA-seq data with spiked-in
Table S4:
(A-B) Genomic coordinates of merged SEs and TEs in human CD4 T cells.
(C-H) Pruned SNPs associated to RA, IBD, MS, T1D, T2D, and cancer. To make sure that the SNPs associated to disease are in physically independent segments of the genome, we pruned our lists of SNPs. We used data from the 1000 Genomes downloaded from the open ftp site (release 20110521). SNPs that were present in each of the six disease conditions were extracted. For each disease, the all-vs-all pairwise r2 values were calculated. Finally, all variants were greedily pruned until no pair had an r2 value greater than the threshold (0.5). The following table summarizes the number of SNPs pruned for each disease.
(I-N) List of RA genes with and without SEs in CD4, CD14, and CD56 human cells.
The list of RA genes were chosen from the recent meta-analysis of RA GWASs33. Genes associated to SEs in CD4, CD14, and CD56 were characterized based on K27ac data in these cell types (GEO of datasets in Table S1).
(O) Number of pruned SNPs in each disease.
Acknowledgements
The authors thank Drs. Behdad Afzali, Andre Nussenzweig, Amanda Poholek, Scott Canna, Arianne Richard, and Ewy Mathe for critically reading this manuscript. We are grateful to Drs. Robert Faryabi, Han-Yu Shih, Wolfgang Resch, Michael Ombrello, Zuoming Deng, and Elaine Remmers for their contributions to experimental and analytical components of this study. We also thank Dr. Hongwei Sun and G. Gutierrez-Cruz (Genomic Sequencing Core and Biodata Mining Discovery Section, NIAMS), J. Simone, J. Lay and K. Tinsley (Flow Cytometry Section, NIAMS) for their excellent technical support. This study utilized the high-performance computational capabilities of the Biowulf Linux cluster at the NIH. This work was supported by the Intramural Research Program of NIAMS.
References
- 1.Andersson R, et al. An atlas of active enhancers across human cell types and tissues. Nature. 2014;507:455–461. doi: 10.1038/nature12787. doi:nature12787 [pii] 10.1038/nature12787. [DOI] [PMC free article] [PubMed] [Google Scholar]
- 2.Hnisz D, et al. Super-enhancers in the control of cell identity and disease. Cell. 2013;155:934–947. doi: 10.1016/j.cell.2013.09.053. doi:S0092-8674(13)01227-0 [pii] 10.1016/j.cell.2013.09.053. [DOI] [PMC free article] [PubMed] [Google Scholar]
- 3.Loven J, et al. Selective inhibition of tumor oncogenes by disruption of super-enhancers. Cell. 2013;153:320–334. doi: 10.1016/j.cell.2013.03.036. doi:S0092-8674(13)00393-0 [pii] 10.1016/j.cell.2013.03.036. [DOI] [PMC free article] [PubMed] [Google Scholar]
- 4.Whyte WA, et al. Master transcription factors and mediator establish super-enhancers at key cell identity genes. Cell. 2013;153:307–319. doi: 10.1016/j.cell.2013.03.035. doi:S0092-8674(13)00392-9 [pii] 10.1016/j.cell.2013.03.035. [DOI] [PMC free article] [PubMed] [Google Scholar]
- 5.Parker SC, et al. Chromatin stretch enhancer states drive cell-specific gene regulation and harbor human disease risk variants. Proc Natl Acad Sci U S A. 2013;110:17921–17926. doi: 10.1073/pnas.1317023110. doi:1317023110 [pii] 10.1073/pnas.1317023110. [DOI] [PMC free article] [PubMed] [Google Scholar]
- 6.Dowen JM, et al. Control of cell identity genes occurs in insulated neighborhoods in Mammalian chromosomes. Cell. 2014;159:374–387. doi: 10.1016/j.cell.2014.09.030. doi:S0092-8674(14)01179-9 [pii] 10.1016/j.cell.2014.09.030. [DOI] [PMC free article] [PubMed] [Google Scholar]
- 7.Okada Y, et al. Genetics of rheumatoid arthritis contributes to biology and drug discovery. Nature. 2013 doi: 10.1038/nature12873. doi:nature12873 [pii] 10.1038/nature12873. [DOI] [PMC free article] [PubMed] [Google Scholar]
- 8.Rada-Iglesias A, et al. A unique chromatin signature uncovers early developmental enhancers in humans. Nature. 2010 doi: 10.1038/nature09692. [DOI] [PMC free article] [PubMed] [Google Scholar]
- 9.Kieffer-Kwon KR, et al. Interactome maps of mouse gene regulatory domains reveal basic principles of transcriptional regulation. Cell. 2013;155:1507–1520. doi: 10.1016/j.cell.2013.11.039. doi:S0092-8674(13)01525-0 [pii] 10.1016/j.cell.2013.11.039. [DOI] [PMC free article] [PubMed] [Google Scholar]
- 10.Mousavi K, et al. eRNAs promote transcription by establishing chromatin accessibility at defined genomic loci. Mol Cell. 2013;51:606–617. doi: 10.1016/j.molcel.2013.07.022. doi:S1097-2765(13)00548-0 [pii] 10.1016/j.molcel.2013.07.022. [DOI] [PMC free article] [PubMed] [Google Scholar]
- 11.Hu G, et al. Expression and regulation of intergenic long noncoding RNAs during T cell development and differentiation. Nat Immunol. 2013;14:1190–1198. doi: 10.1038/ni.2712. doi:ni.2712 [pii] 10.1038/ni.2712. [DOI] [PMC free article] [PubMed] [Google Scholar]
- 12.Ciofani M, et al. A validated regulatory network for th17 cell specification. Cell. 2012;151:289–303. doi: 10.1016/j.cell.2012.09.016. doi:S0092-8674(12)01123-3 [pii] 10.1016/j.cell.2012.09.016. [DOI] [PMC free article] [PubMed] [Google Scholar]
- 13.Roychoudhuri R, et al. BACH2 represses effector programs to stabilize T(reg)-mediated immune homeostasis. Nature. 2013;498:506–510. doi: 10.1038/nature12199. doi:nature12199 [pii] 10.1038/nature12199. [DOI] [PMC free article] [PubMed] [Google Scholar]
- 14.Wei L, et al. Discrete Roles of STAT4 and STAT6 Transcription Factors in Tuning Epigenetic Modifications and Transcription during T Helper Cell Differentiation. Immunity. 2010;32:840–851. doi: 10.1016/j.immuni.2010.06.003. doi:10.1016/j.immuni.2010.06.003. [DOI] [PMC free article] [PubMed] [Google Scholar]
- 15.Vahedi G, et al. STATs shape the active enhancer landscape of T cell populations. Cell. 2012;151:981–993. doi: 10.1016/j.cell.2012.09.044. doi:S0092-8674(12)01297-4 [pii] 10.1016/j.cell.2012.09.044. [DOI] [PMC free article] [PubMed] [Google Scholar]
- 16.McAllister K, et al. Identification of BACH2 and RAD51B as rheumatoid arthritis susceptibility loci in a meta-analysis of genome-wide data. Arthritis Rheum. 2013;65:3058–3062. doi: 10.1002/art.38183. doi:10.1002/art.38183. [DOI] [PMC free article] [PubMed] [Google Scholar]
- 17.Franke A, et al. Genome-wide meta-analysis increases to 71 the number of confirmed Crohn's disease susceptibility loci. Nat Genet. 2010;42:1118–1125. doi: 10.1038/ng.717. doi:ng.717 [pii] 10.1038/ng.717. [DOI] [PMC free article] [PubMed] [Google Scholar]
- 18.Sawcer S, et al. Genetic risk and a primary role for cell-mediated immune mechanisms in multiple sclerosis. Nature. 2011;476:214–219. doi: 10.1038/nature10251. doi:nature10251 [pii] 10.1038/nature10251. [DOI] [PMC free article] [PubMed] [Google Scholar]
- 19.Ferreira MA, et al. Identification of IL6R and chromosome 11q13.5 as risk loci for asthma. Lancet. 2011;378:1006–1014. doi: 10.1016/S0140-6736(11)60874-X. doi:S0140-6736(11)60874-X [pii] 10.1016/S0140-6736(11)60874-X. [DOI] [PMC free article] [PubMed] [Google Scholar]
- 20.Cooper JD, et al. Meta-analysis of genome-wide association study data identifies additional type 1 diabetes risk loci. Nat Genet. 2008;40:1399–1401. doi: 10.1038/ng.249. doi:ng.249 [pii] 10.1038/ng.249. [DOI] [PMC free article] [PubMed] [Google Scholar]
- 21.Loven J, et al. Revisiting global gene expression analysis. Cell. 2012;151:476–482. doi: 10.1016/j.cell.2012.10.012. doi:S0092-8674(12)01226-3 [pii] 10.1016/j.cell.2012.10.012. [DOI] [PMC free article] [PubMed] [Google Scholar]
- 22.Jostins L, et al. Host-microbe interactions have shaped the genetic architecture of inflammatory bowel disease. Nature. 2012;491:119–124. doi: 10.1038/nature11582. doi:nature11582 [pii] 10.1038/nature11582. [DOI] [PMC free article] [PubMed] [Google Scholar]
- 23.Beecham AH, et al. Analysis of immune-related loci identifies 48 new susceptibility variants for multiple sclerosis. Nat Genet. 2013;45:1353–1360. doi: 10.1038/ng.2770. doi:ng.2770 [pii] 10.1038/ng.2770. [DOI] [PMC free article] [PubMed] [Google Scholar]
- 24.McLean CY, et al. GREAT improves functional interpretation of cis-regulatory regions. Nature Biotechnology. 2010;28:495–501. doi: 10.1038/nbt.1630. [DOI] [PMC free article] [PubMed] [Google Scholar]
- 25.Morris AP, et al. Large-scale association analysis provides insights into the genetic architecture and pathophysiology of type 2 diabetes. Nat Genet. 2012;44:981–990. doi: 10.1038/ng.2383. doi:ng.2383 [pii] 10.1038/ng.2383. [DOI] [PMC free article] [PubMed] [Google Scholar]
- 26.Ghisletti S, et al. Identification and Characterization of Enhancers Controlling the Inflammatory Gene Expression Program in Macrophages. Immunity. 2010;32:317–328. doi: 10.1016/j.immuni.2010.02.008. doi:10.1016/j.immuni.2010.02.008. [DOI] [PubMed] [Google Scholar]
- 27.Nakayamada S, et al. Early Th1 Cell Differentiation Is Marked by a Tfh Cell-like Transition. Immunity. 2011;35:919–931. doi: 10.1016/j.immuni.2011.11.012. [DOI] [PMC free article] [PubMed] [Google Scholar]
- 28.Wei G, et al. Genome-wide Analyses of Transcription Factor GATA3-Mediated Gene Regulation in Distinct T Cell Types. Immunity. 2011;35:299–311. doi: 10.1016/j.immuni.2011.08.007. [DOI] [PMC free article] [PubMed] [Google Scholar]
- 29.Hawkins RD, et al. Global chromatin state analysis reveals lineage-specific enhancers during the initiation of human T helper 1 and T helper 2 cell polarization. Immunity. 2013;38:1271–1284. doi: 10.1016/j.immuni.2013.05.011. doi:S1074-7613(13)00237-9 [pii] 10.1016/j.immuni.2013.05.011. [DOI] [PMC free article] [PubMed] [Google Scholar]
- 30.Zhang Y, et al. Model-based analysis of ChIP-Seq (MACS) Genome Biol. 2008;9:R137. doi: 10.1186/gb-2008-9-9-r137. doi:gb-2008-9-9-r137 [pii] 10.1186/gb-2008-9-9-r137. [DOI] [PMC free article] [PubMed] [Google Scholar]
- 31.Zang C, et al. A clustering approach for identification of enriched domains from histone modification ChIP-Seq data. Bioinformatics. 2009;25:1952–1958. doi: 10.1093/bioinformatics/btp340. doi:btp340 [pii] 10.1093/bioinformatics/btp340. [DOI] [PMC free article] [PubMed] [Google Scholar]
- 32.Shen L, Shao N, Liu X, Nestler E. Quick mining and visualization of next-generation sequencing data by integrating genomic databases. BMC Genomics. 2014;15:284. doi: 10.1186/1471-2164-15-284. ngs.plot. doi:1471-2164-15-284 [pii] 10.1186/1471-2164-15-284. [DOI] [PMC free article] [PubMed] [Google Scholar]
- 33.Okada Y, et al. Genetics of rheumatoid arthritis contributes to biology and drug discovery. Nature. 2013;506:376–381. doi: 10.1038/nature12873. doi:nature12873 [pii] 10.1038/nature12873. [DOI] [PMC free article] [PubMed] [Google Scholar]
Associated Data
This section collects any data citations, data availability statements, or supplementary materials included in this article.


