

Abstract
NMR spectra of mixtures of metabolites extracted from cells or tissues are extremely complex, reflecting the large number of compounds that are present over a wide range of concentrations. Although multidimensional NMR can greatly improve resolution as well as improve reliability of compound assignments, lower abundance metabolites often remain hidden. We have developed a carbonyl selective aminooxy probe that specifically reacts with free keto and aldehyde functions, but not carboxylates. By incorporating 15N in the aminooxy functional group, 15N-edited NMR was used to select exclusively those metabolites that contain a free carbonyl function while all other metabolites are rejected. Here we demonstrate that the chemical shifts of the aminooxy adducts of ketones and aldehydes are very different, which can be used to discriminate between aldoses and ketoses for example. Utilizing the 2 or 3 bond 15N-1H couplings, the 15N-edited NMR analysis was optimized first with authentic standards and then applied to an extract of the lung adenocarcinoma cell line A549. More than 30 carbonyl containing compounds at NMR detectable levels, 6 of which we have assigned by reference to our database.
As the aminooxy probe contains a permanently charged quaternary ammonium group, the adducts are also optimized for detection by mass spectrometry. Thus, this sample preparation technique provides a better link between the two structural determination tools, thereby paving the way to faster and more reliable identification of both known and unknown metabolites directly in crude biological extracts.
Keywords: 15N-edited 1H NMR, aminooxy derivatives, ketones, aldehydes, metabolomics, chemoselection
Introduction
Although the power of multidimensional NMR experiments in molecular structure elucidation is unparalleled [1-3], many NMR spectral features in metabolomics analysis are unassigned and the determination of low abundance compounds in complex mixtures remains challenging [4, 5]. Furthermore, the large number of metabolites present in biofluids or crude tissue extracts leads to severe spectral overlap even with multidimensional NMR techniques. However, 1H-detected NMR has the unique ability of spectral editing through various magnetic nuclei, so that only those compounds that have a unique atom (such as 31P, [6]) or a specifically introduced 13C or 15N atom will be detected, while all the other compounds are filtered out [7, 8]. Furthermore, NMR chemical shifts and scalar coupling constants are sensitive to isomerization, which is particularly important for identifying sugars that exist in a large number of isomeric forms, for example common hexoses including glucose, galactose, fructose, mannose and their mutarotated forms. These isobaric compounds are difficult to resolve by mass spectrometry, but are readily distinguishable by NMR [4, 9].
A key approach to selecting compounds through isotope filtering is to use post extraction derivatization with an agent that has 1) a unique magnetically active atom, 2) facilitates simple extraction and cleanup, and 3) provides the structural identification of target metabolites through chemical shift and scalar coupling information. Ye et al. have introduced an 15N-labeling method for detecting carboxylates in metabolite mixtures, with high sensitivity (μM range) [10]. However, there are many biological compounds of interest that do not contain a carboxylate function. We are developing chemoselective probes that react with different functional groups that simultaneously introduce a stable isotope (15N or 13C). These probes are designed to enhance selective detection of metabolite functional groups to facilitate structural determination by both NMR (via chemical shift data) and high-resolution MS (via accurate masses or molecular formulae). An important additional benefit is that the adducts are generally more stable than the free metabolite, enabling the detection of labile compounds such as oxaloacetate, 2-oxoglutarate [11] and 4-hydroxynonenal.
Here we demonstrate the use of the aminooxy probes N-(2-15N-aminooxyethyl)-N,N-dimethyl-1-dodecylammonium (QDA) possessing a 15N-enriched aminooxy group (-O15NH2) which reacts chemoselectively and stoichiometrically with the carbonyl group of the target compounds [12-14] (cf Figure 1). The reagent also possesses a quaternary nitrogen atom making the resulting adducts positively charged for enhanced detection sensitivity in mass spectrometry, and a dodecyl tail that renders the adduct extractable in polar organic solvents [12-14]. The aminooxy adducts have the general structure R-O-N=C(R1, R2) where R1 and R2 derive from the target metabolite. Both R1 and R2 are aliphatic groups in ketones, but H and aliphatic groups in aldehydes (cf. Figure 1).
Figure 1. Structure of the 15N-QDA and adducts.

A: 15N- QDA reagent
B: reaction of 15N-QDA with aldehydes and ketones and long range 1H-15N scalar couplings in the oxime adducts.
The 15N label in the QDA adducts enabled analysis by 1H{15N}-HSQC to determine the chemical shifts of the introduced 15N and 1H in the R1 and R1 of the aminooxy adducts of representative metabolites, taking advantage of the 2JNH or 3JNH couplings, measured to be 2-3 Hz [15]. Such long range couplings to 15N have been used in other contexts to analyze both pure nitrogen-containing compounds [16-18] and in complex metabolite mixtures [8], and make use of the absence of 15N-15N couplings. In our standard adducts, we found that the aldehydic proton characteristically resonates near to 7.6 ppm with a 15N shift of ca. 370 ppm from liquid ammonia whereas ketone compounds had 15N shifts 20-30 ppm more shielded than the aldehyde compounds. Furthermore, the chemical shifts of the alkyl protons of the ketones are characteristic of the compound including different isomeric sugars. Thus, 2D 1H-{15N} HSQC experiments can resolve closely related metabolites such as isomeric hexoses and pentoses in mixtures with a sensitivity of < 5 nmole of each 15N adduct. We then applied this technique to selective detection of carbonyl compounds in crude extracts of lung cancer cells.
Results
NMR properties of authentic aminooxy-derivatized standards
Chemical Shifts
The reactivity of carbonyls with the aminooxy QDA tags has been described in detail [12-14]. The chemical structures of 15N-QDA and resultant adduct with carbonyl compounds are shown in Figure 1. As the structure shows, the aminooxy 15N is two or three bonds from the nearest proton in the adduct with the target metabolite, depending on whether it is a ketone or an aldehyde. The two- and three-bond 15N-1H scalar coupling constants are expected to be in the 1-4 Hz range [16, 19], and therefore easily detectable by 15N-edited HSQC in small molecules that have narrow resonances. Because the 15N is at ≈99% abundance in the adducts, only those compounds that have reacted with the 15N-QDA reagent will be detected in a mixture, unless present at very high amounts.
Figure 2A shows representative 1D NMR spectra of 15N-QDA adducts of a mixture of 17 standards, that show the efficiency of the spectral editing, and also demonstrate that the proton resonances that are detected in this experiment belong exclusively to the target metabolite moiety of the adduct, and not to the alky chain of the reagent itself, or to the unreacted 15N-QDA reagent. This is because of the presence of the oxygen atom between the nitrogen and the carbon in the reagent.
Figure 2.
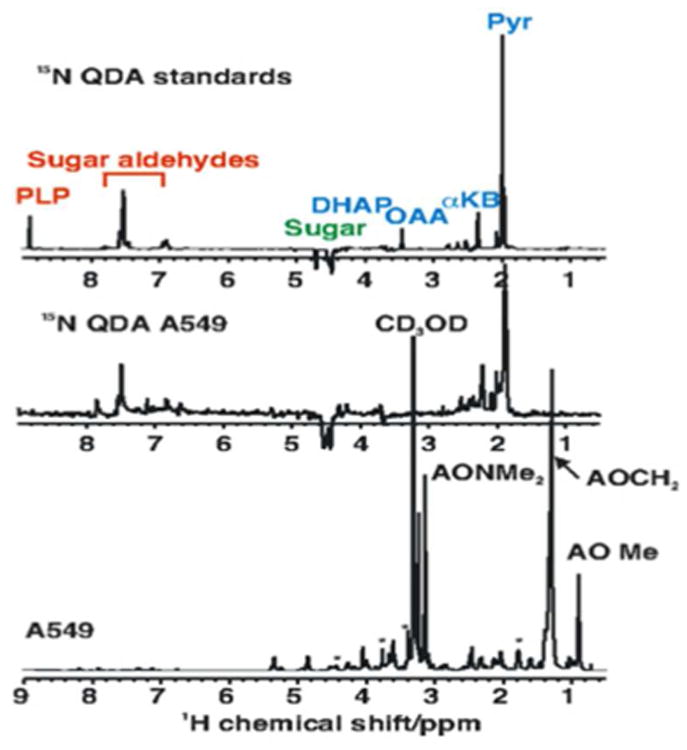
NMR 15N-edited NMR spectra of 15N-QDA adducts of standards and A549 cell extract. The samples were prepared as described in the Experimental Procedures. 1D NMR spectra were recorded at 18.8 T. The 1D 1H-{15N} HSQC spectrum was recorded using an INEPT delay of 3 ms with an acquisition time of 0.5 s and recycle time of 2 s. The 1D unedited spectrum was acquired similarly with an acquisition time of 2 s and a recycle time of 5 s. Total acquisition times were 34 min.
Top : 1D HSQC Spectrum of standards
Middle 1D HSQC Spectrum of the polar extract of A549 cells
Bottom : 1D presat spectrum of the A549 cell extract.
We have generated NMR spectra of 17 standards both individually and as a mixture, and we have fully characterized the relevant 1H, 15N and 13C chemical shifts using TOCSY and HSQC experiments (Table 1). Furthermore, we determined the long-range heteronuclear coupling constants from the multiplet structure in the 1H spectra, which we used to guide the optimization of the INEPT delay in the long-range HSQC experiments. We have characterized the standards in both aqueous solutions and in methanol-d4.
Table 1.
| Compound | Mr | Assignment | 1H/ppm | 15N/ppm | 2JNH or 3JNH Hza | 3JHH Hz |
|---|---|---|---|---|---|---|
| Aldehydes | ||||||
| Arabinose# | 150.13 | H1 | 7.67 | 368.7 | 2.13 | 5.09 |
| H2 | 4.60 | |||||
| Galactose* | 180.16 | H1 | 7.69 | 367.9 | 2.17 | 4.93 |
| H2 | 4.63 | |||||
| Glucose* | 180.16 | H1 | 7.64 | 370.7 | 2.15 | 6.12 |
| H2 | 4.46 | |||||
| Mannose* | 180.16 | H1 | 7.70 | 369.9 | 2.18 | 6.38 |
| H2 | 4.56 | |||||
| Ribose# | 150.13 | H1 | 7.65 | 370.8 | 2.22 | 6.22 |
| H2 | 4.53 | |||||
| erythrose-4-phosphate | 200.084 | H1 | 7.69 | 370.5 | 2.27 | 6.16 |
| H2 | 4.39 | |||||
| pyridoxal phosphate | 247.142 | H3 | 8.74 | 381.8 | 1.5 (3JNH) | |
| glyceraldehyde-3-phosphate | 170.058 | H1 | 7.67 | 369.8 | 2.25 | 5.15 |
| H2 | 4.51 | |||||
| Ketones | ||||||
| Xylose# | 150.13 | H1 | 7.66 | 369.5 | 2.15 | 5.62 |
| H2 | 4.46 | |||||
| Acetone | 58.08 | Me | 1.91 | 345.9 | 2 | - |
| Fructose* | 180.16 | H1 | 5.21 | |||
| H3 | 4.44,4.40 | 355.5 | 3.2 | |||
| Pyruvate | 87.06 | H3 | 2.01 | 337.2 | 3.9 | |
| 2.03 | 340.9 | 1.9 | ||||
| 2-oxobutanoate | 101.08 | H3 | 2.37 | 336.9 | 3.5 | |
| H3 minor | 2.52 | 333.4 | ||||
| 2-oxoglutarate | 146.1 | H3 | 2.59 | 340.8 | 3.5 | |
| H3 minor | 2.74 | 338.5 | ||||
| oxalacetate | 132.07 | H3 | 3.43 | 345.7 | ≈1 | |
| H3 minor | 3.21 | 345.0 | ||||
| dihydroxyacetone phosphate | 170.058 | H3 | 4.69, 4.36 | 357.1 | 1.5 | 7.9 |
| H1 | 4.47 | 359.4 |
isomeric pentoses;
isomeric hexoses
As described above, the protons observed belong to the target metabolite. The chemical shifts of the aminooxy nitrogen and the coupled protons are very characteristic, and differ significantly between aldoses and ketoses. The 15N chemical shifts of the standards were determined from 2D long-range 1H{15N}-HSQC experiments, as shown in Figure 3. These nitrogen shifts varied substantially among biological compounds. The 15N resonance of the free aminooxy compound in contrast is found at +97 ppm with respect to tetramethylammoniumchloride in CDCl3 (Fig S1C). This is +140.8 ppm from external liquid NH3 [20, 21] for comparison with the QDA adducts measured in water or methanol indirectly referenced to liquid ammonia at 0 ppm. Furthermore the aldehydic proton is greatly deshielded in the adduct compared with the parent metabolite. For example the H1α of free glucose resonates at 5.22 ppm from DSS under these conditions whereas in the adduct, it resonates at 7.64 ppm, reflecting both the forcing of the pyranose into a straight chain form, and the formation of the C1-N double bond in the adduct.
Figure 3. Long range 1H{15N} HSQC of a mixture of standard 15N-QDA adducts.
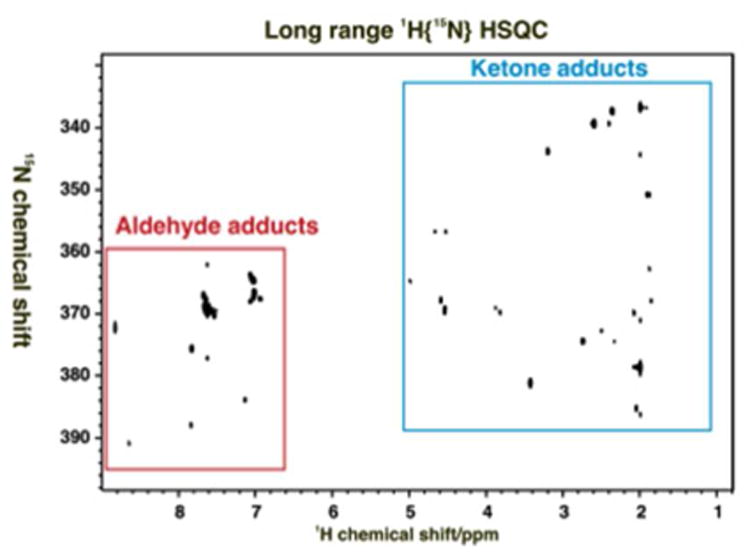
The mixture of 17 standards was dissolved in phosphate buffer. The 15N HSQC spectrum was recorded at 20 °C 18.8 T with acquisition times of 0.15 s in t2 and 0.016 s in t1. The data tables were zero filled once in each dimension and apodised using an unshifted Gaussian function and 1 Hz line broadening exponential. The JNH INEPT delay was set to 83.3 ms.
15N chemical shifts were referenced indirectly with respect to external liquid ammonia [20].
Red and cyan boxes shows resonances from aldehydes and ketones, respectively.
The 15N and scalar coupled protons shifts are not only very sensitive to the formation of the imine, but also these shifts are strongly correlated, as shown in Figure 4, which shows a remarkable range of both 15N and 1H chemical shifts for this group of compounds.
Figure 4. Correlation of 1H and 15N chemical shifts for 15N-QDA adducts of standards.
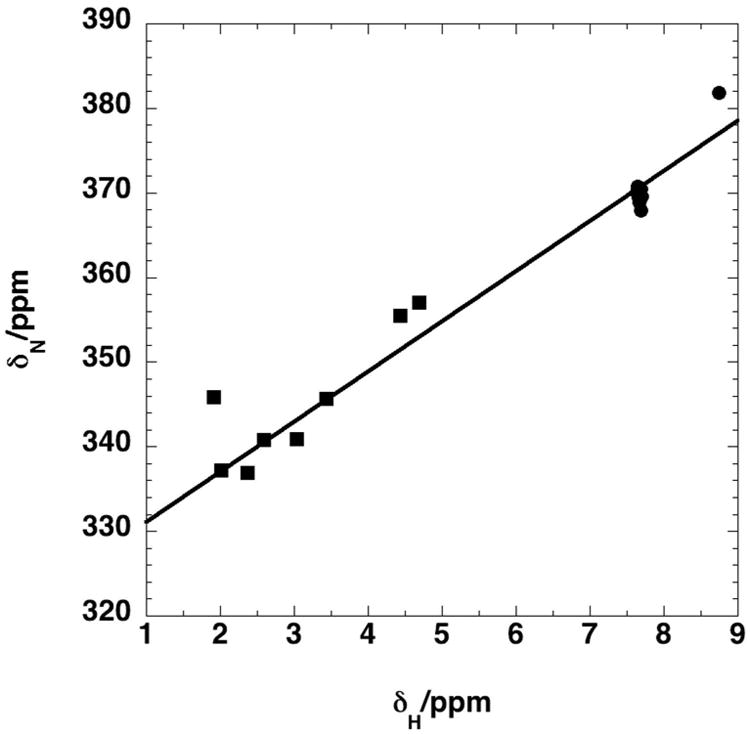
Chemical shifts of the 15N-QDA adducts were determined at 20 °C as described in the Experimental Procedures. 15N chemical shifts were referenced indirectly with respect to external liquid ammonia [20].
squares : ketones, circles : aldehydes
δN= 325.1±1.59+5.94±0.26 δH r2=0.975 (n=16).
2JNH (aldehydes) = 2.11±0.2 Hz
3JNH (ketones) = 2.64±1.1 Hz
Ketones and aldehydes are readily distinguished based on their 1H and 15N chemical shifts.
As Figure 1 indicates, the adducts can exist in two isomeric forms, E and Z with respect to the double bond (Figure 1B). This gives rise to two sets of resonances for aldehydes and unsymmetric ketones, corresponding to the major and minor isomers. The chemical shifts in Table 1 correspond to the major isomer. The ratios of the isomers ranged from >10:1 to ≈1 depending on the compound, attributable in part to steric hindrance in the Z aldoximes where the R′ group is bulky.
The chemical shifts of the adducts are also sensitive to the solvent. We recorded 1D 15N-edited 1H spectra in 100% MeOD, which can help dissolve adducts of less polar metabolites such as lipid aldehydes. The resolution of the compounds by 2D NMR 15N-edited HSQC is good in this solvent (cf. Fig. 5, Figs S3, S4).
Figure 5. 1H{15N} HSQC spectra of QDA* adducts of an extract of A549 cells.
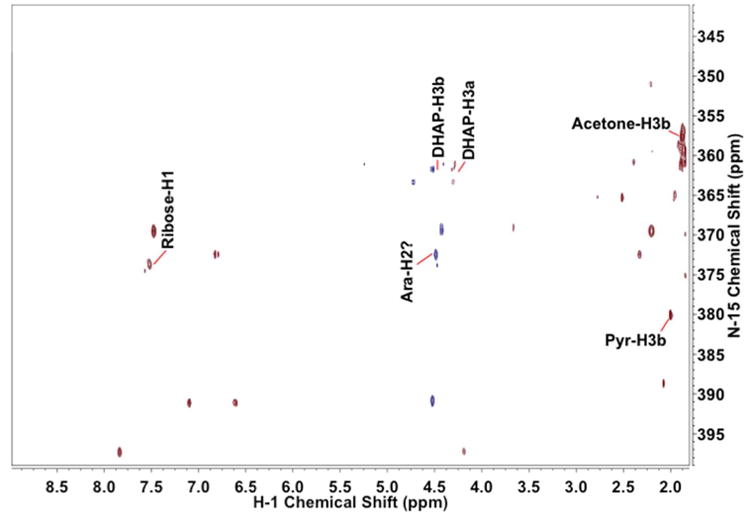
The A549 polar extract was prepared and derivatized as described in the Experimental Procedures. The dried sample was redissolved in 100% CD3OD. HSQC spectra were recorded at 14.1 T with acquisition times of 0.5 s in t2 and 25.6 ms in t1. The data tables were zero filled once in t2, linear predicted once in t1 and zero filled to 8192×2048 points. The free induction decays were processed using an unshifted Gaussian and a line broadening exponential of 4 Hz in both dimensions. 15N chemical shifts were referenced indirectly with respect to external liquid ammonia [20].
Some assignments are shown on the figure.
Of particular note is that the proton shifts of the adducts reflect the target compound, and not the tag itself, and the 15N and 1H shifts are very sensitive to the specific compound. Thus, aldehydes have very different shifts for those of carbonyls (cf Fig. 3, S3), making it especially simple to differentiate between ketoses and aldoses.
Coupling constants
Long range 15N-1H coupling constants were estimated from the optimized INEPT delay in the HSQC experiment (Fig S2), and more accurately from the additional 15N splitting of the multiplets in the 1H spectrum. The measured coupling constants are given in Table 1. The two-bond coupling constants did not vary much (<10%) among the adducts : 2JNH (aldehydes) = 2.1±0.2 Hz. In contrast, the 3-bond coupling constants are much more sensitive to stereoelectronic effects, as expected : 3JNH (ketones) = 2.6±1.1 Hz.
The coupling constants determined by analyzing the proton multiplet structures are about 25% smaller than those estimated from the optimization of the INEPT delay in the HSQC experiment, which we attribute to transverse relaxation and other processes that occur during the long INEPT period.
Sensitivity
We determined the sensitivity of the 15N-edited 1D HSQC experiment using the pyruvate adduct. Different concentrations of the adduct were measured under optimized spectroscopic conditions at 14.1 T on a cold 5 mm inverse triple resonance pfg HCN probe. Using a Shigemi tube to limit the amount of material needed, we found that the pyruvate methyl groups could be detected with a signal to noise ratio of 10 or greater in 30 minutes at a solute amount of 2 nmol. Using a 1.7 mm cryomicroprobe with an active volume of < 50 μL or a 3 mm coldprobe with an active volume of < 100 μL, the detection limit should be 3-5 fold lower with the same acquisition time.
Although QDA was found to react readily with majority of the standards (in minutes), the rate of the reaction with carbohydrates was much slower. In fact the reaction of equimolar glucose and aminooxy reagent in water at RT yielded only approximately 20% conversion after 24 h (data not shown). This may be because only a small fraction (below 1%) of each carbohydrate exists in the open-chain (aldehyde or ketone) form at equilibrium [22]. To increase the rate of formation of the adduct, as well as the yield, we lowered the pH to 4 with acetic acid and increased the temperature to 40 °C. Even with these reaction conditions, it was necessary to carry out the reaction for over 24 h to achieve near 100% yield.
Application to A549 cell extracts
We have applied the 15N-QDA derivatization to polar extracts of cultured A549 lung cancer cells. The cells were grown to 70% confluence, and denatured directly on the plate with cold acetonitrile containing the 15N-QDA reagent (see Experimental Procedures). This process lyzes the cells, quenches metabolism and allows the capture of labile carbonyl compounds by rapid reaction with the reagent. 15N edited HSQC spectra of such an extract of the A549 cells are shown in Figures 2 and 5. The editing clearly selects a subset of carbonyl containing-compounds, many of which are at relatively low abundance, and hidden under the resonance of numerous other compounds in the unedited spectrum. There are more than 30 N-H peaks in this spectrum, and group into the aldehydes (6-8 ppm), and ketones (1-5 ppm) (cf. Figure 3). However, only 6 compounds have been positively identified by reference to our (limited) database, indicating that these cells contain a substantial number of both aldehydes and ketones at high abundance that are not represented in our currently small database of common carbonyl metabolites.
Discussion
The aminooxy reagent that we have developed reacts rapidly and stoichiometrically with a wide variety of carbonyl containing compounds, including chemically unstable ones such as oxaloacetate. The rate of reaction for pyranoses and furanoses however was slower, attributable in part to the slow opening of the ring to generate the reactive aldehyde or ketone that is present at low abundance. The adducts of these compounds are much more stable than the free compound, improving the reliability both of detection and of quantification in tissue or cell extracts. In the major metabolite databases, ketone is one of the top five most distinguishing functional groups. In HDMB3.5 [23], there are over 4600 keto and 880 aldehydic metabolites out of roughly 40400 entries in the database. Likewise, the Kyoto Encyclopedia of Genes and Genomes (KEGG) Compound 2014 [24] contains over 3300 keto and 460 aldehydic entries out of roughly 16400 total entries. However, many of these are at low abundance, and each tissue type will only contain a subset of the total, which includes compounds from various organisms and tissue types.
We detected 30 metabolites in an extract of A549 cells by NMR; many more can be detected by high sensitivity FT-ICR-MS. Nevertheless, the more abundant NMR-detectable carbonyl-containing compounds represent central metabolism and monosaccharides isomers that are difficult to resolve by mass spectrometry. With current technology, the sensitivity limit is in the range 1-5 nmol of each compound, which may improve to the sub nmol level by using 1.7 mm or 3 mm cryomicroprobes at very high magnetic field strength. Of the 30 compounds detected, presently only 6 have been identified, but with the aid of the MS and the informatics analysis, we expect to identify many more. Additional NMR experiments, such as HSQC-TOCSY (cf Fig S3B) and 15N-edited TOCSY (Fig. S4) provide further chemical shift and covalent connectivity information that help assign compounds in mixtures [4, 8].
The chemoselective approach shows the power of isotope editing of complex spectra, as metabolites that are normally hidden under other resonances or at low abundance are selected. The chemical shifts are characteristic of the metabolites adducts which also make it possible to resolve structural isomers, such as the hexoses, which is otherwise difficult by mass spectrometry alone. Furthermore, the large difference in spectral properties of aldehydes and ketones immediately provides valuable information about the class of compound present, as shown by the ketose and aldose sugars.
As NMR is intrinsically quantitative, and stable isotope standards can be prepared simply, this supplies a means of quantification of the compounds in crude extracts by NMR or MS. Furthermore, the ability to assign and quantify metabolites in crude extracts is expected to be greatly enhanced by complementing NMR with high-resolution MS (e.g. FT-MS) analysis of the same tagged extracts. NMR provides functional group and covalent linkage information and is intrinsically quantitative, while FT-MS readily yield molecular formula information on intact metabolites and their mass fragments. Together, it is feasible not only to rigorously assign known metabolites but also to perform de novo structural elucidation of unknown metabolites. The basic principles can be extended to other chemical functionalities, including –SH [25] amino[26] and carboxyl [10] with 15N or 13C labeling. Such functional group mapping with multiple chemoselective agents will be synergistic in facilitating large-scale structural analysis of metabolites.
Experimental Procedures
N-(2-15N-aminooxyethyl)-N,N-dimethyl-1-dodecylammonium bromide (15N-QDA) was prepared using a modification of previous methods to introduce a single 15N atom deriving from 15N-ammonia. 15N-Labeled N-hydroxyphthalimide 1 was prepared according to the literature procedure from commercially available 15N-hydroxylamine•HCl.[27] The Mitsunobu-based coupling of 1 with ammonium alcohol 2, formed from N,N-dimethylethanolamine, proceeded according to the method of Grochowski [28] to provide labeled phthalimide 3. Hydrazinolysis gave the labeled aminooxy probe 15N-QDA in good yield. 15N-NMR spectroscopy of labeled QDA confirmed installation of an aminooxy nitrogen label [Supplementary Materials, Fig. S1C].
Preparation of standards and metabolite mixtures
Reagents
All metabolite standards: arabinose, galactose, glucose, mannose, ribose, erythrose-4-phosphate, pyridoxal phosphate, xylose, acetone, fructose, pyruvate, 2-oxobutanoate, 2-oxoglutarate, oxalacetate, dihydroxyacetone phosphate, as well as glacial acetic acid (AcOH) and methanol (MeOH) (Optima grade) were purchased from Sigma Aldrich (St. Louis, MO). 18 MΩ water was obtained using the ultrapure water system (Barnstead, Dubuque, IA).
Preparation of standards
40 μL of 10 mM aqueous solutions of each of the 15 standards individually and together were mixed with 600 μL of a 10 mM solution of 15N-QDA in 18 MΩ H2O and left to react at 4 °C for 3 hours. After that, the mixture was acidified to pH ∼ 4 with acetic acid (effective 5 mM concentration) and the reaction was continued at 40 °C for 24 hours. For MS detection, 5 μL of the mixture was diluted 20-fold with 0.1% acetic acid in methanol. The rest of the reaction mixture was freeze-dried and dissolved in 0.35 mL 50 mM potassium phosphate, 50 mM KCl pD 7.4, + 0.1 mM DSS-d6.
Preparation of A549 cell extracts
Human lung adenocarcinoma A549 cells were grown on 15 cm plates in DMEM medium and incubated at 37 °C in a 5% CO2 atmosphere for 24 h. The medium was aspirated and the cells washed 3 times with cold PBS. The cells were then quenched with ice-cold 0.3 mM 15N-QDA solution in acetonitrile (ACN) [29]. The plates were scraped and the cells collected and shaken with 3 glass beads to further disrupt cells and extract metabolites. After centrifugation the polar fraction was left to react with 15N-QDA at 4 °C for 3 h. The mixture was then acidified to pH ∼ 4 with AcOH (5 mM) and the reaction was continued at 40 °C for 24 hours. Finally, the reaction mixture was freeze-dried and the sample was redissolved in 0.35 mL 50 mM potassium phosphate, 50 mM KCl pD 7.4, + 0.1 mM DSS-d6 for NMR. For FTICR-MS confirmation a small aliquot of the reaction mixture (about 1/32 of the total) was freeze-dried and dissolved in 200 μL of 0.1% acetic acid in MeOH.
FTICR-MS Analysis
All samples were validated by direct infusion high-resolution mass spectrometry using a hybrid LTQ–FT-ICR mass spectrometer (LTQ–FT, Thermo Electron, Bremen, Germany) equipped with a Triversa Nanomate nanoESI ion source (Advion Biosciences, Ithaca, NY). Data were acquired in the positive ion mode. The instrument was calibrated according to manufacturer protocols and tuned for the MRFA standard (LTQ, m/z nominal – 524). Triversa Nanomate was operated at 1.5 kV and 0.5 psi head pressure, which yielded the most stable spray conditions. The FT-ICR traces were acquired in mass range from 150 Da to 1000 Da with a target mass resolution of 100,000 at 400 m/z with five microscans acquired for each saved spectrum.
NMR spectroscopy
Individual adducts of standards and mixtures were analyzed by NMR spectra recorded on a Varian Inova NMR spectrometer at 18.8 T as 1D proton, TOCSY and 1H{13C} HSQC for assignments, along with 1D and 2D 1H{15N} HSQC and HSQC-TOCSY (Fig S3B). Proton shifts were referenced to internal DSS d6, and 15N shifts by indirect referencing to the DSS [20]. The HSQC delay was optimized to the observed 2 or three bond N-H couplings (ca. 150 ms). The 15N excitation was set to the middle of the spectral range near 360 ppm. The coupling constants were determined directly from splitting of coupled protons in unedited 1H spectra, and the optimized delays for the long range HSQC spectra were determined based on the couplings and maximizing the intensity as a function of the INEPT delay. 1H spectra acquired in methanol d4 were referenced to the CD2H resonance at 3.31 ppm.
Supplementary Material
Acknowledgments
This work was supported in part by grants NIEHS R01ES022191-01 (TWMF, MHN, RMH), NIH 1 U24 DK097215-01A1 (RMH, TWMF, ANL), P01CA163223-01A1 (ANL, TWMF) and the Kentucky Challenge for Excellence (ANL).
References
- 1.Kuszewski J, Schwieters CD, Garrett DS, Byrd RA, Tjandra N, Clore GM. Journal of the American Chemical Society. 2004;126:6258. doi: 10.1021/ja049786h. [DOI] [PubMed] [Google Scholar]
- 2.Oschkinat H, Griesinger C, Kraulis PJ, Sorensen OW, Ernst RR, Gronenborn AM, Clore GM. Nature. 1988;332:374. doi: 10.1038/332374a0. [DOI] [PubMed] [Google Scholar]
- 3.Mumenthaler C, Guntert P, Braun W, Wuthrich K. Journal of Biomolecular Nmr. 1997;10:351. doi: 10.1023/a:1018383106236. [DOI] [PubMed] [Google Scholar]
- 4.Fan TWM, Lane AN. In: Methodologies for Metabolomics: Experimental Strategies and Techniques. Lutz N, Sweedler JV, Weevers RA, editors. Cambridge University Press; Cambridge: 2012. [Google Scholar]
- 5.Fan TW, Lane AN. Progress in NMR Spectroscopy. 2008;52:69. [Google Scholar]
- 6.Gradwell MJ, Fan TWM, Lane AN. Analytical Biochemistry. 1998;263:139. doi: 10.1006/abio.1998.2789. [DOI] [PubMed] [Google Scholar]
- 7.Lane AN. In: Handbook of Metabolomics. Fan TWM, Lane AN, Higashi RM, editors. Humana; 2012. [Google Scholar]
- 8.Fan TWM, Lane AN. J Biomolec NMR. 2011;49:267. doi: 10.1007/s10858-011-9484-6. [DOI] [PMC free article] [PubMed] [Google Scholar]
- 9.Hobley P, Howarth O, Ibbett RN. Magnetic Resonance in Chemistry. 1996;34:755. [Google Scholar]
- 10.Ye T, Mo HP, Shanaiah N, Gowda GAN, Zhang SC, Raftery D. Analytical Chemistry. 2009;81:4882. doi: 10.1021/ac900539y. [DOI] [PMC free article] [PubMed] [Google Scholar]
- 11.Laplante A, Comte B, Des Rosiers C. Anal Biochem. 1995;20:584. doi: 10.1006/abio.1995.1090. [DOI] [PubMed] [Google Scholar]
- 12.Mattingly SJ, Xu T, Nantz MH, Higashi RM, Fan TWM. Metabolomics. 2012;8:989. doi: 10.1007/s11306-011-0395-z. [DOI] [PMC free article] [PubMed] [Google Scholar]
- 13.Li M, Biswas S, Nantz MH, Higashi RM, Fu XA. Anal Chem. 2012;84:1288. doi: 10.1021/ac2021757. [DOI] [PubMed] [Google Scholar]
- 14.Fu X, Li M, Biswas S, Nantz MH, Higashi RM. Analyst. 2011;136:4662. doi: 10.1039/c1an15618g. [DOI] [PubMed] [Google Scholar]
- 15.Martin GE, Williams AJ. In: Annual Reports on Nmr Spectroscopy, Vol 55. Webb GA, editor. Vol. 55. 2005. p. 1. [Google Scholar]
- 16.Martin GE, Hadden CE. Journal of Natural Products. 2000;63:543. doi: 10.1021/np9903191. [DOI] [PubMed] [Google Scholar]
- 17.Marek R, Marek J, Dostal J, Taborska E, Slavik J, Dommisse R. Magnetic Resonance in Chemistry. 2002;40:687. [Google Scholar]
- 18.Williamson RT, Buevich AV, Martin GE. Tetrahedron Letters. 2014;55:3365. [Google Scholar]
- 19.Crouch RC, Llanos W, Mehr KG, Hadden CE, Russell DJ, Martin GE. Magnetic Resonance in Chemistry. 2001;39:555. [Google Scholar]
- 20.Wishart DS, Bigam CG, Yao J, Abildgaard F, Dyson HJ, Oldfield E, Markley JL, Sykes BD. Journal of Biomolecular NMR. 1995;6:135. doi: 10.1007/BF00211777. [DOI] [PubMed] [Google Scholar]
- 21.Harris RK, Becker ED, Cabral De Menezes SM, Goodfellow R, Granger P. Pure Appl Chem. 2001;73:1795. [Google Scholar]
- 22.Robyt JF. Essentials of Carbohydrate Chemistry. Springer; New York: 1998. [Google Scholar]
- 23.Wishart DS, Jewison T, Guo AC, Wilson M, Knox C, Liu YF, Djoumbou Y, Mandal R, Aziat F, Dong E, Bouatra S, Sinelnikov I, Arndt D, Xia JG, Liu P, Yallou F, Bjorndahl T, Perez-Pineiro R, Eisner R, Allen F, Neveu V, Greiner R, Scalbert A. Nucleic Acids Research. 2013;41:D801. doi: 10.1093/nar/gks1065. [DOI] [PMC free article] [PubMed] [Google Scholar]
- 24.Kanehisa M, Goto S, Sato Y, Kawashima M, Furumichi M, Tanabe M. Nucleic Acids Res. 2014;42 doi: 10.1093/nar/gkt1076. [DOI] [PMC free article] [PubMed] [Google Scholar]
- 25.Gori SS, Lorkiewicz PK, Ehringer DS, Belshoff AC, Higashi RM, Fan TWM, Nantz MH. Analytical & Bioanalytical Chemistry. 2014;406:4371. doi: 10.1007/s00216-014-7810-z. [DOI] [PMC free article] [PubMed] [Google Scholar]
- 26.Guo K, Li L. Anal Chem. 2009;81:3919. doi: 10.1021/ac900166a. [DOI] [PubMed] [Google Scholar]
- 27.Zhao TT, Lu X, Yang XH, Wang LM, Li X, Wang ZC, Gong HB, Zhu HL. Bioorganic & Medicinal Chemistry. 2012;20:3233. doi: 10.1016/j.bmc.2012.03.057. [DOI] [PubMed] [Google Scholar]
- 28.Grochowski E, Jurczak J. J Synthesis. 1976;682 [Google Scholar]
- 29.Fan TW. Handbook of Metabolomics. 2012;17 [Google Scholar]
Associated Data
This section collects any data citations, data availability statements, or supplementary materials included in this article.