

Abstract
Rare maternally inherited duplications at 15q11-13 are observed in about 1% of individuals with an Autism Spectrum Disorder (ASD), making it among the most common causes of ASD. 15q11-13 comprises a complex region, and because this CNV encompasses many genes, it is important to explore individual genotypephenotype relationships. Cytoplasmic FMR1 interacting protein 1 (CYFIP1) is of particular interest because of its interaction with FMRP, its upregulation in transformed lymphoblastoid cell lines from patients with duplications at 15q11-13 and ASD, and the presence of smaller overlapping deletions of CYFIP1 in patients with schizophrenia and intellectual disability. Here, we confirm that CYFIP1 is upregulated in transformed lymphoblastoid cell lines, and demonstrate its upregulation in postmortem brain from 15q11-13 duplication patients for the first time. To investigate how increased CYFIP1 dosage might predispose to neurodevelopmental disease, we studied the consequence of its overexpression in multiple systems. We show that overexpression of CYFIP1 results in morphological abnormalities including cellular hypertrophy in SY5Y cells and differentiated mouse neuronal progenitors. We validate these results in vivo by generating a BAC transgenic mouse, which over-expresses CYFIP1 under the endogenous promotor, observing an increase in the proportion of mature dendrite spines and dendritic spine density. Gene expression profiling at embryonic day 15 suggested dysregulation of mTOR signaling, which was confirmed at the protein level. Importantly, similar evidence of mTOR-related dysregulation was seen in brains from 15q11-13 duplication patients with ASD. Finally, treatment of differentiated mouse neuronal progenitors with an mTOR inhibitor (rapamycin) rescued the morphological abnormalities resulting from CYFIP1 overexpression. Together, these data show that CYFIP1 overexpression results in specific cellular phenotypes, and implicate modulation by mTOR signaling, further emphasizing its role as a potential convergent pathway in some forms of ASD.
Keywords: CYFIP1, Autism, Fragile X syndrome, neural progenitor cells, signaling
Introduction
Autism spectrum disorder (ASD) is a common and heterogeneous neuropsychiatric condition with deficits in social interactions and language development in addition to the presence of repetitive behavior and restricted interests [1]. ASD is considered a developmental brain disorder and recent studies have identified a number of rare and common variants that may contribute to etiology [2-11]. One of the most consistently reported genomic aberrations associated with ASD is duplication at chromosome 15q11-13 ((Dup)15q11-13) occurring in about 1% of cases [12-16]. Deletions at this same region give rise to Prader-Willi or Angelman syndrome based on parent of origin [17]. In all cases, instability of this region is mediated by three sets of low copy repeats (BP1, BP2, and BP3) that leads to alternative yet reproducible breakpoints [18]. Although previous work on 15q has focused largely on the imprinted BP2-BP3 region, there is evidence to suggest that one or more genes in the more proximal non-imprinted BP1-BP2 interval, and CYFIP1 in particular, merit additional investigation. First, among individuals with deletions or gains at 15q11-13, those harboring larger events that include CYFIP1 are typically most severely impacted [19, 20]. Second, consistent with a genomic imbalance model [21], smaller “BP1-BP2” deletions encompassing CYFIP1 and three other genes are associated with developmental delay [22-25], epilepsies [26] and schizophrenia [27, 28]. Third, CYFIP1 was first identified as a protein that interacts with Fragile X mental retardation protein (FMRP) [29], which when mutated, causes Fragile X syndrome, another monogenic form of ASD [30]. Finally, CYFIP1 is upregulated in transformed lymphoblastoid cell lines from patients with (dup)15q11-13 and ASD [31] and reduced in individuals with fragile X syndrome and ASD[32].
CYFIP1 has two known functions: regulating actin cytoskeletal dynamics [33], and repressing translational initiation [34]. CYFIP1 regulates the cytoskeleton through its competitive inhibition of interactions between FMRP and the small GTPase RAC1, which is implicated in the development and maintenance of neuronal structures [35, 36]. CYFIP1 regulates translation at the synapse through binding to Eukaryotic translation initiation factor 4E (eIF4E) in a complex with FMRP [34]. Work in Drosophila melanogaster [33] indicates that null alleles are associated with abnormalities in neuronal morphology. No work, however, has been done in any mammalian system to look at the impact of ASD-relevant increases in CYFIP1 gene dosage.
Here we show that CYFIP1 is increased in the brains of individuals with 15q11-13 duplications and ASD. We also generated a BAC transgenic mouse model and investigated the consequences of CYFIP1 over-expression in vitro and in vivo. We identified consistent abnormalities of cell morphology including increased cell size, changes in neurite outgrowth, and increased spine density on pyramidal neurons in the cerebral cortex of adult transgenic mice. This is consistent with previous work in mice with mutations in proteins involved in the same neuronal translation pathways, FMR1 and 4E-BP2 [35,36], which have either increased spine density or immature spines. Additionally, analysis of post mortem brain dendritic morphology also suggests that spine density is increased in some cases of ASD [34]. To begin to untangle the molecular pathways responsible for these pathological alterations, we performed gene expression analysis in embryonic mouse brain, identifying an enrichment for genes involved in mTOR-related signaling in transgenic mouse brain. We confirmed mTOR dysregulation in post mortem brain from individuals with 15q11 duplications and ASD. We next hypothesized that Cyfip1 overexpression might impact cellular morphology through mTOR, which we tested via mTOR inhibition with rapamycin. Remarkably, we observed that rapamycin rescued the morphologic abnormalities in differentiated mouse neuronal progenitors (dMNPs). We also show that CYFIP1 and p-S6 are increased in the brains of individuals with 15q11-13 duplications and ASD, consistent with mTOR pathway activation in these individuals. Our demonstration of pathological consequences resulting from CYFIP1 overexpression, both in vitro and in vivo, identify for the first time a modulatory mechanism that may be of clinical utility.
Materials and Methods
Animals
Mice harboring a Cyfip1 spanning BAC clone (RP24-333C15) were generated in the UCLA transgenic core (http://tmc.ctrl.ucla.edu/tg-core/) by injection into C57BL/6J pronuclei using standard protocols [37, 38]. DNA was prepared using a cesium chloride gradient, and checked for integrity by pulsed field gel electrophoresis. DNA was then microinjected into fertilized C57BL/6J pronuclei, which were implanted in the oviduct of pseudopregnant recipient female mice. Six potential founders were identified by screening tail DNA using transgene-specific primers (see Table S3). For the two founders found to give rise to transgene positive animals (Tg#8 and Tg#24), breeding colonies were established by backcrossing to C57BL/6J animals. Assessment of Cyfip1 levels at each generation determined that transgenic mice failed to overexpress the protein at N4 and beyond, despite confirmed genotype and increased copy number. This was true for each of the two lines generated. To address this issue we not only restricted all experiments and analyses to N2 and N3 mice but also focused on abnormalities observed both in vivo and in vitro. Animals were kept on a 12 hr light/12 hr dark cycle with free access to food and water. All procedures involving animals were performed in accordance with a protocol approved by the UCLA Animal Research Committee.
Histopathology
Mice were anesthetized with nembutal, and then transcardially perfused with PBS, followed by fixative (4% paraformaldehyde in PBS, pH 7.4). For Golgi staining, perfused brains were ultimately embedded in OCT as above and sectioned coronally at 60μm with a cryostat (Leica). For Hemotoxylin and Eosin (H/E) staining, fixed brains were embedded in paraffin and 7μm transverse sections obtained. Cell morphological tracing and quantitation of processes were carried out using Adobe Photoshop CS3 and NeuroMath [39]. Morphological and developmental spine characterization was carried out using standard methods [40-42]. Cell/tissue staining and morphological analysis details were described in the supplemental methods.
Cell Culture
6×10⁶ SY5Y cells were seeded in a T-75 flask in 20 ml of DMEM (Invitrogen) with 10% FBS (Gibco, NY, USA). Cell differentiation and transfection were carried out as described previously [31] and as described in the supplemental methods. MNPs were cultured for 2 days, infected with lentiviral constructs, and then differentiated for 14 days. Rapamycin and DMSO (vehicle) were purchased from Sigma-Aldrich.
Patient Materials
Seven ASD individuals with maternally derived CYFIP1 containing 15q11-13 duplications and six typically developing non-carrier controls were identified within the Autism Genetic Resource Exchange (AGRE) [31, 43, 44], Non-AU samples from Dr. N. Schanen (http://www.bio.udel.edu/users/cschanen) and frozen aliquots of EBV transformed lymphoblastoid cell lines were acquired (Supplemental Material, Table S1). Total RNA from lymphoblastoid cell lines, seeded at 9 × 10^6 and harvested 24 hours later, was obtained using the RNeasy Mini system with DNase treatment (Qiagen). RNA quantity and quality were measured with a ND-100 (Nanodrop) and Bioanalyzer 2100 (Agilent), respectively. Three separate individual with ASD with maternally derived CYFIP1 containing 15q11-13 duplications and five typically developing non-carrier controls were identified from the Autism Tissue Program cohort organized by Autism Speaks and the Harvard Brain Bank [45]; tissue samples from the superior temporal gyrus (STG, also known as Brodmann’s area 41/42) were obtained (Supplemental Material, Table S2). RNA was obtained using the miRNeasy kit (Qiagen) and quantity and quality assessed as described above. Clinical information for all cases is available from AGRE and the ATP, respectively.
qPCR
cDNA was generated from total RNA using random hexamers and Superscript III (Invitrogen, NY, USA). Real-time PCR was conducted on an HT-7900 (Applied Biosystems, Foster City, CA, USA) with Sybr-Rox SuperMix (Bio-Rad, Hercules, CA, USA) using published methods [31, 46, 47]. Intron-spanning primers are detailed in Supplemental Material (Table S3).
Western Blotting
Western Blotting was performed by the modified of standard methods[48] and details were described in the supplemental methods.
Microarray Gene Expression Profiling
Microarray profiling was performed as previously described [49, 50]. Briefly, total RNA was isolated from embryonic day 15 frontal cortex from Tg#8 transgenic animals (n=3) and littermate controls (n=3) using the Qiagen RNeasy Kit. RNA quantity and quality was assessed using a Nanodrop spectrophotometer (Nanodrop Technologies) and the Agilent Bioanalyzer (Agilent Technologies), respectively. Total RNA (200ng) was amplified, biotinylated and hybridized on Illumina Mouse ref-8 v2.0 BeadChip arrays, querying the expression of ~25,600 well-annotated Refseq transcripts, as per the manufacturer’s protocol. Slides were scanned using Illumina BeadStation and signals extracted using Illumina BeadStudio software (Illumina, San Diego CA). Raw data were analyzed using Bioconductor packages (www.bioconductor.org). Quality-control analysis was performed using several indices including inter-array Pearson correlation, clustering based on variance, and the mean absolute deviation (MAD) using the top 1000 most variant probes [50]. Data were normalized using quantile normalization. Analysis of differential expression was performed using linear model fitting (LIMMA package). After linear model fitting, a Bayesian estimate of differential expression was calculated using a p-value threshold of 0.01. Pathway analyses were performed using DAVID Bioinformatics online tools (Database for Annotation, Visualization and Integrated Discovery; http://david.abcc.ncifcrf.gov/) and the Ingenuity Pathway Analysis System (IPA: Ingenuity® Systems, www.ingenuity.com). Raw and normalized expression data have been deposited in NCBI’s Gene Expression Omnibus [51] and are accessible through GEO Series accession number GSE40852.
Statistical Analysis
All results are expressed as mean ±SEM. Western blots, qPCRs, and neuronal morphology comparisons between groups were analyzed with ANOVA.
Results
Increased gene dosage at 15q11-13 is associated with increased CYFIP1 levels in transformed lymphoblastoid cells and postmortem brain
Prior to initiating mechanistic work in model systems, we sought to further validate the extent to which CYFIP1 was upregulated in autistic probands with (dup)15q11-13. We conducted qPCR on transformed lymphoblastoid cell lines (4 carrier cases and 6 non-carrier controls) and human temporal cortex (3 carrier cases and 5 non-carrier controls). Confirming our previous results in lymphoblastoid cell lines [31], levels of Cyfip1 mRNA were significantly upregulated in carriers cases versus non-carrier controls (2.5-fold increase; Figure 1A, Raw discrete expression data for individual patients; Figure S1A). To be relevant to neuropsychiatric symptoms one would expect that similar changes would be seen in brain tissue from carrier patients. Although very few samples from individuals with 15q11-13 duplications are available worldwide, we were able to that Cyfip1 mRNA levels were also significantly increased in the superior temporal gyrus (STG, also known as Brodmann’s area 41/42) in carriers versus controls (24-fold increase; Figure 1B, Raw discrete expression data for individual patients; Figure S1B). These data support the notion that dysregulation of Cyfip1 may contribute to 15q11-13 related phenotypes by upregulation in patient cerebral cortex, and at the same time, confirm that transformed lymphoblastoid cell lines are a reliable biomarker for Cyfip1 dysregulation in individuals harboring increased dosage at this locus.
Figure 1. Gains at 15q11-13 are associated with increased CYFIP1 levels in transformed lymphoblastoid cell lines and postmortem brain.
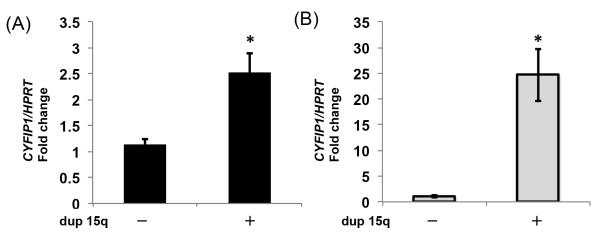
Relative expression of Cyfip1 mRNA was assessed by qPCR using Hprt as a reference. (A) In EBV transformed lymphoblastoid cell lines, levels were increased 2.5-fold in 15q11-13 duplication carriers (n=4) versus controls (n=6). (B) In postmortem superior temporal gyrus (STG, Brodmann’s area 41/42), levels were increased 24-fold in carriers (n=3) versus controls (n=5). * = p<0.05
Overexpression of Cyfip1 in vitro gives rise to increased cell size and abnormal neurite outgrowth in neuronal cells
SY5Y cells that overexpressed CYFIP1 (2-fold relative to mock transfected controls by western blot, Figure S2A) had significantly reduced neurite length (reduced ~ 50%) and longest neurite branch length (reduced ~ 60%) in addition to significantly increased neurite branch number (increased ~ 30%) and cell size (increased ~ 80%) -- Figure 2A and B. To determine whether increased levels of CYFIP1 also induced morphological changes in primary neurons, we performed similar experiments in dMNPs using lentiviral infection (2-fold relative to mock transfected controls by western blot, Figure S2B). Qualitatively indistinguishable results to our observations in the human SY5Y cells were seen in CYFIP1-overexpressing dMNPs (Figure 2C and D), which showed significantly reduced neurite length (reduced ~ 20%) and longest neurite branch length (reduced ~ 10%) in addition to significantly increased overall neurite branch number (increased ~ 20%) and cell size (increased ~ 20%). Together, these results show that CYFIP1 overexpression impacts neuronal morphology in vitro in a human cell line (SY5Y) and primary mouse neurons, also indicating parallel phenotypes in both mouse and human.
Figure 2. Overexpression of Cyfip1 gives rise to increased cell size and abnormal neurite outgrowth in neuronal cells both in vitro and in vivo.

(A) SY5Y cells were transfected with either an empty pIRES vector or pIRES-CYFIP1 and protein levels assessed by Western blot (top panel). CYFIP1 protein levels were found to be increased in pIRES-CYFIP1 relative to pIRES vector. Characterization of cell morphology using NeuroMath software identified morphological abnormalities in pIRES-CYFIP1 relative to pIRES vector (bottom panel, scale bar = 10μm). (B) Overexpression of CYFIP1 resulted in significant differences in neurite length (reduced ~ 50%), cell size (increased ~ 80%), longest neurite branch length (reduced ~ 60%), and overall neurite branch number (increased ~ 30%). (C) Differentiated mouse neuronal progenitors (dMNPs) were infected with either an empty pCDH vector or pCDH-CYFIP1 and protein levels were assessed by Western blot (top panel). CYFIP1 protein levels were found to be increased in pCDH-CYFIP1 relative to pCDH vector. Characterization of cell morphology of MAP2 stained dNMPs using NeuroMath software identified morphological abnormalities in pCDH-CYFIP1 neurons relative to pCDH vector infected cells (bottom panel; scale bar = 10μm). (D) Results qualitatively indistinguishable from those for SY5Y cells were seen in CYFIP1-overexpressing dMNPs, with significant differences in neurite length (reduced ~ 20%), cell size (increased ~ 20%), longest neurite branch length (reduced ~ 10%), and overall neurite branch number (increased ~ 20%). (E) To determine the consequences of Cyfip1 overexpression in vivo, we used a Cyfip1 spanning bacterial artificial chromosome to generate transgenic mouse strains in which gene dosage was increased. (F) CYFIP1 protein levels were assessed by Western blot using samples obtained from adult hippocampus. Protein levels were found to be increased in transgenic mice from two independent transgenic strains (Tg#8 and #24) relative to control animals. (G and H) Paralleling the effects we observed in vitro, comparisons between transgenic mice and controls identified significant differences in neurite length (reduced ~ 20% in both strains), cell size (increased ~ 60% and 10% in Tg#8 and #24, respectively), longest neurite branch length (reduced ~ 20% in both strains), and overall neurite branch number (increased ~ 50% and 15% in Tg#8 and #24, respectively). Scale bar = 50μm. * = p<0.05 and ** = p<0.01.
Development of transgenic mice to model in vivo consequences of increased Cyfip1 dosage
Based on the morphological changes observed in vitro, we attempted to confirm the Cyfip1 dosage effects in vivo. Two lines of transgenic mice harboring a BAC spanning the mouse Cyfip1 locus (Figure 2E) were produced as described in the Methods. Transgenic mice were born at normal Mendelian ratios in each strain (Tg #8 and #24), regardless of parent of origin. We screened adult hippocampus, where CYFIP1 is highly expressed, by western blot to demonstrate overexpression. Transgenic offspring from each line showed a significant increase in CYFIP1 protein levels relative to wild-type controls (~ 200% and 150% respectively, Figure 2F). Additional characterization of Tg #8 progeny by qPCR was also performed. Cyfip1 transcript levels were significantly increased in transgenic relative to controls in embryonic day (e) 15 frontal cortex, postnatal day (P) 1 cerebellum, P11 hippocampus, and in adult frontal cortex and cerebellum (Supplemental Figure S3).
Overexpression of Cyfip1 in vivo gives rise to increased cell size and abnormal neurite outgrowth in pyramidal neurons
No significant differences in gross brain weight or length were observed between adult Cyfip1 transgenic mice (Tg #8) and controls (Supplemental Figure S2). Similarly, no significant histological differences were observed between adults of each genotype through examination of H&E stained sections of the cerebral cortex (Supplemental Figure S3) or hippocampus (data not shown).
Several lines of previous work raised the possibility that altered CYFIP1 dosage might result in abnormal spine density and maturity. First, study of post-mortem brain materials from individuals with idiopathic ASD has found that spine density is increased in cases relative to controls [52]. Second, CYFIP1 is known to be a 4E-BP [34], and mice homozygous for a deletion in a distinct 4E-BP (eukaryotic initiation factor 4E-binding protein-2 or 4E-BP2) show an increased spine density [53]. Third, an increase in immature spines has been reported in mice harboring mutations in Fmr1, a demonstrated functional partner for CYFIP1 [40]. So, to more closely examine neuronal morphology in transgenic mice, we performed Golgi staining in two month old animals. Examination of layer II-III pyramidal neurons in frontal cortex revealed significant differences between transgenic and wild-type control mice (Figure 2G and H), similar to the effects we observed in vitro. Paralleling observations from our in vitro models, both transgenic stains showed significant alterations in dendritic morphology compared with controls, including reduced overall neurite length (~ 20% in both strains) and longest neurite branch length (~ 20% in both strains). Other phenotypic abnormalities paralleled expression levels as the Tg#8 strain displayed greater increases in neurite branch number (increased ~ 50% and 15% in Tg#8 and #24, respectively) and cell size than the Tg#24 strain, the latter having lower CYFIP1 expression (increased ~ 60% and 10% in Tg#8 and #24, respectively).
Overexpression of Cyfip1 in vivo results in increased spine density and increased proportion of pyramidal neurons showing a mature spine morphology
Further analyses of Golgi stained layer II-III pyramidal neurons from two month old mouse frontal cortex revealed a more than two-fold increase in the density of spines on basal dendrites in each transgenic strain relative to control mice (Figure 3A and B). Significant differences were not limited to the two-fold increase in spine density, but included spine structure as well; morphological and developmental spine characteristics [40-42, 54, 55] were seen to differ between transgenic mice and wild-type controls (Figures 3C through E). More specifically, these analyses revealed significant differences in the overall proportion of mushroom-type immature thin spines (Type B; reduced ~50% in both strains), mature stubby spines (Type D; increased 15% in both strains), and abnormal spines (Type E; increased ~ 500% in both strains). No differences between transgenic mice and wild-type controls were observed for either immature thin spines (Type A), or immature double mushroom-type spines (Type C). Abnormal spines in transgenic mice were seen to ‘cluster’ or ‘clump’ in a way not observed in controls (Figure 3E).
Figure 3. Overexpression of Cyfip1 in vivo results in increased spine density and increased proportion of pyramidal neurons showing a mature spine morphology.

Golgi staining of sections from two month old frontal cortex (layer II-III pyramidal neurons) revealed a (A) qualitative (red arrows; scale bar = 15μm), and (B) quantitative (two-fold increase) in spine density in transgenic mice (Tg#8 and #24 strains) relative to controls. (C) Categorical classification of spines highlight a (D) qualitative (black arrows; scale bar = 3μm), and (E) quantitative shift in the proportion of spines within each category in transgenic mice from either strain relative to controls. In both transgenic strains differences in the overall proportion of mushroom type immature thin spines (Type B; reduced ~50% in both strains), mature stubby spines (Type D; increased 15% in both strains), and abnormal spines (Type E; increased ~ 500% in both strains) were observed relative to control mice. No differences between transgenic mice and wild-type controls were observed for either immature thin spines (Type A) or immature double mushroom-type spines (Type C) ** = p<0.01.
Transcriptome analyses in embryonic transgenic and control mice identify differentially expressed genes and highlight mTOR
To investigate the mechanisms through which Cyfip1 overexpression might give rise to the observed abnormalities, we carried out a comparative microarray analysis of Tg#8 transgenic mice versus controls at E15, a time when large differences in CYFIP1 were observed. We identified a robust group of 130 upregulated (red) and 149 downregulated (green) genes (Bayesian t test, p < 0.01; Figure 4A and B). qPCR verified five of the top differentiated genes including an approximate two-fold reduction in three ASD candidate genes (Cntnap4, Nrxn1 and Nlgn3; Figure 4C).
Figure 4. Global expression analyses on embryonic brain in transgenic and control mice identify differentially expressed genes and highlight mTOR.

(A) Heatmap depicting genes differentially expressed between embryonic day 15 Tg #8 Cyfip1 BAC transgenic mice and controls at p<0.01. Here and in all following panels part of this figure, red represents upregulation, whereas green represents downregulation (Log2 scale). (B) 130 genes were found to be upregulated and 149 genes downregulated. (C) Between group differences for five of the top differentially expressed genes, including the autism-related genes Nrxn1 and Nlgn3, were verified by qPCR. Fold changes are expressed as log2 ± standard error. (D) Analysis of all differentially expressed genes (p<0.01) by gene ontology suggests significant enrichment in genes within actin filament and microtubule binding categories (Log2 scale). (E) Ingenuity pathway analysis implicated the mTOR pathway (second “top” network, p=0.05). As above, red corresponds to upregulation, green represents downregulation, and grey genes not differentially expressed. A solid line indicates a direct interaction and a dashed line indicates an indirect interaction. A line without an arrowhead indicates binding. Where arrowheads are present, filled and dotted lines illustrate direct and indirect actions of one protein on another. IPA node type suggests the protein categories.
As a first step towards understanding these data and underlying pathways that may be perturbed as a result of Cyfip1 overexpression, we conducted gene ontology (GO) analysis using DAVID (Figure 4D). Consistent with the morphological changes observed in transgenic mice relative to controls, GO analyses highlighted an over-representation of differentially expressed genes within several functional groups including those relating to actin filament and microtubule binding. Separate pathway based analyses carried out using Ingenuity Pathway software (Ingenuity Systems, USA), highlighted an enrichment of mTOR pathway genes (Figure 4E, p< 0.01). This was particularly interesting because CYFIP1 is involved in regulation of neuronal protein synthesis, and other published work has implicated mTOR signaling in the pathophysiology of other monogenic forms of ASD, including Fragile X syndrome [56], PTEN-related syndromes [57] and Tuberous Sclerosis [58].
Cyfip1-associated mTOR dysregulation seen in differentiated neuronal progenitors and human brain
To build on our expression analyses and determine the extent to which the Cyfip1-associated mTOR dysregulation was generalizable to a variety of model systems, we performed additional protein-level characterization of dMNPs and human post mortem samples. Mouse Neuronal Progenitors (MNPs) are multipotent precursors that have the ability to differentiate into neurons, astrocytes, and oligodendrocytes, and prior to differentiation have the capacity for self-renewal. The two-week differentiation protocol we employed resulted in most cells staining for MAP2 (neuronal marker, data not shown) and Tau (axonal marker, data not shown), respectively. Overexpression of CYFIP1 in dMNPs resulted in a 0.2-fold reduction in PTEN and a 15-fold increase in mTOR relative to control samples (Figure 5A). Importantly, knockdown of CYFIP1 resulted in the opposite effect, with a 1.2-fold increase in PTEN and a 0.5-fold decrease in mTOR (Figure 5B). These data indicate that CYFIP1 levels regulate elements of the mTOR cascade in mammalian neurons. To determine whether these results were relevant to human brain, we next investigated whether mRNA levels of mTOR were dysregulated in 15q11-13 duplication carriers with ASD relative to controls. These analyses, using the same samples from human superior temporal gyrus described above, showed a significant, approximately 6-fold upregulation of mTOR in patient carriers compared to non-carrier controls (Figure 5C, Raw discrete expression data for individual patients; Figure S6), suggesting that mTOR levels are sensitive to CYFIP1 dosage in human brain, as we observed in dMNPs.
Figure 5. Rapamycin, an mTOR inhibitor, rescues the morphological and molecular abnormalities resulting from CYFIP1 overexpression.

(A) Mouse neuronal progenitors (MNPs) were infected with either an empty pCDH vector or pCDH-CYFIP1, allowed to differentiate for two weeks, and then protein levels assessed by Western blot. 2-week differentiated MNPs (dMNPs) overexpressing CYFIP1 showed increased levels of mTOR and decreased levels of PTEN. (B) MNPs were infected with either an empty pGIPZ vector or pGIPZ-CYFIP1 shRNA, allowed to differentiate for two weeks, and protein levels assessed by Western blot. CYFIP1 knockdown was found to result in decreased levels of mTOR and increased levels of PTEN. (C) mTOR mRNA levels in brain tissue samples obtained from patients with CYFIP1 containing 15q11-13 duplications (n=3) and controls (n=5) were evaluated by qPCR, and found to be increased 6-fold in affected carriers. (D) Characterization of cell morphology of MAP2 stained dMNPs using NeuroMath software identified morphological abnormalities in pCDH-CYFIP1 relative to pCDH vector infected cells (top panel; scale bar = 10μm). MNPs infected with pCDH-CYFIP1, allowed to differentiate for two weeks, and then treated for 24 hours with 5nM rapamycin were qualitatively (bottom panel), and (E) quantitatively similar to pCDH vector infected cells. pCDH: infected with vector and 24hours vehicle (DMSO) treatment, pCDH-CYFIP1: infected with CYFIP1 vehicle (DMSO) treatment, pCDH-Rapa: infected with vector and 24 hours 5 nM rapamycin treatment, pCDH-CYFIP1-Rapa: infected with CYFIP1 and 24 hours 5 nM rapamycin treatment. (F through I) Western blots were performed on the lysates of pCDH-CYFIP1 and pCDH vector infected dMNPs treated for 6 hours with either DMSO or 5 nM rapamycin. We observed a normalization of mTOR activity at 6 hours after rapamycin treatment; the ratio of phosphorylated mTOR to total mTOR and levels of phosphorylated S6 Kinase were similar to that observed at baseline. Although rapamycin treated dMNPs infected with pCDH-CYFIP1 showed a decrease of mTOR activity at 6 hours, CYFIP1 levels remained elevated. (J and K) Brain tissue samples obtained from CYFIP1 containing 15q11-13 duplication carriers (n=3) and non-carrier controls (n=4) were evaluated by Western blot. CYFIP1 and p-S6 protein levels were found to be 2.5-fold increased in affected carriers. * = p<0.05 and ** = p<0.01. (L) Scheme of CYFIP1/mTOR signaling. Scheme showing the link between overexpression in CYFIP1 and neuronal morphological changes via overactivated mTOR. Results support a model where overexpression of CYFIP1 in neurons results in activation of mTOR signaling, which in turn gives rise to a series of morphological abnormalities. In response to CYFIP1 overexpression, levels of the negative regulator PTEN are reduced, mTOR levels are increased, and S6 activity is increased. Gross morphological abnormalities resulting from CYFIP1 overexpression are rescued by treatment with the mTOR inhibitor rapamycin, demonstrating causality.
Rapamycin, an mTOR inhibitor, rescues the morphological and molecular abnormalities resulting from CYFIP1 overexpression
We next reasoned that if mTOR signaling was causing any of these abnormalities, that the mTOR inhibitor rapamycin might ameliorate any of the abnormalities resulting from CYFIP1 overexpression in dMNPs. We examined MNPs that were infected with either vector or CYFIP1, differentiated in vitro for 2 weeks, and subsequently exposed to 5 nM rapamycin or vehicle (DMSO) for 24 hours. Qualitative and quantitative analyses of morphology showed that rapamycin treatment was associated with a normalization of neurite length, neurite branch length, overall neurite branch number, and cell size (Figure 5D and E). At the molecular level, athough CYFIP1 was unchanged after 6 hours of rapamycin treatment, the ratio of phosphorylated mTOR to total mTOR was similar to that observed at baseline (Figure 5F and G). Importantly, we also observed a dramatic decrease in p-S6 (Ser 235/236) expression, a main downstream effector of mTOR and a readout of mTOR signaling activity, in the rapamycin-treated MNPs (Figure 5H and I).
Although no drop in CYFIP1 levels were observed after 6 hours of rapamycin, by 24 hours a reduction in CYFIP1 levels and a further decrease in total mTOR levels were observed (Figure S4). Thus, based on these time course data, a parsimonious mechanism for the reversal of morphological abnormalities associated with CYFIP1 over-expression is an effect on CYFIP1 levels through mTOR mediated p-S6 activation, which precedes changes in CYFIP1 protein levels.
To determine whether these results were relevant to human brain, we then examined whether levels of CYFIP1 and p-S6 proteins differed between 15q11-13 duplication carriers with ASD and non-carrier controls. Based on the above data, one would expect increase p-S6 in those with elevated CYFIP1 levels. Consistent with this prediction, we observed an approximate 2.5-fold upregulation of CYFIP1 and p-S6 in carriers (Figure 5J and K, Raw discrete expression data for individual patients; Figure S8), suggesting that mTOR activity is sensitive to CYFIP1 dosage in human brain, as was observed in mouse. Our findings support a model (Figure 5L), where overexpression of CYFIP1 in neurons results in activation of mTOR signaling, which in turn gives rise to a series of morphological abnormalities.
Discussion
Identifying individual contributory genes within multi-gene risk loci is essential for a mechanistic understanding of disease pathogenesis in ASD. The data presented here provide strong support for pathological consequences as a result of overexpression of CYFIP1, located at 15q11.2. Previous work has shown that deletions encompassing this four genes locus are associated with increased risk for ASD, intellectual disability and schizophrenia [27, 28] Consistent with an important role in disease, we show that increased CYFIP1 dosage gives rise to characteristic pathological cellular phenotypes in multiple model systems. Both in vitro and in vivo, overexpression of CYFIP1 resulted in a reduction in neurite length and longest neurite branch length, as well as an increase in neurite branch number and cell size. Golgi staining of transgenic mouse brain revealed alterations in dendritic spine morphology and density, outcomes observed with mutations in several other monogenic forms of ASD, including Fmr1 [59], Pten[60], Neurexins [61] and Neuroligin1 [62]. We also investigated the potential mechanisms underlying these effects by characterizing expression differences in frontal cortex between transgenic mice overexpressing Cyfip1 and wild-type controls. These genome-wide analyses, confirmed by functional experiments carried out in vitro, revealed a previous unknown link between CYFIP1 and mTOR signaling.
CYFIP1 was first identified through its functional interaction with the FMRP [29, 33], an RNA binding protein critical for the stability, intracellular transport, and translation of hundreds of target mRNAs [63]. Importantly, triplet repeat (CGG) expansions in the 5′ UTR of FMR1, the gene that encodes FMRP, give rise to Fragile X syndrome, in which a higher than expected proportion of individuals have an ASD. FMRP target mRNAs [64], together with FMRP itself, form a complex with CYFIP1, which acts as an intermediary to elongation initiation factor 4E (eIF4E). CYFIP1 binding to eIF4E prevents the assembly of the multi-protein complex that mediates translational initiation [34]. Neuronal excitation mediated via BDNF activation of TrkB and/or signaling by metabotropic glutamate receptors, results in the dissociation of the FMRP-CYFIP1 complex from eIF4E, permitting translation. Interestingly, mice harboring mutations in Fmr1 are known to have an increase in immature mushroom-shaped dendritic spines [65], the opposite to what we saw following CYFIP1 overexpression. Moreover, recent reports demonstrate that elimination of S6K1 in another model was able to rescue the abnormal excess of immature dendritic spines [66], also pointing to mTOR as an important mediator of the abnormal morphology. These results, together with a recent report found that immature spines were increased in number in Cyfip1-silenced neurons when compared to controls [36] suggests that FMRP and CYFIP1 operate cooperatively via mTOR, and support the notion that CYFIP1 action is sensitive to dosage.
We also observed that overexpression of CYFIP1 reduces levels of Phosphatase and tensin homolog on chromosome ten (PTEN), and conversely that knockdown of CYFIP1 increases PTEN levels. This is interesting, because it is well known that individuals harboring germline mutations in Pten often present with ASD and intellectual disability [57, 67, 68]. Moreover, Pten mutant mice, considered a model for ASD, show a subset of cellular abnormalities closely paralleling those we report here [69]. As a result of either CYFIP1 overexpression or Pten knockout in brain, both cell size and synapse density were increased relative to controls. Previous work has also demonstrated that inhibition of mTOR by CCI-779, a rapamycin derivative, was also able to rescue neuronal hypertrophy seen in Pten mutant mice [70]. This is consistent with our finding that rapamycin was able to rescue the morphological abnormalities we observed resulting from CYFIP1 overexpression. That abnormalities associated with both models can be rescued via inhibition of mTOR, suggests convergent, if not conserved mechanisms in these monogenic forms of ASD associated with protein translation dysregulation.
Another monogenic form of ASD, Tuberous Sclerosis, may also be mediated, at least partially, by abnormal mTOR signaling. Previous work showed that mosaic induction of Tsc1 loss in neural progenitor cells resulted in the development of highly enlarged giant cells with enlarged vacuoles [71]. Consistent with this effect being mediated by mTOR, Carson and coworkers showed that postnatal rapamycin treatment completely reversed these phenotypes and rescued the mutants from epilepsy and premature death, despite prenatal onset of Tsc1 loss and mTOR activation in the developing brain [72]. While our manuscript was under review a separate paper was published that looked at the consequence of Cyfip1 overexpression on the morphology of neurons grown in vitro (hippocampal neurons from e18 rats grown for 21 days) [73]. Abnormalities they observed with regard to spine morphology were different to those we saw in each of our transgenic mouse strains (layer II/III cortical neurons from adult Tg8 and Tg24 strains). Results from Pathania, M et al., are also unexpected in that they are inconsistent with the notion that reductions and increases in CYFIP1 dosage have opposite effects on mTOR signaling (Figure 5A and B). More work will be required to determine whether apparent discrepancies are the result of differences relating to species, brain region, timing, culture vs. whole animal systems, or some other as yet unknown factor. Together, these results are consistent with the notion that regulation of local protein synthesis through PI3K and mTOR/S6K are likely to be of broad relevance to the mechanisms underlying the ASDs and related disorders. This is particularly interesting given the finding that previous work in post-mortem brain suggests that average spine density is increased in idiopathic ASDs [52]. Based on our results, we need to consider two potential mechanisms for rapamycin’s reversal of CYFIP1 induced morphologic abnormalities (Figure 5L). The first is a direct mTOR pathway effect on cytoskeletal proteins. The second is an indirect effect via mTOR activity and p-S6 diminishing CYFIP1 levels, which, in turn, would normalize the morphological abnormalities we observed. Given that CYFIP1 is known to regulate the actin cytoskeleton Rho GTPase via Rac1 [33] and recently published data [74] indicating that mice heterozygous for deletions showed rapamycin insensitive enhancements in long term depression it may also be that other abnormalities resulting from altered Cyfip1 dosage may result from perturbation of distinct signaling pathways.
Although further work will be required to fully understand how loss and gain of CYFIP1 impacts the mTOR cascade in the developing brain to increase risk for neuropsychiatric disorders, our work supports the notion that drugs acting on mTOR might be useful in individuals harboring either 15q11-13 duplications or smaller CNVs or sequence variants that result in changes in CYFIP1 levels. Moreover, given the apparent relationship between CYFIP1 dosage and expression in human transformed lymphoblastoid cell lines and brain, there is the possibility that mRNA expression levels in lymphoblastoid cell lines could be used as a biomarker to identify patients most suitable for treatment. It will be interesting to test the ability of rapamycin-like agents to ameliorate clinical outcomes in patients harboring genetic variants that encompass CYFIP1. At the same time, because both duplications and deletions at 15q11-13 appear to increase the risk for neuropsychiatric disease or lead to intellectual disability, careful attention to CYFIP1 levels will likely be needed. Our data and published work from others shows that reductions and increases in CYFIP1 levels give rise to opposite effects with regard to mTOR signaling, neuronal morphology, and structural aspects of disease related brain regions [27, 36]. Broadly speaking, these data are consistent with observations at other CNV loci including 5q35, 7q11.23, 16p11.2 where deletions and duplications have opposing effects on disease related endophenotypes, but at the same time, each increases risk for cognitive disability [75-79].
Supplementary Material
Acknowledgements
We would like to thank the UCLA transgenic mice core for injection of Cyfip1 Bac transgenic mice; Drs. William Yang, Xiaofeng Gu, Paul Mischel, Akio Iwanami, Eric Wexler, Yoshitake Sano, Genevieve Konopka, Ezra Rosen and Luis de la Torre Ubieta for helpful discussions in planning the experiments; Drs. Jeff Goodenbour, Jason Stein, Irina Voineagu, Olga Peñagarikano for important experimental advice and support; Greg Osborn, Hongmei Dong, and Camille Fonseca for technical assistance and Lauren Kawaguchi for manuscript editing. This work was supported by funds from the Uehara Memorial Foundation (A.O.A), Japan Society for the Promotion of Science (A.O.A) and a New Investigator Development Award, a Human Genetics Pilot Award, and a Rose F. Kennedy Intellectual and Developmental Disabilities Research Center (P30HD071593) Pilot Award from the Albert Einstein College of Medicine (B.S.A.) and grants from the NIH (R37 MH60233-06A1, R01 MH081754-02R to D.H.G.).
Footnotes
Conflict of interest
The authors declare no conflict of interest. A provisional patent describing the potential utility of mTOR inhibitors in individuals with ASD harboring 15q11-13 duplications has been filed.
References
- 1.Volkmar FR, Pauls D. Autism. Lancet. 2003;362(9390):1133–41. doi: 10.1016/S0140-6736(03)14471-6. [DOI] [PubMed] [Google Scholar]
- 2.Geschwind DH. Genetics of autism spectrum disorders. Trends Cogn Sci. 2011;15(9):409–16. doi: 10.1016/j.tics.2011.07.003. [DOI] [PMC free article] [PubMed] [Google Scholar]
- 3.Glessner JT, et al. Autism genome-wide copy number variation reveals ubiquitin and neuronal genes. Nature. 2009;459(7246):569–73. doi: 10.1038/nature07953. [DOI] [PMC free article] [PubMed] [Google Scholar]
- 4.Pinto D, et al. Functional impact of global rare copy number variation in autism spectrum disorders. Nature. 2010;466(7304):368–72. doi: 10.1038/nature09146. [DOI] [PMC free article] [PubMed] [Google Scholar]
- 5.Anney R, et al. A genome-wide scan for common alleles affecting risk for autism. Hum Mol Genet. 2010;19(20):4072–82. doi: 10.1093/hmg/ddq307. [DOI] [PMC free article] [PubMed] [Google Scholar]
- 6.Wang K, et al. Common genetic variants on 5p14.1 associate with autism spectrum disorders. Nature. 2009;459(7246):528–33. doi: 10.1038/nature07999. [DOI] [PMC free article] [PubMed] [Google Scholar]
- 7.Weiss LA, et al. A genome-wide linkage and association scan reveals novel loci for autism. Nature. 2009;461(7265):802–8. doi: 10.1038/nature08490. [DOI] [PMC free article] [PubMed] [Google Scholar]
- 8.Sanders SJ, et al. De novo mutations revealed by whole-exome sequencing are strongly associated with autism. Nature. 2012;485(7397):237–41. doi: 10.1038/nature10945. [DOI] [PMC free article] [PubMed] [Google Scholar]
- 9.O’Roak BJ, et al. Sporadic autism exomes reveal a highly interconnected protein network of de novo mutations. Nature. 2012;485(7397):246–50. doi: 10.1038/nature10989. [DOI] [PMC free article] [PubMed] [Google Scholar]
- 10.Neale BM, et al. Patterns and rates of exonic de novo mutations in autism spectrum disorders. Nature. 2012;485(7397):242–5. doi: 10.1038/nature11011. [DOI] [PMC free article] [PubMed] [Google Scholar]
- 11.Leblond CS, et al. Genetic and functional analyses of SHANK2 mutations suggest a multiple hit model of autism spectrum disorders. PLoS Genet. 2012;8(2):e1002521. doi: 10.1371/journal.pgen.1002521. [DOI] [PMC free article] [PubMed] [Google Scholar]
- 12.Baker P, et al. Brief report: duplication of chromosome 15q11-13 in two individuals with autistic disorder. J Autism Dev Disord. 1994;24(4):529–35. doi: 10.1007/BF02172133. [DOI] [PubMed] [Google Scholar]
- 13.Dykens EM, Sutcliffe JS, Levitt P. Autism and 15q11-q13 disorders: behavioral, genetic, and pathophysiological issues. Ment Retard Dev Disabil Res Rev. 2004;10(4):284–91. doi: 10.1002/mrdd.20042. [DOI] [PubMed] [Google Scholar]
- 14.Bolton PF, et al. Chromosome 15q11-13 abnormalities and other medical conditions in individuals with autism spectrum disorders. Psychiatr Genet. 2004;14(3):131–7. doi: 10.1097/00041444-200409000-00002. [DOI] [PubMed] [Google Scholar]
- 15.Vorstman JA, et al. Identification of novel autism candidate regions through analysis of reported cytogenetic abnormalities associated with autism. Mol Psychiatry. 2006;11(1):1, 18–28. doi: 10.1038/sj.mp.4001781. [DOI] [PubMed] [Google Scholar]
- 16.Cook EH, Jr., et al. Autism or atypical autism in maternally but not paternally derived proximal 15q duplication. Am J Hum Genet. 1997;60(4):928–34. [PMC free article] [PubMed] [Google Scholar]
- 17.Jiang Y, et al. Imprinting in Angelman and Prader-Willi syndromes. Curr Opin Genet Dev. 1998;8(3):334–42. doi: 10.1016/s0959-437x(98)80091-9. [DOI] [PubMed] [Google Scholar]
- 18.Locke DP, et al. BAC microarray analysis of 15q11-q13 rearrangements and the impact of segmental duplications. J Med Genet. 2004;41(3):175–82. doi: 10.1136/jmg.2003.013813. [DOI] [PMC free article] [PubMed] [Google Scholar]
- 19.Bittel DC, Kibiryeva N, Butler MG. Expression of 4 genes between chromosome 15 breakpoints 1 and 2 and behavioral outcomes in Prader-Willi syndrome. Pediatrics. 2006;118(4):e1276–83. doi: 10.1542/peds.2006-0424. [DOI] [PMC free article] [PubMed] [Google Scholar]
- 20.Butler MG, et al. Behavioral differences among subjects with Prader-Willi syndrome and type I or type II deletion and maternal disomy. Pediatrics. 2004;113(3 Pt 1):565–73. doi: 10.1542/peds.113.3.565. [DOI] [PMC free article] [PubMed] [Google Scholar]
- 21.Meguro-Horike M, et al. Neuron-specific impairment of inter-chromosomal pairing and transcription in a novel model of human 15q-duplication syndrome. Hum Mol Genet. 2011;20(19):3798–810. doi: 10.1093/hmg/ddr298. [DOI] [PMC free article] [PubMed] [Google Scholar]
- 22.Cooper GM, et al. A copy number variation morbidity map of developmental delay. Nat Genet. 2011 doi: 10.1038/ng.909. [DOI] [PMC free article] [PubMed] [Google Scholar]
- 23.Chaste P, et al. Modest Impact on Risk for Autism Spectrum Disorder of Rare Copy Number Variants at 15q11.2, Specifically Breakpoints 1 to 2. Autism Res. 2014 doi: 10.1002/aur.1378. [DOI] [PMC free article] [PubMed] [Google Scholar]
- 24.Burnside RD, et al. Microdeletion/microduplication of proximal 15q11.2 between BP1 and BP2: a susceptibility region for neurological dysfunction including developmental and language delay. Hum Genet. 2011;130(4):517–28. doi: 10.1007/s00439-011-0970-4. [DOI] [PMC free article] [PubMed] [Google Scholar]
- 25.van der Zwaag B, et al. A co-segregating microduplication of chromosome 15q11.2 pinpoints two risk genes for autism spectrum disorder. Am J Med Genet B Neuropsychiatr Genet. 2010;153B(4):960–6. doi: 10.1002/ajmg.b.31055. [DOI] [PMC free article] [PubMed] [Google Scholar]
- 26.de Kovel CG, et al. Recurrent microdeletions at 15q11.2 and 16p13.11 predispose to idiopathic generalized epilepsies. Brain. 2010;133(Pt 1):23–32. doi: 10.1093/brain/awp262. [DOI] [PMC free article] [PubMed] [Google Scholar]
- 27.Stefansson H, et al. CNVs conferring risk of autism or schizophrenia affect cognition in controls. Nature. 2014;505(7483):361–6. doi: 10.1038/nature12818. [DOI] [PubMed] [Google Scholar]
- 28.Stefansson H, et al. Large recurrent microdeletions associated with schizophrenia. Nature. 2008;455(7210):232–6. doi: 10.1038/nature07229. [DOI] [PMC free article] [PubMed] [Google Scholar]
- 29.Schenck A, et al. A highly conserved protein family interacting with the fragile X mental retardation protein (FMRP) and displaying selective interactions with FMRP-related proteins FXR1P and FXR2P. Proc Natl Acad Sci U S A. 2001;98(15):8844–9. doi: 10.1073/pnas.151231598. [DOI] [PMC free article] [PubMed] [Google Scholar]
- 30.Rogers SJ, Wehner DE, Hagerman R. The behavioral phenotype in fragile X: symptoms of autism in very young children with fragile X syndrome, idiopathic autism, and other developmental disorders. J Dev Behav Pediatr. 2001;22(6):409–17. doi: 10.1097/00004703-200112000-00008. [DOI] [PubMed] [Google Scholar]
- 31.Nishimura Y, et al. Genome-wide expression profiling of lymphoblastoid cell lines distinguishes different forms of autism and reveals shared pathways. Hum Mol Genet. 2007;16(14):1682–98. doi: 10.1093/hmg/ddm116. [DOI] [PubMed] [Google Scholar]
- 32.Nowicki ST, et al. The Prader-Willi phenotype of fragile X syndrome. J Dev Behav Pediatr. 2007;28(2):133–8. doi: 10.1097/01.DBP.0000267563.18952.c9. [DOI] [PubMed] [Google Scholar]
- 33.Schenck A, et al. CYFIP/Sra-1 controls neuronal connectivity in Drosophila and links the Rac1 GTPase pathway to the fragile X protein. Neuron. 2003;38(6):887–98. doi: 10.1016/s0896-6273(03)00354-4. [DOI] [PubMed] [Google Scholar]
- 34.Napoli I, et al. The fragile X syndrome protein represses activity-dependent translation through CYFIP1, a new 4E-BP. Cell. 2008;134(6):1042–54. doi: 10.1016/j.cell.2008.07.031. [DOI] [PubMed] [Google Scholar]
- 35.Kobayashi K, et al. p140Sra-1 (specifically Rac1-associated protein) is a novel specific target for Rac1 small GTPase. J Biol Chem. 1998;273(1):291–5. doi: 10.1074/jbc.273.1.291. [DOI] [PubMed] [Google Scholar]
- 36.De Rubeis S, et al. CYFIP1 coordinates mRNA translation and cytoskeleton remodeling to ensure proper dendritic spine formation. Neuron. 2013;79(6):1169–82. doi: 10.1016/j.neuron.2013.06.039. [DOI] [PMC free article] [PubMed] [Google Scholar]
- 37.Yang XW, Gong S. An overview on the generation of BAC transgenic mice for neuroscience research. Curr Protoc Neurosci. 2005 doi: 10.1002/0471142301.ns0520s31. Chapter 5: p. Unit 5 20. [DOI] [PubMed] [Google Scholar]
- 38.Yang XW, Model P, Heintz N. Homologous recombination based modification in Escherichia coli and germline transmission in transgenic mice of a bacterial artificial chromosome. Nat Biotechnol. 1997;15(9):859–65. doi: 10.1038/nbt0997-859. [DOI] [PubMed] [Google Scholar]
- 39.Galun M, Basri R, Brandt A. Multiscale Edge Detection and Fiber Enhancement Using Differences of Oriented Means. ICCV. 2007 [Google Scholar]
- 40.Irwin SA, et al. Dendritic spine and dendritic field characteristics of layer V pyramidal neurons in the visual cortex of fragile-X knockout mice. Am J Med Genet. 2002;111(2):140–6. doi: 10.1002/ajmg.10500. [DOI] [PubMed] [Google Scholar]
- 41.McKinney BC, et al. Dendritic spine abnormalities in the occipital cortex of C57BL/6 Fmr1 knockout mice. Am J Med Genet B Neuropsychiatr Genet. 2005;136B(1):98–102. doi: 10.1002/ajmg.b.30183. [DOI] [PubMed] [Google Scholar]
- 42.Irwin SA, et al. Abnormal dendritic spine characteristics in the temporal and visual cortices of patients with fragile-X syndrome: a quantitative examination. Am J Med Genet. 2001;98(2):161–7. doi: 10.1002/1096-8628(20010115)98:2<161::aid-ajmg1025>3.0.co;2-b. [DOI] [PubMed] [Google Scholar]
- 43.Geschwind DH, et al. The autism genetic resource exchange: a resource for the study of autism and related neuropsychiatric conditions. Am J Hum Genet. 2001;69(2):463–6. doi: 10.1086/321292. [DOI] [PMC free article] [PubMed] [Google Scholar]
- 44.Bucan M, et al. Genome-wide analyses of exonic copy number variants in a family-based study point to novel autism susceptibility genes. PLoS Genet. 2009;5(6):e1000536. doi: 10.1371/journal.pgen.1000536. [DOI] [PMC free article] [PubMed] [Google Scholar]
- 45.Wintle RF, et al. A genotype resource for postmortem brain samples from the Autism Tissue Program. Autism Res. 2011;4(2):89–97. doi: 10.1002/aur.173. [DOI] [PMC free article] [PubMed] [Google Scholar]
- 46.Voineagu I, et al. Transcriptomic analysis of autistic brain reveals convergent molecular pathology. Nature. 2011;474(7351):380–4. doi: 10.1038/nature10110. [DOI] [PMC free article] [PubMed] [Google Scholar]
- 47.Abrahams BS, et al. Genome-wide analyses of human perisylvian cerebral cortical patterning. Proc Natl Acad Sci U S A. 2007;104(45):17849–54. doi: 10.1073/pnas.0706128104. [DOI] [PMC free article] [PubMed] [Google Scholar]
- 48.Oguro A, et al. Protective role of the ubiquitin binding protein Tollip against the toxicity of polyglutamine-expansion proteins. Neurosci Lett. 2011;503(3):234–9. doi: 10.1016/j.neulet.2011.08.043. [DOI] [PubMed] [Google Scholar]
- 49.Coppola G, et al. Functional genomic analysis of frataxin deficiency reveals tissue-specific alterations and identifies the PPARgamma pathway as a therapeutic target in Friedreich’s ataxia. Hum Mol Genet. 2009;18(13):2452–61. doi: 10.1093/hmg/ddp183. [DOI] [PMC free article] [PubMed] [Google Scholar]
- 50.Coppola G. Designing, performing, and interpreting a microarray-based gene expression study. Methods Mol Biol. 2011;793:417–39. doi: 10.1007/978-1-61779-328-8_28. [DOI] [PubMed] [Google Scholar]
- 51.Edgar R, Domrachev M, Lash AE. Gene Expression Omnibus: NCBI gene expression and hybridization array data repository. Nucleic Acids Res. 2002;30(1):207–10. doi: 10.1093/nar/30.1.207. [DOI] [PMC free article] [PubMed] [Google Scholar]
- 52.Hutsler JJ, Zhang H. Increased dendritic spine densities on cortical projection neurons in autism spectrum disorders. Brain Res. 2010;1309:83–94. doi: 10.1016/j.brainres.2009.09.120. [DOI] [PubMed] [Google Scholar]
- 53.Ran I, et al. Selective regulation of GluA subunit synthesis and AMPA receptor-mediated synaptic function and plasticity by the translation repressor 4E-BP2 in hippocampal pyramidal cells. J Neurosci. 2013;33(5):1872–86. doi: 10.1523/JNEUROSCI.3264-12.2013. [DOI] [PMC free article] [PubMed] [Google Scholar]
- 54.Galvez R, Greenough WT. Sequence of abnormal dendritic spine development in primary somatosensory cortex of a mouse model of the fragile X mental retardation syndrome. Am J Med Genet A. 2005;135(2):155–60. doi: 10.1002/ajmg.a.30709. [DOI] [PubMed] [Google Scholar]
- 55.Grossman AW, et al. Local protein synthesis and spine morphogenesis: Fragile X syndrome and beyond. J Neurosci. 2006;26(27):7151–5. doi: 10.1523/JNEUROSCI.1790-06.2006. [DOI] [PMC free article] [PubMed] [Google Scholar]
- 56.Osterweil EK, et al. Hypersensitivity to mGluR5 and ERK1/2 leads to excessive protein synthesis in the hippocampus of a mouse model of fragile X syndrome. J Neurosci. 2010;30(46):15616–27. doi: 10.1523/JNEUROSCI.3888-10.2010. [DOI] [PMC free article] [PubMed] [Google Scholar]
- 57.Butler MG, et al. Subset of individuals with autism spectrum disorders and extreme macrocephaly associated with germline PTEN tumour suppressor gene mutations. J Med Genet. 2005;42(4):318–21. doi: 10.1136/jmg.2004.024646. [DOI] [PMC free article] [PubMed] [Google Scholar]
- 58.Tsai PT, et al. Autistic-like behaviour and cerebellar dysfunction in Purkinje cell Tsc1 mutant mice. Nature. 2012;488(7413):647–51. doi: 10.1038/nature11310. [DOI] [PMC free article] [PubMed] [Google Scholar]
- 59.Grossman AW, et al. Hippocampal pyramidal cells in adult Fmr1 knockout mice exhibit an immature-appearing profile of dendritic spines. Brain Res. 2006;1084(1):158–64. doi: 10.1016/j.brainres.2006.02.044. [DOI] [PubMed] [Google Scholar]
- 60.Xiong Q, et al. PTEN regulation of local and long-range connections in mouse auditory cortex. J Neurosci. 2012;32(5):1643–52. doi: 10.1523/JNEUROSCI.4480-11.2012. [DOI] [PMC free article] [PubMed] [Google Scholar]
- 61.Dudanova I, et al. Deletion of alpha-neurexins does not cause a major impairment of axonal pathfinding or synapse formation. J Comp Neurol. 2007;502(2):261–74. doi: 10.1002/cne.21305. [DOI] [PubMed] [Google Scholar]
- 62.Dahlhaus R, et al. Overexpression of the cell adhesion protein neuroligin-1 induces learning deficits and impairs synaptic plasticity by altering the ratio of excitation to inhibition in the hippocampus. Hippocampus. 2010;20(2):305–22. doi: 10.1002/hipo.20630. [DOI] [PubMed] [Google Scholar]
- 63.De Rubeis S, Bagni C. Regulation of molecular pathways in the Fragile X Syndrome: insights into Autism Spectrum Disorders. J Neurodev Disord. 2011;3(3):257–69. doi: 10.1007/s11689-011-9087-2. [DOI] [PMC free article] [PubMed] [Google Scholar]
- 64.Darnell JC, et al. FMRP stalls ribosomal translocation on mRNAs linked to synaptic function and autism. Cell. 2011;146(2):247–61. doi: 10.1016/j.cell.2011.06.013. [DOI] [PMC free article] [PubMed] [Google Scholar]
- 65.Comery TA, et al. Abnormal dendritic spines in fragile X knockout mice: maturation and pruning deficits. Proc Natl Acad Sci U S A. 1997;94(10):5401–4. doi: 10.1073/pnas.94.10.5401. [DOI] [PMC free article] [PubMed] [Google Scholar]
- 66.Bhattacharya A, et al. Genetic removal of p70 S6 kinase 1 corrects molecular, synaptic, and behavioral phenotypes in fragile X syndrome mice. Neuron. 2012;76(2):325–37. doi: 10.1016/j.neuron.2012.07.022. [DOI] [PMC free article] [PubMed] [Google Scholar]
- 67.Varga EA, et al. The prevalence of PTEN mutations in a clinical pediatric cohort with autism spectrum disorders, developmental delay, and macrocephaly. Genet Med. 2009;11(2):111–7. doi: 10.1097/GIM.0b013e31818fd762. [DOI] [PubMed] [Google Scholar]
- 68.Orrico A, et al. Novel PTEN mutations in neurodevelopmental disorders and macrocephaly. Clin Genet. 2009;75(2):195–8. doi: 10.1111/j.1399-0004.2008.01074.x. [DOI] [PubMed] [Google Scholar]
- 69.Kwon CH, et al. Pten regulates neuronal arborization and social interaction in mice. Neuron. 2006;50(3):377–88. doi: 10.1016/j.neuron.2006.03.023. [DOI] [PMC free article] [PubMed] [Google Scholar]
- 70.Kwon CH, et al. mTor is required for hypertrophy of Pten-deficient neuronal soma in vivo. Proc Natl Acad Sci U S A. 2003;100(22):12923–8. doi: 10.1073/pnas.2132711100. [DOI] [PMC free article] [PubMed] [Google Scholar]
- 71.Goto J, et al. Regulable neural progenitor-specific Tsc1 loss yields giant cells with organellar dysfunction in a model of tuberous sclerosis complex. Proc Natl Acad Sci U S A. 2011;108(45):E1070–9. doi: 10.1073/pnas.1106454108. [DOI] [PMC free article] [PubMed] [Google Scholar]
- 72.Carson RP, et al. Neuronal and glia abnormalities in Tsc1-deficient forebrain and partial rescue by rapamycin. Neurobiol Dis. 2011;45(1):369–80. doi: 10.1016/j.nbd.2011.08.024. [DOI] [PMC free article] [PubMed] [Google Scholar]
- 73.Pathania M, et al. The autism and schizophrenia associated gene CYFIP1 is critical for the maintenance of dendritic complexity and the stabilization of mature spines. Transl Psychiatry. 2014;4:e374. doi: 10.1038/tp.2014.16. [DOI] [PMC free article] [PubMed] [Google Scholar]
- 74.Bozdagi O, et al. Haploinsufficiency of cyfip1 produces fragile x-like phenotypes in mice. PLoS One. 2012;7(8):e42422. doi: 10.1371/journal.pone.0042422. [DOI] [PMC free article] [PubMed] [Google Scholar]
- 75.Golzio C, et al. KCTD13 is a major driver of mirrored neuroanatomical phenotypes of the 16p11.2 copy number variant. Nature. 2012;485(7398):363–7. doi: 10.1038/nature11091. [DOI] [PMC free article] [PubMed] [Google Scholar]
- 76.Hammond P, et al. Opposite effects on facial morphology due to gene dosage sensitivity. Hum Genet. 2014 doi: 10.1007/s00439-014-1455-z. [DOI] [PMC free article] [PubMed] [Google Scholar]
- 77.Jacquemont S, et al. Mirror extreme BMI phenotypes associated with gene dosage at the chromosome 16p11.2 locus. Nature. 2011;478(7367):97–102. doi: 10.1038/nature10406. [DOI] [PMC free article] [PubMed] [Google Scholar]
- 78.Rosenfeld JA, et al. Further Evidence of Contrasting Phenotypes Caused by Reciprocal Deletions and Duplications: Duplication of NSD1 Causes Growth Retardation and Microcephaly. Mol Syndromol. 2013;3(6):247–54. doi: 10.1159/000345578. [DOI] [PMC free article] [PubMed] [Google Scholar]
- 79.Van der Aa N, et al. Fourteen new cases contribute to the characterization of the 7q11.23 microduplication syndrome. Eur J Med Genet. 2009;52(2-3):94–100. doi: 10.1016/j.ejmg.2009.02.006. [DOI] [PubMed] [Google Scholar]
Associated Data
This section collects any data citations, data availability statements, or supplementary materials included in this article.