

Abstract
The variables that influence the in vitro recellularization potential of decellularized engineered tissues, such as cell culture conditions and scaffold alignment, have yet to be explored. The goal of this work was to explore the influence of insulin and ascorbic acid and extracellular matrix (ECM) alignment on the recellularization of decellularized engineered tissue by human mesenchymal stem cells (hMSCs). Aligned and non‐aligned tissues were created by specifying the geometry and associated mechanical constraints to fibroblast‐mediated fibrin gel contraction and remodelling using circular and C‐shaped moulds. Decellularized tissues (matrices) of the same alignment were created by decellularization with detergents. Ascorbic acid promoted the invasion of hMSCs into the matrices due to a stimulated increase in motility and proliferation. Invasion correlated with hyaluronic acid secretion, α‐smooth muscle actin expression and decreased matrix thickness. Furthermore, hMSCs invasion into aligned and non‐aligned matrices was not different, although there was a difference in cell orientation. Finally, we show that hMSCs on the matrix surface appear to differentiate toward a smooth muscle cell or myofibroblast phenotype with ascorbic acid treatment. These results inform the strategy of recellularizing decellularized engineered tissue with hMSCs. © 2015 The Authors Journal of Tissue Engineering and Regenerative Medicine Published by John Wiley & Sons Ltd.
Keywords: mesenchymal stem cell, decellularization, extracellular matrix, alignment, cell invasion, cell differentiation
1. Introduction
Every year, more than 100 000 patients in the USA need to have a dysfunctional valve replaced with a mechanical or bioprosthetic valve (Vesely, 2005). Although mechanical and bioprosthetic valves are the current gold standard for valve replacement surgeries, they both have advantages and disadvantages: mechanical valves have high durability but require lifelong anticoagulation to prevent thromboembolism; whereas bioprosthetic valves do not require long‐term anticoagulation but have less durability than mechanical valves (Mendelson and Schoen, 2006). In addition, both mechanical and bioprosthetic valves are acellular and do not repair, remodel or grow with the patient. The ability of a prosthetic heart valve to grow is particularly important for paediatric patients, who may require several heart valve replacements.
Decellularized xenogeneic heart valves have been proposed as an alternative to glutaraldehyde‐fixed or cryopreserved heart valves for valve replacements in aortic valve disease. Fixed heart valves often fail due to progressive tissue deterioration and/or calcification of the valve leaflets, where it is thought that the fixation process stabilizes calcifiable structures in the tissue (Schoen and Levy, 2005). Without viable cells to maintain homeostasis of the tissue, the calcification and tissue deterioration occur unchecked until valve failure. Decellularized valves aim to improve outcomes by removing these calcifiable structures and providing a biomaterial scaffold for host cell infiltration. Decellularized engineered tissue fabricated from human cells presents an attractive allogeneic matrix for regenerative medicine use. Recellularization by host tissue cells following implantation of decellularized engineered valves (Driessen‐Mol et al., 2014) and vascular grafts (Dahl et al., 2011; Syedain et al., 2014) has occurred in healthy animals, but this is not yet established in aged humans with systemic cardiovascular disease. Recellularization of decellularized tissues prior to implantation would ensure that viable cells that can maintain the extracellular matrix (ECM) are present, at least initially. Whereas surface‐seeded cells are subjected to shear forces due to blood flow, cells that are integrated into the matrix following invasion of the matrix are protected from shear‐induced detachment and are more likely to be retained.
In vivo recellularization of decellularized native valve leaflets has proved to be difficult. For example, decellularized sheep pulmonary valves implanted in the pulmonary position of juvenile sheep for 20 weeks showed limited recellularization (Quinn et al., 2011). A similar result was shown for decellularized pig aortic valves implanted in the aortic position of juvenile pigs for 6 months (Honge et al., 2011) and decellularized sheep valves implanted in the aortic position of juvenile sheep for 9 months (Baraki et al., 2009). In all of these cases, recellularization primarily occurred only in the valve root and leaflet nearest the commissures; very little recellularization was seen near the leaflet free edge.
The limited in vivo recellularization of decellularized tissues motivates the exploration of means to improve recellularization and reduce culture times. Several strategies have been proposed to improve the recellularization of decellularized tissues. The recellularization potential of decellularized porcine pulmonary valves was improved by conjugation of the CD133 antibody against endothelial progenitor cells (EPCs) in the decellularized tissue. The CD133 conjugated leaflets attracted more von Willebrand factor‐positive cells and α‐smooth muscle actin (αSMA)‐positive cells than the unconjugated controls. However, significant recellularization was not seen until 3 months (Jordan et al., 2012). Syedain et al. (2013a) showed that decellularized tissue‐engineered leaflet analogues were capable of complete recellularization with surface‐seeded human mesenchymal stem cells (hMSCs) in only 3 weeks of in vitro culture. Similarly, Iop et al. (2009) showed in vitro recellularization potential with MSCs seeded onto decellularized porcine and human pulmonary leaflets after 30 days.
The variables that influence the in vitro recellularization potential of decellularized engineered tissues, such as decellularization protocol, cell culture conditions and ECM alignment, have yet to be fully explored. The goal of this study was to assess the influence of two soluble factors commonly used to promote tissue growth, insulin and ascorbic acid and matrix alignment on the recellularization of decellularized engineered tissues by hMSCs. hMSCs were chosen because they are a clinically relevant autologous cell source that have been shown to be capable of differentiation towards a phenotype relevant to heart valve tissue engineering, the fibroblast‐like valvular interstitial cell (VIC), which maintains the homeostasis of valvular tissue in vivo. MSCs exhibited stretching‐stimulated collagen expression, like VICs (Ku et al., 2006).
Matrix alignment was explored because some approaches to engineered tissue fabrication lead to strong matrix alignment, to mimic the structural and mechanical anisotropy found in arteries and heart valve leaflets, whereas most approaches do not. Since matrix alignment induces a contact‐guidance response, the tendency of cells to orientate and migrate bidirectionally along matrix fibres, we hypothesized that cells seeded on a matrix would invade differently if the matrix were aligned rather than non‐aligned. These matrices were made by decellularizing tissues made from fibroblast‐remodelled fibrin gel, which are suitable for implantation as engineered arteries (Syedain et al., 2014) and tubular heart valves (Syedain et al., 2013b), using different moulds to present different mechanical constraints to the cell‐induced gel contraction that drives alignment.
Insulin‐like growth factors have been shown to increase MSC migration in vitro. Culture of rat MSCs in the presence of insulin‐like growth factor 1 (IGF‐1) increased the expression of the chemokine receptor CXCR4 and increased the migration of rat MSCs towards stromal‐derived factor 1 (SDF‐1), but did not increase rat MSC proliferation (Li et al., 2007). hMSCs have also been shown to migrate in response to IGF‐1 (Ponte et al., 2007). Since insulin, IGF‐1 and IGF‐2 are all capable of binding to both the insulin receptor (IR) and insulin growth factor receptor 1 (IGF‐1R) (Ward and Lawrence, 2009), it is possible that insulin increases the motility of hMSCs through a similar mechanism as IGF‐1. Ascorbic acid has been shown to increase hMSC proliferation in vitro (Choi et al., 2008; Potdar and D'Souza, 2010; Gharibi and Hughes, 2012). We thus hypothesized that insulin and ascorbate will increase cell migration and proliferation, reducing the amount of culture time necessary to achieve recellularization.
2. Materials and methods
2.1. Cell culture
Neonatal human dermal fibroblast (nhDF; Clonetics) were maintained in a 50:50 mixture of Dulbecco's modified Eagle's medium and Ham's F12 cell culture medium (DMEM/F12; Cellgro) supplemented with 15% fetal bovine serum (FBS; Thermo‐Fisher Scientific), 100 U/ml penicillin and 100 µg/ml streptomycin. Cells were incubated at 37 °C in 100% humidity and 5% CO2, passaged at ~90% confluence and harvested for use at passage 9 (P9).
hMSCs (Lonza) from a male donor aged 43 years were maintained in mesenchymal stem cell growth medium (MSCGM; Lonza). The cells were incubated at 37 °C in 100% humidity and 5% CO2, passaged at ~80% confluence and harvested for use at passage 6–7.
2.2. In vitro differentiation of hMSCs
In vitro differentiation assays were performed on hMSCs at P6. For adipogenic and osteogenic differentiation, differentiation medium was added to the confluent monolayers of cells twice weekly for 3 weeks. For chondrogenic differentiation, differentiation medium was added to micromass cell pellets three times weekly for 3 weeks. Micromass cell pellets were formed by centrifuging 250,000 hMSCs at P6 in a 5 ml conical tube (see supporting information, Table S1, for the composition of the differentiation media).
After 3 weeks of culture, samples were fixed in 4% paraformaldehyde for 10 min at 25 °C, washed with PBS and stained with alizarin red S (calcium mineralization, osteogenic differentiation), oil red O (neutral lipid uptake, adipogenic differentiation), and Alcian blue (sulphated proteoglycans, chondrogenic differentiation).
2.3. Engineered tissue preparation and culture
An nhDF‐seeded fibrin gel was formed by adding thrombin (Sigma) and calcium chloride in 20 mm HEPES‐buffered saline to a suspension of nhDF in fibrinogen (Sigma). All components were kept on ice before mixing. The final component concentrations of the cell suspension were as follows: 4 mg/ml fibrinogen, 1.1 U/ml thrombin, 5.0 mm Ca2+, and 1 million cells/ml. This cell suspension was mixed and poured into six‐ or 12‐well plates containing moulds with porous polyethylene surfaces, as detailed next, which serve to anchor and mechanically constrain the resulting fibrin gel from cell‐induced gel compaction, allowing for control of tissue size, shape and alignment. For matrix contraction studies and invasion studies for different DMEM supplementations, 15 mm rings were punched out of porous polyethylene sheets (Porex Technologies, Porex XM‐1237), sonicated in isopropanol and autoclaved before being placed in 12‐well plates and covered with 2 ml fibrin‐forming cell suspension. For studies of aligned vs non‐aligned matrices, 5 ml of this suspension was poured into six‐well plates containing a C‐shape (aligned) or circular (non‐aligned) 312‐stainless wire (McMaster Inc.) attached to a polyethylene mesh. All plates were pretreated with 5% Pluronic F‐127 solution (Sigma) for 1 h and allowed to dry prior to casting the gels in order to minimize subsequent gel adhesion to the plate.
After injecting 5 or 2 ml of the fibrin‐forming cell suspension into the six‐ or 12‐well mould cavities, respectively, the moulds were placed in a humidified incubator and maintained at 37 °C, 5% CO2 for 20 min to allow for gelation. Subsequently, an equal volume of DMEM supplemented with 10% FBS, 100 U/ml penicillin, 100 µg/ml streptomycin, 2 µg/ml insulin, 50 µg/ml ascorbic acid (supplemented DMEM) was added. One day after casting, the moulds were detached from the well and eight moulds were transferred to a larger jar with 100 ml supplemented DMEM and incubated on an orbital shaker for 5 weeks; 70% of the medium was changed three times a week to promote collagen deposition.
2.4. Decellularization
After 5 weeks of culture, tissues were rinsed in phosphate‐buffered saline (PBS) and incubated on a shaker for 4 or 24 h with 1% sodium dodecyl sulphate (SDS; Sigma). For the 4 h SDS treatment protocol, the SDS solution was changed hourly. For the 24 h SDS treatment, the SDS solution was changed at 30 min, 1 h and 4 h. From this point forward, the engineered tissues are referred to as 'tissues' and the decellularized engineered tissues are referred to as 'matrices'. The matrices were then rinsed in PBS and incubated with 1% Triton X‐100 (Sigma) for 30 min. The matrices were extensively washed with PBS for 48 h and incubated in deoxyribonuclease enzyme (Sigma) in the DMEM supplemented with 10% FBS for 4 h.
2.5. hMSCs seeding onto decellularized tissues
The matrices were transferred to a six‐ or 12‐well plates and incubated in DMEM containing 10% FBS for 4 h prior to being seeded on one side with a 1 million cells/ml p6 hMSC suspension, using 40 µl for 12‐well matrices, 100 µl for six‐well non‐aligned matrices, and 50 µl for six‐well aligned matrices. After 3 h of incubation at 37 °C, 5% CO2, 5 ml MSCGM, DMEM +10% serum (DMEM – supp), DMEM +10% FBS +50 µg/ml ascorbic acid, DMEM +10% FBS +2 µg/ml insulin, or DMEM +10% FBS +50 µg/ml ascorbic acid and 2 µg/ml insulin (DMEM + supp) was added to each well. All media contained 100 U/ml penicillin and 100 µg/ml streptomycin. Complete medium changes occurred three times weekly until harvest at 3 weeks.
2.6. Polarized light imaging
Polarized light imaging was used to characterize alignment of birefringent structures in the matrices, which histology suggests to be predominantly collagen fibrils. Polarized light imaging was conducted as previously described (Tower et al., 2002). Briefly, a fibre source (Technispec), focusing lens (Edmund Scientific) and computer‐controlled rotation (Mill‐Shaf Technologies) of a linear polarizer sheet (Edmund Scientific) provided wide‐field illumination of a sample with linearly polarized light of variable transmission axes. Images were acquired in transmission mode at each of 20 rotation angles of the linear polarizer over the range 0–180°, using a CCD device camera (Hitachi) and an effective circular analyser made from a linear polarizer and a quarter‐wave sheet (Oriel). Acquisition and image processing were done in Labview (National Instrument) and Matlab (MathWorks), respectively.
2.7. Uni‐axial tensile mechanical testing
Strips cut from each sample were tested for tensile properties, both parallel and perpendicular to the presumed direction of alignment. For matrices, mechanical properties were measured after extensive washing with PBS. The thickness of each strip was measured using a 50 g force probe attached to a displacement transducer. Strips were placed in compressive grips, attached to the actuator arm and load cell of an Instron MicroBionix (Instron Systems) and straightened with an applied load of 0.005 N. This position was used as the reference length of the strip. After six cycles of 0–10% strain conditioning at 2 mm/min, strips were stretched to failure at the same rate. True strain was calculated based on the natural log of the tissue length divided by the reference length. The (engineering) stress was calculated as force divided by the initial cross‐sectional area. The tangent modulus (E) was determined as the slope of the linear region of the stress–strain curve before failure. The peak stress was defined as ultimate tensile strength (UTS). Anisotropy of mechanical properties was determined by defining the 'UTS ratio' and 'modulus ratio', where these ratios are defined as the value in the aligned direction divided by the value in the direction perpendicular to alignment. The aligned direction was arbitrarily defined in non‐aligned samples.
2.8. Collagen and cell quantification
Collagen content was quantified using a hydroxyproline assay previously described, assuming 7.46 mg collagen/mg hydroxyproline (Stegemann and Stalder, 1967). The cell content was quantified with a modified Hoechst assay for DNA assuming 7.7 pg DNA/cell (Kim et al., 1988). Sample volume was calculated using the measured length, width and thickness of the strips.
2.9. Histology
Samples were fixed for 3 h in 4% paraformaldehyde at 4 °C, infiltrated with a solution of 30% sucrose and 5% DMSO at 4 °C, frozen in OCT (Tissue‐Tek) via a slurry of prechilled isopentane in liquid N2 and sectioned into 9 µm cross‐sections. All sections were cross‐sections; for the aligned matrices, they were cut perpendicular to the direction of compaction (i.e. sections in the y–z plane; see Figure 1). Sections were stained with Lillie's trichrome, picosirius red, alizarin red, oil red O and Alcian blue, according to established protocols (Carson and Hladik, 2009).
Figure 1.
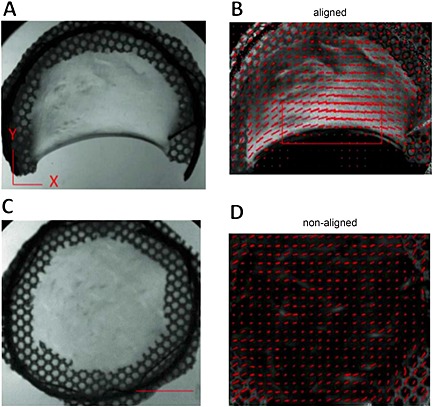
Macroscopic view of aligned (A) and non‐aligned (C) matrices. Polarized light imaging shows that aligned matrices (B) exhibit alignment perpendicular to the direction of compaction and that non‐aligned matrices (D) exhibit no alignment in the x–y plane. Red segments, magnitude and direction of alignment, based on polarimetry; red box, area of tissue sampled for analysis; scale bar =1 cm; images representative of n =6 samples
2.10. Immunostaining
Sections were stained for αSMA (1:200; Sigma A5228), collagen type I (1:200; Novus NB600‐408) fibronectin (1:500; Abcam ab6584), and calponin (1:200; Abcam ab110128). All samples were blocked with 5% normal donkey serum for 2 h before incubation in the primary antibody overnight. The samples were then stained with a Cy3 fluorescent‐labelled secondary antibody (Jackson Immuno Lab) at 1:200 dilution and nuclear Hoechst stain (1:10 000).
2.11. Quantification of cell invasion
Cell invasion was determined from DAPI‐stained sections by a custom‐made MATLAB® script. For each sample, four to eight cross‐sections spaced ~100 µm apart were cut. Briefly, the user defines the tissue surface of the section by selecting a series of representative points on the tissue surface. The MATLAB program then determines the location of the centroid of each cell nucleus relative to the tissue surface, as well as the dimensions of the major and minor axes of the nucleus. Aspect ratio was defined as the length of the minor axis divided by the length of the major axis (a circular nucleus would have an aspect ratio of 1 and a nucleus shaped as a line would have an aspect ratio of 0). The program outputs histograms of the location and aspect ratio of the invaded cells for comparison.
2.12. Detection of hyaluronic acid and fluorescence quantification
Samples were washed with PBS, treated with 0.1% BSA for 1 h at room temperature and then biotinylated hyaluronic acid binding protein (HABP; Calbiochem) at 2 µg/ml in 3% BSA was applied for 16 h at 4 °C, followed by AlexaFluor 594‐conjugated streptavidin (Jackson Immuno Lab) at 1:500 for 30 min at room temperature. Images were converted to greyscale and the average pixel intensity of HABP labelling was determined using ImageJ.
2.13. Assay of hMSC‐induced matrix contraction
Circular 15 mm diameter samples of tissue, matrices or cell‐seeded matrices were evaluated for contractility. Either P9 nhDFs or P6 hMSCs were seeded onto matrices with 40 µl 1 million cells/ml cell suspension, incubated 3 h at 37 °C, 5% CO2 and treated with DMEM + supp, as described in section 2.5. After 24 h, the matrices within the ring were cut in half, using a surgical blade, and allowed to contract for 7 days. The samples were then washed with PBS, fixed with 4% paraformaldehyde for 10 min at 25 °C, washed with PBS and photographed. Images were processed and analysed using ImageJ. The images were converted to binary files and the area of the pixels within the gap caused by contraction was measured and normalized to the area corresponding to a 15 mm circle (the maximum gap area). The samples were then infiltrated with a solution of 30% sucrose and 5% DMSO at 4 °C. Mottled areas (containing opaque and translucent regions) were dissected from the tissue and frozen in OCT (Tissue‐Tek) via a slurry of prechilled isopentane in liquid nitrogen and cut into 9 µm cross‐sections.
2.14. αSMA intensity quantification
Sections were taken from mottled areas of hMSC‐seeded matrices treated with ascorbic acid for 1 week. Tissues were stained for αSMA (1:200; Sigma A5228) and Cy5 fluorescent‐labelled secondary antibody (1:400; Jackson Immuno lab) for imaging. The average pixel intensity was measured with ImageJ for each image located within the translucent or opaque regions. Values from multiple images within sections were averaged and used to compare relative αSMA expression between the two regions.
2.15. Statistics
For all experiments, n =3 or a higher sample number was used with samples pooled from at least two experiments, unless otherwise indicated. Statistical significance of differences between groups was determined using Student's t‐test for two treatments and one‐way ANOVA for more than two treatments, with the Tukey's post hoc test, in GraphPad Prism® software for Windows. Error bars in plots represent standard error of the mean (SEM). Any reference to a difference in the Results and Discussion sections implies statistical significance at the level p <0.05, unless otherwise indicated, and is also indicated by an asterisk (*) in the figures.
3. Results
3.1. Verification of MSC phenotype
hMSCs were expanded upon receipt from Lonza and cryopreserved at P4. After expansion to P6, the ability to achieve trilineage differentiation was tested. hMSCs retained their ability to differentiate into osteocytes, as indicated by an alizarin red stain for mineral deposits (see supporting information, Figure S1a), adipocytes as indicated by oil red O stain for neutral lipid uptake (see supporting information, Figure S1b), and chondrocytes as indicated by Alcian blue stain for sulphated proteoglycans (see supporting information, Figure S1c), when cultured for 3 weeks under the appropriate differentiation conditions. The expression of αSMA in subconfluent and confluent cultures was also tested. hMSCs expressed αSMA when subconfluent, but organized fibres were not seen (see supporting information, Figure S1d). However, when the hMSCs reached confluence, αSMA‐positive fibres were seen (see supporting information, Figure S1e).
3.2. Verification of matrix alignment
In order to characterize the alignment of aligned (C‐shaped) and non‐aligned (circular) matrices, two approaches were taken. First, polarized light imaging was used to determine the macroscopic alignment of the samples. When imaged under polarized light, aligned matrices (Figure 1A) showed alignment perpendicular to the direction of compaction (from one edge of the 'C' to the other), as indicated by the direction and magnitude of the red segments in Figure 1B. Due to the heterogeneity of the alignment maps, all sampling of aligned matrices was restricted to regions near the compacted edge (red box in Figure 1B). In comparison, non‐aligned samples (Figure 1C) did not exhibit alignment (Figure 1D). No obvious differences in these alignment patterns were seen before and after decellularization (data not shown).
The UTS ratio of aligned tissues was 2.20 ± 0.63 (n =5), whereas the UTS ratio of non‐aligned tissues was 1.02 ± 0.14 (n =6). After decellularization for 4 h, a time sufficient to remove 98.83 ± 0.57% (n =4) of the DNA, the UTS ratio of aligned matrices was 3.00 ± 0.48 (n =6), whereas the UTS ratio of non‐aligned matrices was 1.48 ± 0.24 (n =6) (Figure 2A). The UTS ratio in aligned matrices was higher when compared to non‐aligned matrices; however, there was no difference in aligned vs non‐aligned tissues. In addition, the UTS ratio of non‐aligned tissues and non‐aligned matrices was not statistically different from 1.00, which is the expected value in the absence of alignment. There was no difference in the UTS ratio between tissues and matrices in the aligned and non‐aligned caseds.
Figure 2.
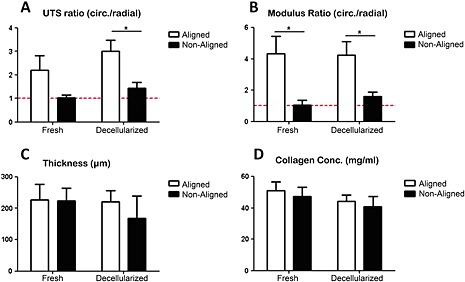
Properties of aligned and non‐aligned tissues and matrices: (A) UTS ratio; (B) modulus ratio; (C) thickness; (D) collagen content; *p <0.05
The modulus ratio of aligned tissues was 4.35 ± 1.11 (n =6), whereas the modulus ratio of non‐aligned tissues was 1.04 ± 0.32 (n =6). After decellularization for 4 h, the modulus ratio of aligned matrices was 4.25 ± 0.86 (n =6), whereas the modulus ratio of non‐aligned matrices was 1.61 ± 0.29 (n =6) (Figure 2B). The modulus ratio in aligned samples was higher when compared to non‐aligned samples for both tissues and matrices. In addition the modulus ratio of non‐aligned samples was not statistically different from 1.00, which is again the expected value in the absence of alignment. There was also no difference in the modulus ratio between tissues and matrices in the aligned and non‐aligned cases.
Finally, there were no differences in thickness (Figure 2C) and collagen content (Figure 2D) between any of the groups. The measured thicknesses were as follows: aligned tissues, 228 ± 21 µm (n =12); non‐aligned tissues, 222 ± 15 µm (n =12); aligned matrices, 225 ± 16 µm (n =12); non‐aligned matrices, 168 ± 29 µm (n =12). The measured collagen contents were as follows: aligned tissues, 51 ± 5 mg/ml (n =6); non‐aligned tissues, 47 ± 6 mg/ml (n =7); aligned matrices, 44 ± 4 mg/ml (n =6); non‐aligned matrices, 40 ± 7 (n =6).
Due to poor hMSC invasion into matrices following 4 h decellularization of tissues (data not shown), the decellularization time was increased to 24 h, removing 99.90 ± 0.07% (n =3) of the DNA. The mechanical properties of aligned matrices from 4 h decellularization were not different from previous studies with aligned matrices from 24 h decellularization (see supporting information, Table S2), so mechanical testing was not repeated on 24 h decellularized tissue.
3.3. Histology
Cross‐sections were analysed for all tissues and matrices; for the aligned samples, they were cut perpendicular to the direction of compaction (i.e. sections in the y–z plane, see Figure 1). Lillie's trichrome staining showed that aligned and non‐aligned tissues were composed primarily of collagen (blue‐green), with a homogeneous distribution of cells throughout the matrix (black; Figure 3A, B), except at the outer surfaces of both aligned (Figure 3B) and non‐aligned (Figure 3B) tissues. After 4 h decellularization, all cell nuclei were removed in both aligned (Figure 3C) and non‐aligned matrices (Figure 3D).
Figure 3.
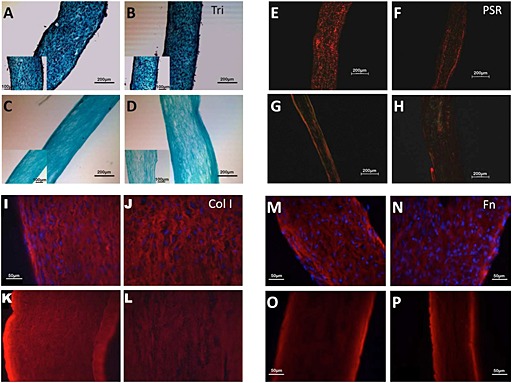
Histological evaluation of aligned and non‐aligned tissues and matrices. Lillie's trichrome stain of aligned tissue (A), non‐aligned tissue (B), aligned matrix (C) and non‐aligned matrix (D); scale bar =200 µm; inset scale bar =100 µm. Picrosirius red stain of aligned tissue (E), non‐aligned tissue (F), aligned matrix (G) and non‐aligned matrix (H); scale bar =200 µm. Collagen type I immunostaining of aligned tissue (I), non‐aligned tissue (J), aligned matrix (K) and non‐aligned matrix (L). Fibronectin immunostain of aligned tissue (M), non‐aligned tissue (N), aligned matrix (O) and non‐aligned matrix (P); scale bar =50 µm. All samples are cross‐sections, cut perpendicular to the direction of compaction for the aligned samples (y–z sections); images are representative of n >3 samples
Picrosirius red staining of cross‐sections showed organized collagen fibrils in tissues (Figure 3E, F) and matrices (Figure 3G, H). Both aligned (Figure 3E, G) and non‐aligned (Figure 3F, H) samples showed birefringence, suggesting that non‐aligned samples were transversely isotropic rather than isotropic. Acellular collagen gels did not show any birefringence when viewed under cross‐polarized light, as expected, since they should be isotropic (data not shown).
Immunostaining showed that both collagen type I and fibronectin were present in aligned (Figure 3I, M) and non‐aligned (Figure 3J, N) tissues. Furthermore, these proteins were retained after decellularization in both aligned (Figure 3K, O) and non‐aligned (Figure 3L, P) matrices. The staining pattern did not appear to change. The patterns were consistent with unidirectional alignment for the aligned samples and transverse isotropy for the non‐aligned samples.
3.4. Mesenchymal stem cell invasion
hMSCs were seeded onto non‐aligned matrices and cultured for 3 weeks in DMEM containing 10% FBS under four different supplementation conditions: DMEM; DMEM +50 µg/ml ascorbic acid; DMEM +2 µg/ml insulin; and DMEM +50 µg/ml ascorbic acid +2 µg/ml insulin. Within 1 week of culture, samples cultured in the presence of ascorbic acid (with or without insulin) began to display a 'mottled' appearance (Figure 4), which did not appear in the absence of ascorbic acid, or when using MSCGM instead of DMEM, at any point during the 3 week incubation. These translucent areas grew progressively in size within the initially opaque matrix until the entire matrix was translucent.
Figure 4.
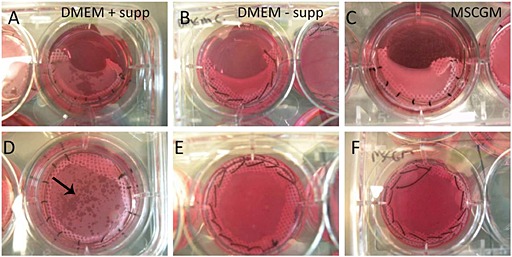
Macroscopic appearance of hMSCs reseeded on aligned (A–C) and non‐aligned (D–F) matrices after 1 week of culture. Matrices cultured in DMEM supplemented with insulin and ascorbate (+ supp) (A, D) displayed a 'mottled' appearance (black arrow), whereas matrices cultured in DMEM without supplements (– supp) (B, E) and MSCGM (C, F) did not
After 3 weeks of invasion, samples were harvested, sectioned and labelled with DAPI, and the number of cells/section, matrix thickness and median invasion depth were determined. The cellular density and median invasion depth were greater in all samples supplemented with ascorbic acid (with or without insulin; Figure 5) and the matrix was thinner compared to samples cultured in DMEM and DMEM supplemented with insulin (Table 1).
Figure 5.
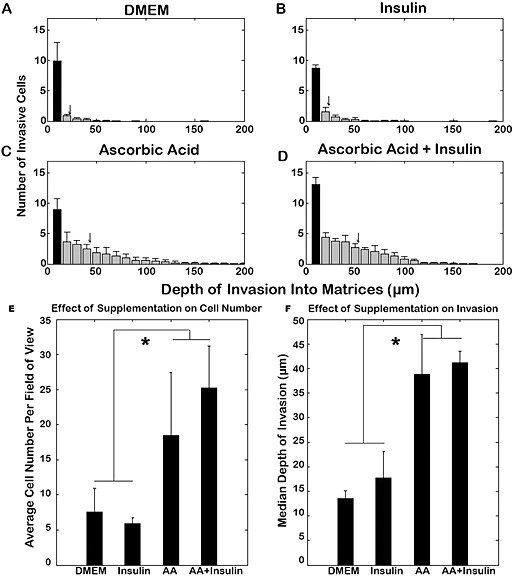
Invasion of hMSCs into non‐aligned matrices at 3 weeks: dependence on supplements. Distribution of hMSCs in matrices treated with DMEM (A) and DMEM supplemented with insulin (B), ascorbic acid (C) or ascorbic acid and insulin (D). Samples treated with either ascorbic acid or ascorbic acid and insulin together contained more cells (E) and a greater depth of invasion (F); *p <0.05
Table 1.
Effect of ascorbic acid and insulin supplementation on non‐aligned matrix invasion by MSCs
| Treatment | n | Average total cells/cross‐section | Average invading cells/cross‐section | Thickness (µm) | Median invasion depth (µm) |
|---|---|---|---|---|---|
| Ascorbic acid + insulin | 8 | 37.1 ± 1.7 | 25.2 ± 1.5 | 249 ± 19 | 41 ± 0.6 |
| Ascorbic acid | 8 | 26.8 ± 2.5 | 18.4 ± 2.3 | 281 ± 12 | 39 ± 2.0 |
| Insulin | 8 | 11.8 ± 0.3 | 5.9 ± 0.8 | 530 ± 13 | 18 ± 1.3 |
| DMEM | 6 | 11.5 ± 1.0 | 7.6 ± 1.1 | 511 ± 11 | 14 ± 0.5 |
Immunostaining for hyaluronic acid‐binding protein (HABP) revealed that HA was not detectable in the tissue and resulting matrix but was present in all MSC‐seeded matrices (Figure 6A B). HA was only evident near MSCs on the surface of matrices treated with DMEM and DMEM + insulin (Figure 6C, D), whereas HA expression was greatly increased and more homogeneously distributed in MSC‐seeded matrices containing ascorbic acid (Figure 6E, F), although the amount appeared to be greatest with both supplements (Figure 6F). HABP staining distant from cells indicates that HA diffusion through the matrix led to this more homogeneous distribution.
Figure 6.
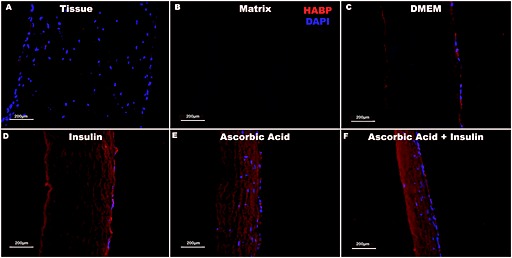
Hyaluronic acid‐binding protein distribution within tissue and matrices. Visualization of hyaluronic acid (HA) via immunostaining of hyaluronic acid binding protein (HABP) indicates that tissues (A) and matrices (B) do not contain detectable amounts of HA. HA is detectable on the surface of all MSC‐seeded matrices (C–F). HA deposition increases in the presence of insulin (D), ascorbic acid (E) and both supplements (F). Matrices treated with ascorbic acid (E, F) are also approximately 50% thinner and much more cellular than matrices incubated in DMEM only (C) or with insulin supplementation only (D). Scale bars =200 µm
To further investigate the 'mottled' appearance noted above, we conducted gelatin zymography on conditioned media from samples incubated with and without both supplements. This revealed no obvious differences in the pro‐MMP2 band, and there was little detectable active MMP‐2 or MMP‐9 (data not shown). In one experiment, we also measured matrix thickness, cellularity and relative levels of HA and αSMA in opaque vs translucent regions of mottled samples at 1 week (n =4). The matrix was thinner and cellularity, HA content, and αSMA expression were greater in translucent regions (Table 2).
Table 2.
Regional variation within same ascorbate‐treated samples at 1 week
| n | α‐SMA intensity (relative units) | Average cell number/FOV | Thickness (µm) | HABP intensity (relative units) | |
|---|---|---|---|---|---|
| Opaque | 4 | 25381 ± 14647 | 20 ± 3.9 | 367 ± 13.8 | 5.8E6 ± 3.2E5 |
| Translucent | 4 | 89795 ± 10148 | 31 ± 3.5 | 306 ± 19.4 | 6.6E6 ± 3.7E5 |
3.5. Orientation of invaded cells
hMSCs were seeded onto aligned and non‐aligned matrices and cultured under three different culture conditions: MSCGM; DMEM +10% FBS (DMEM – supp); and DMEM +10% FBS +50 µg/ml ascorbic acid +2 µg/ml insulin (DMEM + supp). After 3 weeks the matrices were harvested, sectioned and stained with DAPI.
There were substantially more invaded cells seen in aligned (Figure 7A; n =4) and non‐aligned (Figure 7D; n =5) matrices that were cultured in DMEM + supp. In comparison, there was minimal invasion in aligned (Figure 7B; n =2) and non‐aligned (Figure 7E; n =4) matrices that were cultured in DMEM – supp, although the seeded surface had a confluent monolayer of cells. Minimal invasion was also seen in aligned (Figure 7C; n =3) and non‐aligned (Figure 7F; n =4) matrices that were cultured in MSCGM. The seeded surface had a confluent monolayer of cells in this treatment group as well.
Figure 7.
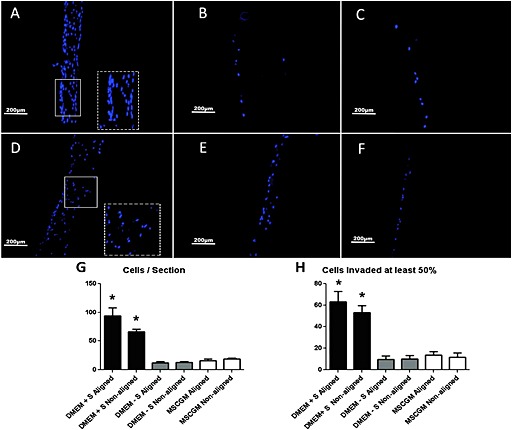
Invasion of hMSC into matrices at 3 weeks: dependence on matrix alignment. Aligned matrices cultured in DMEM + supp (A); aligned matrices cultured in DMEM – supp (B); aligned matrices cultured in MSCGM (C); non‐aligned matrices cultured in DMEM + supp (D); non‐aligned matrices cultured in DMEM – supp (E); and non‐aligned matrices cultured in MSCGM (F). Images representative of n >3 samples; S, supplements (supp); scale bar =200 µm. Insets in (A, D) are magnifications of indicated regions to show cell nucleus elongation and orientation. Number of cells/cross‐section (G) and number of cells that invaded at least half the matrix thickness (H). Non‐overlapping error bars are statistically different from each other (p <0.05)
The average numbers of cells in each section and the average numbers of cells that had invaded at least half the matrix thickness were calculated. Aligned and non‐aligned matrices that were cultured in DMEM + supp had more cells/section (Figure 7G) and cells that had invaded half the thickness of the matrix (Figure 7H) than all other groups. Aligned and non‐aligned matrices that were cultured in DMEM + supp were not different from each other. Histograms of cell invasion for each group are shown in Figure S2 (see supporting information). The aspect ratio of the invaded cell nuclei was also compared in aligned and non‐aligned matrices. The aspect ratio was evaluated from cross‐sections, again cut perpendicular to the direction of compaction (y–z sections) for the aligned matrices. Since the DMEM + supp group exhibited greater cell invasion, analysis was restricted to aligned and non‐aligned matrices from this group. As shown in Figure 8, the cells in aligned matrices had a lower aspect ratio than non‐aligned matrices, indicating that the cells that invaded aligned matrices were aligned in the direction of matrix alignment (i.e. perpendicular to the direction of compaction; see Figure 1). The distributions in Figure 8a b, were found to be different from each other by the Kolmogorov–Smirnov test (Figure 8C).
Figure 8.
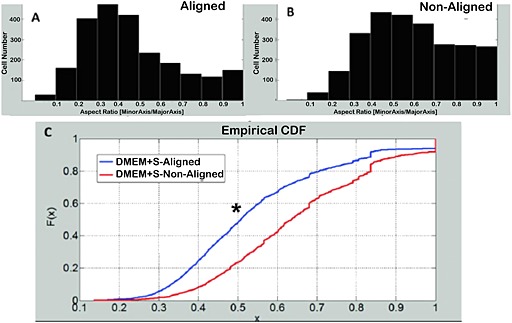
Nuclear orientation in 3 week recellularized matrices – dependence on matrix alignment. Histogram of nuclear aspect ratio for aligned DMEM + supp group (A). Histogram of nuclear aspect ratio for non‐aligned DMEM + supp group (B). (C) comparison of the cumulative distribution functions of each group shows that the alignment distributions are different from each other (p <0.05)
3.6. Differentiation of invaded cells
After 3 weeks of culture under the different medium conditions, aligned and non‐aligned matrices were harvested, sectioned and stained for differentiation markers. The differentiation markers analysed were as follows: oil red O (stains neutral lipid uptake, an indicator of adipogenic differentiation); alizarin red S (stains calcium deposits, an indicator of osteogenic differentiation); Alcian blue [stains sulphated glycosaminoglycans (GAGs), an indicator of chondrogenic differentiation]. αSMA and calponin are indicators of differentiation to a smooth muscle cell (SMC) or myofibroblast phenotype. There were no differences seen between aligned and non‐aligned matrices, so aligned matrices are shown for simplicity.
There was no indication of neutral lipid uptake in aligned matrices cultured in DMEM + supp (Figure 9B), DMEM – supp (Figure 9C) or MSCGM (Figure 9D) when compared to myocardium (Figure 9A). There was also no indication of calcium deposition in aligned matrices cultured in DMEM + supp (Figure 9F), DMEM – supp (Figure 9G) or MSCGM (Figure 9H) when compared to calficied artery tissue (Figure 9E). There was no indication of sulphated GAG synthesis in aligned matrices cultured in DMEM – supp (Figure 9K) or MSCGM (Figure 9L) when compared to human annulus fibrosus (Figure 9I). However, there appeared to be more staining in matrices cultured in DMEM + supp (Figure 9j). Finally, invaded cells in all matrices expressed αSMA (Figure 9N–P) to a greater or lesser extent compared to the nhDFs in the engineered tissue (Figure 9M), but cellular calponin staining was not above background. This result is in agreement with previously published work (Syedain et al., 2013a).
Figure 9.
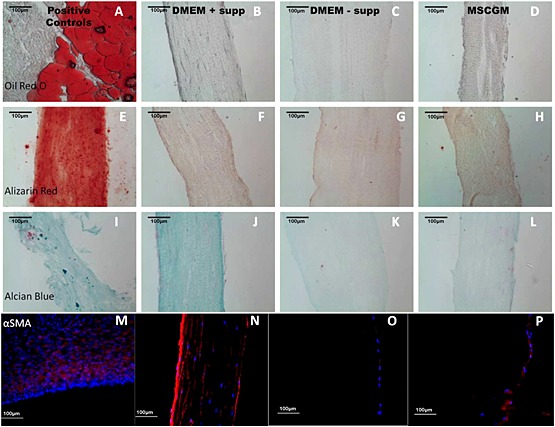
Differentiation of invaded cells: (A–D) oil red O; (E–H) alizarin red; (I–L) Alcian blue; (M–P) αSMA. Groups are labelled above the corresponding column. Images are representative of n >3 samples; scale bar =100 µm
3.7. hMSC‐induced matrix contraction
Contraction was measured in tissue, matrices and matrices seeded with nhDFs or hMSCs after being cut in half. After 7 days, the surface area lost to contraction was measured as: matrices 11%; nhDF‐seeded matrices 15%; hMSC‐seeded matrices 20%; and tissue 21% (see supporting information, Figure S3a–d). Tissue and hMSC‐seeded matrices were almost equally contracted and different from spontaneous contraction of matrices, while contraction of nhDF‐seeded matrices was not different from any other group. Histology revealed that the nhDFs had invaded and proliferated (data not shown), whereas the hMSCs were largely localized on the surface, with strong αSMA expression (see supporting information, Figure S3n). Interestingly, when entrapped in a floating collagen gel, nhDFs caused significant gel contraction, whereas little contraction resulted from hMSCs (data not shown).
4. Discussion
The use of decellularized tissue in the development of tissue‐engineered heart valves has been proposed as an alternative to chemically fixed xenogeneic valves. Decellularized tissues aim to reduce the calcification and degradation associated with chemically fixed valves by removing calcifiable structures and providing a biomaterial scaffold that supports host cell infiltration. However, to date, recellularization of decellularized native tissues has proved to be difficult. Previous work in our laboratory has shown that in vitro recellularization of decellularized engineered matrices is possible within 3 weeks of culture, but this study did not fully explore the variables that influence hMSCs invasion into these matrices (Syedain et al., 2013b). The goal of this work was to investigate the influence of ECM alignment and the soluble factors insulin and ascorbic acid on the recellularization of decellularized engineered tissues by hMSCs.
By specifying the geometry and associated mechanical constraints to fibroblast‐mediated fibrin gel contraction using circular and C‐shaped moulds, the creation of aligned and non‐aligned tissues was possible. The matrix alignment (or lack of alignment) was confirmed, both prior to and following decellularization, via polarized light imaging, immunohistochemistry for collagen I and mechanical anisotropy. As expected, the UTS and modulus ratio of aligned tissue were higher than their non‐aligned counterparts, since the load‐bearing collagen fibres were aligned with the direction of uniaxial testing. The mechanical anisotropy did not appear to be influenced by exposure of the tissues to decellularization detergents, supporting the polarized light imaging results that the fibre alignment does not change with decellularization, and is consistent with results shown for decellularized rat ventricles and porcine thoracic aorta (Witzenburg et al., 2012; Zou and Zhang, 2012).
Evaluation of histological sections showed that decellularization effectively removed cell nuclei but preserved the ECM proteins collagen type I and fibronectin, which are important for hMSC adhesion (Goessler et al., 2008; Semon et al., 2010). Preservation of collagens and fibronectin after decellularization of tissues has previously been reported in the literature (Ott et al., 2008). Interestingly, birefringence was seen in cross‐sections of non‐aligned samples; this suggests that the matrix is not isotropic but rather is transversely isotropic (i.e. random organization in the x–y plane, but different properties normal to the x–y plane). This is not entirely surprising, since although non‐aligned matrices are prevented from compacting laterally, they were still able to compact the thickness of the gel, inducing alignment of ECM in the plane normal to the thickness direction (Barocas and Tranquillo, 1997). Immunohistochemical staining for collagen I was consistent with transverse isotropy of non‐aligned samples and unidirectional alignment of aligned samples.
hMSCs were seeded onto the decellularized aligned and non‐aligned matrices and cultured in different media for 3 weeks for assessment of cell invasion. In matrices cultured with complete medium supplemented with ascorbic acid, or with insulin and ascorbic acid, the matrix displayed translucent 'patches' that appeared after 1 week of culture, even though the cells were still localized to the surface. These patches grew with extended culture until the entire matrix appeared translucent. There were no qualitative differences in MMP‐2 activity potential in medium from these samples, suggesting that the effect was not due to secreted MMP‐2. We did observe that HA was more abundant in the translucent regions compared to opaque regions, based on staining for HABP. The interaction of HA and the HA receptor CD44 is a well‐established mechanism of cell motility in CD44‐expressing cells, such as MSCs (Aruffo et al., 1990; Lesley and Hyman, 1998; Poulsom, 2007; 2006). Ascorbic acid is also involved in cell‐dependent depolymerization of HA (Edward and Oliver, 1983; Motohashi and Mori, 1985; Fink and Lengfelder, 1987), reducing HA from its high molecular weight form (106–107 Da) into varying sizes of low molecular weight HA (0.1–1 × 10⁶ Da), which have very different and often the opposite effects on cell adhesion, proliferation, differentiation and migration of cells (Kouvidi et al., 2011; Maharjan et al., 2011). The HA‐rich translucent regions were also thinner and more cellular, with the cells also staining more strongly for αSMA. The degree of thinning was more pronounced in these studies than our previous studies (Syedain et al., 2013a), which may reflect the different lots of hMSCs and fibrinogen used and/or a greater initial sample thickness used in the present study.
Less invasion occurred in aligned and non‐aligned matrices that were cultured in cell culture medium without supplemented ascorbic acid. Both aligned and non‐aligned matrices that were cultured with supplemented ascorbic acid showed an increase in cellularity and in the number of cells invading at least half the thickness of the matrix, but the invasions of aligned and non‐aligned matrices by these metrics were not different from each other. Nuclei of cells that invaded aligned matrices appeared more elongated when compared to cells that had invaded non‐aligned matrices. Furthermore, cells were primarily aligned with the direction of matrix alignment, based on nuclear orientation, suggesting that they were aligned with the matrix fibres via contact guidance (Guido and Tranquillo, 1993; Tranquillo et al., 1996). The fact that there were more circular nuclei seen in non‐aligned matrices and few nuclei orientated in the (z–) direction of the thickness of these matrices supports our inference from the polarized light microscopy and collagen I immunohistochemistry, that the non‐aligned matrices were transversely isotropic. We also infer that cells invading both aligned and non‐aligned matrices migrated preferentially within the plane, and that cell speed and directional persistence in the corresponding principal directions were similar (i.e. in the plane and thickness direction for non‐aligned matrices, and in the commissural axis and thickness direction for aligned matrices), consistent with no obvious differences in the invasion profiles between aligned and non‐aligned samples. Thus, our hypothesis that cells seeded on a matrix would invade differently if the matrix were aligned vs non‐aligned was not supported by the data.
Several other studies have explored the influence of ECM or synthetic fibre alignment on in vitro cell proliferation and invasion. SMCs derived from hair follicle stem cells (HF‐SMCs) seeded onto decellularized small intestinal submucosa (SIS) for 2 weeks were only found to invade into SIS when 10% static strain was applied (Peng et al., 2011); 10% static strain induced alignment of the ECM fibres in the SIS. Cells that were seeded onto unstrained tissue were round and non‐proliferative, whereas cells that were seeded onto strained tissue were proliferative and elongated in the direction of strain. Similarly, Kurpinski et al. (2010) showed that aligned poly‐l‐lactide (PLLA) scaffolds supported greater invasion of bovine aortic endothelial cells (BAECs) after 1 week of in vitro culture. In both of these studies, the porosity of the aligned and non‐aligned samples did not appear qualitatively different, although quantification was not performed. These data suggest that fibre alignment influences the invasion of these cell types. It is possible that modification of the alignment of these scaffolds created an environment more suitable for surface penetration and migration within the matrix, e.g. by changing the porosity of the matrix. These differences may not have been as pronounced in our matrices.
Finally, our results suggest that contact with decellularized matrices does not induce spontaneous differentiation towards an adipogenic or osteogenic phenotype, independent of culture conditions. However, invaded cells cultured in the presence of insulin and ascorbic acid appeared to stain more intensely for Alcian blue, suggesting that this condition stimulated production of sulphated GAGs. The cells on the matrix surface also stained strongly positive for αSMA and negative for calponin, indicating a myofibroblast or early SMC phenotype. Although these cells did not express calponin, it was upregulated by the presence of ascorbic acid in cultured cells. These data suggest that there are differences in hMSC differentiation when cultured in two dimensions (2D) vs three dimensions (3D), consistent with prior studies (Breyner et al., 2010; Tseng et al., 2012).
The presence of sulphated GAGs is commonly used as an indicator of chondrogenic differentiation; however, it is not a definitive indicator, since sulphated GAGs are also present in the artery (Kawamura et al., 2005). MSCs grown as cell sheets for 2–3 weeks were also stained positively for Alcian blue when stimulated with transforming growth factor‐β1 (TGFβ1) and ascorbic acid (Williams et al., 2012) These hMSC cell sheets also expressed αSMA, calponin and SM22α, and produced significant amounts of collagen and elastin. This result was confirmed, as extended culture of hMSCs in the presence of ascorbic acid increased protein expression for αSMA and calponin. Since the culture supplements to induce smooth muscle differentiation and chondrogenic differentiation are similar, soluble factors alone may not suffice to determine hMSCs differentiation towards these phenotypes (Vater et al., 2011). Furthermore, Park et al. (2011) found that there was an interaction between substrate stiffness and TGFβ1 signalling, where hMSCs cultured on soft substrates in the presence of TGFβ1 led to a decrease in αSMA and calponin expression and an increase in collagen II expression. Taken together, these data suggest that, although the invaded hMSCs may not be fully differentiated towards a mature phenotype, it is unlikely that they will be further differentiated towards a chondrocyte phenotype, due to the high‐stiffness environment to which the cells are exposed and their pronounced αSMA expression.
Fibre alignment has been shown to have an influence on the differentiation of stem cells in 3D systems. Human tendon stem/progenitor cells, which are phenotypically similar to hMSCs, increase tendon‐related gene expression when cultured on aligned PLLA scaffolds, as opposed to an increase in osteocyte‐related gene expression when cultured on isotropic PLLA scaffolds (Yin et al., 2010) This result occurred even when cultured under osteogenic culture conditions, suggesting that fibre alignment suppresses osteogenic differentiation. hMSCs were shown to increase expression of cardiac myocyte‐related genes when cultured on aligned polycaprolactone (PCL) scaffolds, when compared to isotropic PCL scaffolds (Wang et al., 2013). Similarly, protein expression of cardiac myosin heavy chain (MHC) was upregulated in hMSCS that were cultured on micropatterned PLGA scaffolds (Tay et al., 2010). However, differentiation differences were not evident in our aligned vs non‐aligned matrices.
In summary, these studies show that supplementation of complete DMEM with ascorbic acid, but not insulin, is sufficient to promote invasion of hMSCs into these decellularized engineered tissues. We show that this ascorbate‐stimulated invasion is due to increases in both proliferation and migration. Invasion correlated with an increase in hyaluronic acid deposition, αSMA expression of cells on the matrix surface and matrix contraction. Furthermore, hMSC invasion into aligned and non‐aligned matrices was not different, although there was a difference in cell orientation between aligned and non‐aligned matrices, based on nuclear aspect ratio measurements. Finally, we show that hMSCs on the matrix surface appear to differentiate toward a smooth muscle cell or myofibroblast phenotype with ascorbic acid treatment.
In conclusion, ascorbic acid‐supplemented complete DMEM is effective for the recellularization of aligned and non‐aligned decellularized engineered tissues with autologous hMSCs prior to implantation. For heart valve replacement applications, there must be accommodation of the consequent matrix contraction in the heart valve design to ensure maintenance of co‐aptation, which can readily be done if the matrix contraction does not progress after implantation. For vascular graft applications, counteracting blood pressure may abrogate this matrix contraction. Conversely, limited hMSC invasion and no matrix contraction results with medium lacking ascorbate supplementation, but the few cells that invade may suffice to ensure recellularization following implantation.
Conflict of interest
The authors have declared that there is no conflict of interest.
Author contributions
NKW, DLM and NTK performed the research and data analysis; NKW, DLM and RTT designed the research study and wrote the manuscript; and FLL contributed data analysis software.
Supporting information
Figure S1. Differentiation of hMSCs after 3 weeks of culture
Figure S2. Histograms of hMSCs invasion under different conditions
Figure S3. Assay of hMSC‐induced matrix contraction
Table S1. Differentiation medium composition
Table S2. Influence of decellularization time on mechanical properties of aligned matrices
Supporting info item
Supporting info item
Supporting info item
Acknowledgements
The authors would like to acknowledge Naomi Ferguson and Sandy Johnson for technical assistance. Funding was provided by the National Institutes of Health (NIH; Grant Nos HL107572 and HD060536).
Weidenhamer, N. K. , Moore, D. L. , Lobo, F. L. , Klair, N. T. , and Tranquillo, R. T. (2015), Influence of culture conditions and extracellular matrix alignment on human mesenchymal stem cells invasion into decellularized engineered tissues. J Tissue Eng Regen Med, 9, 605–618. doi: 10.1002/term.1974.
The copyright line for this article was changed on 31 July 2018 after original online publication
References
- Aruffo A, et al. 1990; CD44 is the principal cell surface receptor for hyaluronate. Cell 61: 1303–1313. [DOI] [PubMed] [Google Scholar]
- Baraki H, Tudorache I, Braun M et al. 2009; Orthotopic replacement of the aortic valve with decellularized allograft in a sheep model. Biomaterials 30: 6240–6246. [DOI] [PubMed] [Google Scholar]
- Barocas VH, Tranquillo RT. 1997; An anisotropic biphasic theory of tissue‐equivalent mechanics: the interplay among cell traction, fibrillar network deformation, fibril alignment, and cell contact guidance. J Biomech Eng 119: 137–145. [DOI] [PubMed] [Google Scholar]
- Breyner NM, Hell RCR, Carvalho LRP et al. 2010; Effect of a three‐dimensional chitosan porous scaffold on the differentiation of mesenchymal stem cells into chondrocytes. Cells Tissues Organs 191: 119–128. [DOI] [PubMed] [Google Scholar]
- Carson FL, Hladik C. 2009; Histotechnology: A Self‐Instructional Text. American Society for Clinical Pathology: Chicago, IL, USA. [Google Scholar]
- Choi KM, Seo YK, Yoon HH et al. 2008; Effect of ascorbic acid on bone marrow‐derived mesenchymal stem cell proliferation and differentiation. J Biosci Bioeng 105: 586–594. [DOI] [PubMed] [Google Scholar]
- Dahl SL, Kypson AP, Lawson JH, et al. 2011; Readily available tissue‐engineered vascular grafts. Sci Transl Med 3: 68ra9. [DOI] [PubMed] [Google Scholar]
- Driessen‐Mol A, Emmert MY, Dijkman PE et al. 2014; Transcatheter implantation of homologous 'off‐the‐shelf' tissue‐engineered heart valves with self‐repair capacity: long‐term functionality and rapid in vivo remodeling in sheep. J Am Coll Cardiol 63: 1320–1329. [DOI] [PubMed] [Google Scholar]
- Edward M, Oliver RF. 1983; Changes in the synthesis, distribution and sulphation of glycosaminoglycans of cultured human skin fibroblasts upon ascorbate feeding. J Cell Sci 64: 245–254. [DOI] [PubMed] [Google Scholar]
- Fink RM, Lengfelder E. 1987; Hyaluronic acid degradation by ascorbic acid and influence of iron. Free Radic Res Commun 3: 85–92. [DOI] [PubMed] [Google Scholar]
- Gharibi B, Hughes FJ. 2012; Effects of medium supplements on proliferation, differentiation potential, and in vitro expansion of mesenchymal stem cells. Stem Cells Transl Med 1: 771–782. [DOI] [PMC free article] [PubMed] [Google Scholar]
- Goessler UR, Bugert P, Bieback K et al. 2008; Integrin expression in stem cells from bone marrow and adipose tissue during chondrogenic differentiation. Int J Mol Med 21: 271. [PubMed] [Google Scholar]
- Guido S, Tranquillo RT. 1993; A methodology for the systematic and quantitative study of cell contact guidance in oriented collagen gels: correlation of fibroblast orientation and gel birefringence. J Cell Sci 105: 317–331. [DOI] [PubMed] [Google Scholar]
- Honge JL, Funder J, Hansen E et al. 2011; Recellularization of aortic valves in pigs. Eur J Cardiothorac Surg 39: 829–834. [DOI] [PubMed] [Google Scholar]
- Iop L, Renier V, Naso F et al. 2009; The influence of heart valve leaflet matrix characteristics on the interaction between human mesenchymal stem cells and decellularized scaffolds. Biomaterials 30: 4104–4116. [DOI] [PubMed] [Google Scholar]
- Jordan JE, Williams JK, Lee SJ et al. 2012; Bioengineered self‐seeding heart valves. J Thorac Cardiovasc Surg 143: 201–208. [DOI] [PubMed] [Google Scholar]
- Kawamura K, Chu CR, Sobajima S et al. 2005; Adenoviral‐mediated transfer of TGF‐β1 but not IGF‐1 induces chondrogenic differentiation of human mesenchymal stem cells in pellet cultures. Exp Hematol 33: 865–872. [DOI] [PMC free article] [PubMed] [Google Scholar]
- Kim YJ, Sah RLY, Doong JYH et al. 1988; Fluorometric assay of DNA in cartilage explants using Hoechst 33258. Anal Biochem 174: 168–176. [DOI] [PubMed] [Google Scholar]
- Kouvidi K, Berdiaki A, Nikitovic D et al. 2011; Role of receptor for hyaluronic acid‐mediated motility (RHAMM) in low molecular weight hyaluronan (LMWHA)‐mediated fibrosarcoma cell adhesion. J Biol Chem 286: 38509–38520. [DOI] [PMC free article] [PubMed] [Google Scholar]
- Ku CH, Johnson PH, Batten P et al. 2006; Collagen synthesis by mesenchymal stem cells and aortic valve interstitial cells in response to mechanical stretch. Cardiovasc Res 71: 548–56. [DOI] [PubMed] [Google Scholar]
- Kurpinski KT, Stephenson JT, Janairo RRR et al. 2010; The effect of fiber alignment and heparin coating on cell infiltration into nanofibrous PLLA scaffolds. Biomaterials 31: 3536–3542. [DOI] [PMC free article] [PubMed] [Google Scholar]
- Lesley J, Hyman R. 1998; CD44 structure and function. Front Biosci 3: d616–630. [DOI] [PubMed] [Google Scholar]
- Li Y, Yu X, Lin S et al. 2007; Insulin‐like growth factor 1 enhances the migratory capacity of mesenchymal stem cells. Biochem Biophys Res Commun 356: 780–784. [DOI] [PubMed] [Google Scholar]
- Maharjan AS, Pilling D, Gomer RH. 2011; High and low molecular weight hyaluronic acid differentially regulate human fibrocyte differentiation. PLoS One 6: e26078. [DOI] [PMC free article] [PubMed] [Google Scholar]
- Mendelson K, Schoen FJ. 2006; Heart valve tissue engineering: concepts, approaches, progress, and challenges. Ann Biomed Eng 34: 1799–1819. [DOI] [PMC free article] [PubMed] [Google Scholar]
- Motohashi N, Mori I. 1985; The effect of synovial fluid proteins in the degradation of hyaluronic acid induced by ascorbic acid. J Inorg Biochem 24: 69–74. [DOI] [PubMed] [Google Scholar]
- Ott HC, Matthiesen TS, Goh SK et al. 2008; Perfusion‐decellularized matrix: using nature's platform to engineer a bioartificial heart. Nat Med 14: 213–221. [DOI] [PubMed] [Google Scholar]
- Park JS, Chu JS, Tsou AD et al. 2011; The effect of matrix stiffness on the differentiation of mesenchymal stem cells in response to TGF‐β . Biomaterials 32: 3921–3930. [DOI] [PMC free article] [PubMed] [Google Scholar]
- Peng HF, Liu JY, Andreadis ST et al. 2011; Hair follicle‐derived smooth muscle cells and small intestinal submucosa for engineering mechanically robust and vasoreactive vascular media. Tissue Eng A 17: 981–990. [DOI] [PMC free article] [PubMed] [Google Scholar]
- Ponte AL, Marais E, Gallay N et al. 2007; The in vitro migration capacity of human bone marrow mesenchymal stem cells: comparison of chemokine and growth factor chemotactic activities. Stem Cells 25: 1737–1745. [DOI] [PubMed] [Google Scholar]
- Potdar PD, D'Souza SB. 2010; Ascorbic acid induces in vitro proliferation of human subcutaneous adipose tissue derived mesenchymal stem cells with upregulation of embryonic stem cell pluripotency markers Oct4 and SOX2. Hum Cell 23: 152–155. [DOI] [PubMed] [Google Scholar]
- Poulsom R. 2007; CD44 and hyaluronan help mesenchymal stem cells move to a neighborhood in need of regeneration. Kidney Int 72: 389–390. [DOI] [PubMed] [Google Scholar]
- Quinn RW, Hilbert SL, Bert AA et al. 2011; Performance and morphology of decellularized pulmonary valves implanted in juvenile sheep. Ann Thorac Surg , 92: 131–137. [DOI] [PubMed] [Google Scholar]
- Schoen FJ, Levy RJ. 2005; Calcification of tissue heart valve substitutes: progress toward understanding and prevention. Ann Thorac Surg 79: 1072–1080. [DOI] [PubMed] [Google Scholar]
- Semon J, Nagy L, Llamas C et al. 2010; Integrin expression and integrin‐mediated adhesion in vitro of human multipotent stromal cells (MSCs) to endothelial cells from various blood vessels. Cell Tissue Res 341: 147–158. [DOI] [PubMed] [Google Scholar]
- Stegemann H, Stalder K. 1967; Determination of hydroxyproline. Clin Chim Acta 18: 267–273. [DOI] [PubMed] [Google Scholar]
- Syedain ZH, Bradee AR, Kren S et al. 2013a; Decellularized tissue‐engineered heart valve leaflets with recellularization potential. Tissue Eng A 19: 759–769. [DOI] [PMC free article] [PubMed] [Google Scholar]
- Syedain ZH, Meier LA, Reimer JM et al. 2013b; Tubular heart valves from decellularized engineered tissue. Ann Biomed Eng 41: 2645–2654. [DOI] [PMC free article] [PubMed] [Google Scholar]
- Syedain ZH, Meier LA, Lahti MT et al. 2014; Implantation of completely biological engineered grafts following decellularization into the sheep femoral artery. Tissue Eng A 20: 1726–1734. [DOI] [PMC free article] [PubMed] [Google Scholar]
- Tay CY, Yu H, Pal M et al. 2010; Micropatterned matrix directs differentiation of human mesenchymal stem cells towards myocardial lineage. Exp Cell Res 316: 1159–1168. [DOI] [PubMed] [Google Scholar]
- Tower TT, Neidert MR, Tranquillo RT. 2002; Fiber alignment imaging during mechanical testing of soft tissues. Ann Biomed Eng 30: 1221–1233. [DOI] [PubMed] [Google Scholar]
- Tranquillo RT, Girton TS, Bromberek BA et al. 1996; Magnetically orientated tissue‐equivalent tubes: application to a circumferentially orientated media‐equivalent. Biomaterials 17: 349–357. [DOI] [PubMed] [Google Scholar]
- Tseng PC, Young TH, Wang TM et al. 2012; Spontaneous osteogenesis of MSCs cultured on 3D microcarriers through alteration of cytoskeletal tension. Biomaterials 33: 556–564. [DOI] [PubMed] [Google Scholar]
- Vater C, Kasten P, Stiehler M. 2011; Culture media for the differentiation of mesenchymal stromal cells. Acta Biomater 7: 463–477. [DOI] [PubMed] [Google Scholar]
- Vesely I. 2005; Heart valve tissue engineering. Circ Res 97: 743–755. [DOI] [PubMed] [Google Scholar]
- Wang Z, Teo EY, Chong MSK et al. 2013; Biomimetic three‐dimensional anisotropic geometries by uniaxial stretch of poly(ɛ‐caprolactone) films for mesenchymal stem cell proliferation, alignment, and myogenic differentiation. Tissue Eng C Methods 19: 538–549. [DOI] [PMC free article] [PubMed] [Google Scholar]
- Ward CW, Lawrence MC. 2009; Ligand‐induced activation of the insulin receptor: a multi‐step process involving structural changes in both the ligand and the receptor. Bioessays 31: 422–434. [DOI] [PubMed] [Google Scholar]
- Williams C, Xie AW, Emani S et al. 2012; A comparison of human smooth muscle and mesenchymal stem cells as potential cell sources for tissue‐engineered vascular patches. Tissue Eng A 18: 986–998. [DOI] [PubMed] [Google Scholar]
- Witzenburg C, Raghupathy R, Kren SM et al. 2012; Mechanical changes in the rat right ventricle with decellularization. Spec Issue Cardiovasc Solid Mech 45: 842–849. [DOI] [PMC free article] [PubMed] [Google Scholar]
- Yin Z, Chen X, Chen JL et al. 2010; The regulation of tendon stem cell differentiation by the alignment of nanofibers. Biomaterials 31: 2163–2175. [DOI] [PubMed] [Google Scholar]
- Zhu H, Mitsuhashi N, Klein A et al. 2006; The role of the hyaluronan receptor Cd44 in mesenchymal stem cell migration in the extracellular matrix. Stem Cells 24: 928–935. [DOI] [PubMed] [Google Scholar]
- Zou Y, Zhang Y. 2012; Mechanical evaluation of decellularized porcine thoracic aorta. J Surg Res 175: 359–368. [DOI] [PMC free article] [PubMed] [Google Scholar]
Associated Data
This section collects any data citations, data availability statements, or supplementary materials included in this article.
Supplementary Materials
Figure S1. Differentiation of hMSCs after 3 weeks of culture
Figure S2. Histograms of hMSCs invasion under different conditions
Figure S3. Assay of hMSC‐induced matrix contraction
Table S1. Differentiation medium composition
Table S2. Influence of decellularization time on mechanical properties of aligned matrices
Supporting info item
Supporting info item
Supporting info item