Abstract
BACKGROUND & AIMS
Hyperhomocysteinemia is often associated with liver and metabolic diseases. We studied nuclear receptors that mediate oscillatory control of homocysteine homeostasis in mice.
METHODS
We studied mice with disruptions in Nr0b2 (called SHP-null mice) Bhmt, or both genes (BHMT-null/SHP-null mice), along with mice with wild-type copies of these genes (controls). Hyperhomocysteinemia was induced by feeding mice alcohol (the NIAAA binge model) or chow diets along with water containing 0.18% DL-homocysteine. Some mice were placed on diets containing cholic acid (1%) or cholestyramine (2%), or high-fat diets (60%). Serum and livers were collected over a 24 hr light–dark cycle and analyzed by RNA-seq, metabolomic, and quantitative PCR, immunoblot, and chromatin immunoprecipitation assays.
RESULTS
SHP-null mice had altered timing in expression of genes that regulate homocysteine metabolism, compared with control mice. Oscillatory production of S-adenosylmethionine, betaine, choline, phosphocholine, glyceophosphocholine, cystathionine, cysteine, hydrogen sulfide, glutathione disulfide, and glutathione, differed between SHP-null mice and control mice. SHP inhibited transcriptional activation of Bhmt and Cth by FOXA1. Expression of Bhmt and Cth was decreased when mice were fed cholic acid but increased when they were placed on diets containing cholestyramine or high-fat content. Diets containing ethanol or homocysteine induced hyperhomocysteinemia and glucose intolerance in control but not SHP-null mice. In BHMT-null and BHMT-null/SHP-null mice fed a control liquid, lipid vacuoles were observed in livers. Ethanol feeding induced accumulation of macrovesicular lipid vacuoles to the greatest extent in BHMT-null and BHMT-null/SHP-null mice.
CONCLUSIONS
Disruption of Shp in mice alters timing of expression of genes that regulate homocysteine metabolism and the liver responses to ethanol and homocysteine. SHP inhibits the transcriptional activation of Bhmt and Cth by FOXA1.
Keywords: Nuclear receptor, circadian regulation, metabolism, liver disease model
Introduction
Methionine (Met) metabolism involves the sequential formation of S-adenosylmethionine (SAM, the main biological methyl donor), S-adenosylhomocysteine (SAH) and homocysteine (Hcy).1 Hcy is a non-protein, sulfur-containing amino acid that can be remethylated to Met or catabolized through the trans-sulfuration pathway. Met metabolism and transmethylation reactions occur mainly in the liver, which underscores the central role of liver in this metabolic cycle. Betaine-homocysteine S-methyltransferase (BHMT) and cystathionine γ-lyase (CTH) are enzymes responsible for the remethylation and transsulfuration pathways, respectively.2, 3 BHMT converts Hcy to Met with the aid of betaine. Cystathionine, which is produced from Hcy by cystathionine β-synthase, is degraded to cysteine by CTH. Disruptions of Met homeostasis that result in hyperhomocysteinemia (HHcy) increase risk for cardiovascular and cerebrovascular diseases and metabolic disorders.4, 5
The small heterodimer partner (SHP, NR0B2) serves as an important regulator of lipid and bile acid metabolism, and of circadian rhythms in the liver.6, 7 SHP is an orphan member of the nuclear receptor superfamily, but has a distinct structure due to the lack of DNA binding domain.6 In general, SHP binds to a number of transcription factors and nuclear receptors and inhibits their transcriptional activities, for example, as seen in the negative regulation of CYP7A1 gene expression.8
Numerous studies suggest that SHP has pleiotropic roles in the pathology of chronic liver diseases. In lipid metabolism, SHP facilitates hepatic lipid accumulation since liver steatosis in leptin deficient ob/ob mice was abrogated by the deletion of SHP.9 Moreover, SHP modulates the transcriptional activity of lipogenic transcription factors, peroxisome proliferator-activated receptor γ and sterol regulatory element-binding protein-1c.10 On the other hand, Shp−/− mice were more sensitive to bile duct ligation-induced cholestatic liver fibrosis.11, 12 SHP also has anti-oncogenic properties in the liver, via actions on both transcription factors and microRNAs.13–15 Consistently, SHP was significantly downregulated in human hepatocellular carcinoma.16
Despite intensive studies of Hcy metabolism, limited information is available regarding transcriptional control of this important physiological process at the molecular level. Such an understanding would facilitate progress towards new therapeutic approaches to treat HHcy caused by alcoholic liver disease and metabolic dysregulation. In the present study, we demonstrate that nuclear receptor SHP is a new modulator of oscillatory metabolism of homocysteine by suppressing forkhead box A1 (FoxA1)-induced Bhmt and Cth expression. Shp-deficiency results in upregulation of Bhmt and Cth, which in turn facilitates Hcy catabolism, diminishes alcohol-induced HHcy, and prevents Hcy-induced endoplasmic reticulum (ER) stress response and glucose intolerance. Our results establish a new molecular mechanism that controls Hcy homeostasis in the context of circadian regulation.
Materials and Methods
In vivo and in vitro studies
WT, Shp−/−, and Bhmt−/− mice were reported previously. 3, 17 Bhmt−/−Shp−/− mice were generated by intercrossing heterozygous Bhmt+/− with Shp+/− mice and offsprings were used for subsequent experiments. The mice were maintained in a 12h/12h light/dark (LD) cycle (light on 6 AM to 6 PM) with free access to food and water. Experiments were performed using male mice at the age of 8 to 12 weeks (n=5/group unless otherwise indicated). Serum and liver tissues were harvested at Zeitgeber time ZT2, ZT6, ZT10, ZT14, ZT18, and ZT22 (the time of lights on defines Zeitgeber time zero: ZT0). A dim red light at intensity of 1 μmol/m2s was used to collect tissues in dark condition. For alcohol-induced HHcy, the NIAAA binge model18 was used with slight modification. In brief, after acclimatization of control liquid diet for 5 days, the mice were given control liquid diet (Bio-Serv, product #F1259SP) or 5% Lieber-DeCarli ethanol liquid diet (Bio-Serv, product #F1258SP) for 10 days, followed by oral gavage of a single dose of maltose (CTRL, 9g maltose dextrin/kg of body weight) or ethanol (EtOH, 5g ethanol/kg of body weight) solutions at 9 am on day 10. Nine hours after the binge, blood samples and liver tissues were collected every 6h over a 24h LD cycle at ZT12, ZT18, ZT0 and ZT6. For the induction of HHcy with Hcy water, the mice were fed a normal pellet diet, but supplied with drinking water containing 0.18% of DL-Hcy (TCI America, Portland, OR) for four weeks.19 Cholic acid (1%), cholestyramine (2%) or high-fat diet (60%) feeding were performed as described previously.14, 20 Glucose tolerance test was performed at 10 am by oral administration of glucose solution (2 mg/g body wt) to mice fasted for 16h.21 Blood glucose levels were measured by a blood glucose meter (Germaine Laboratories, San Antonio, TX). Protocols for the animal studies were approved by the Institutional Animal Care and Use Committee at the University of Utah. Standard methods were used for Western blotting, qPCR, luciferase reporter assays, mutagenesis, and ChIP assays. Bhmt and Cth activity were assessed as described previously. 3, 22 Detailed methods are included in the Supplementary Information.
Metabolomics analysis
GC-MS analysis was performed with a Waters GCT Premier mass spectrometer fitted with an Agilent 6890 gas chromatograph and a Gerstel MPS2 autosampler. Metabolite identity was established using a combination of an in house metabolite library developed using pure purchased standards and the commercially available NIST library. The data was normalized by mean centering to the internal standard d4-succinate.
Statistical analysis
All statistical comparisons were made using Student’s t-test, and P values less than 0.05 were considered to be statistically significant. All data are shown as mean ± standard error of mean (SEM) from independent experiments.
Results and Discussion
Shp-deficiency had a global impact on homocysteine metabolism
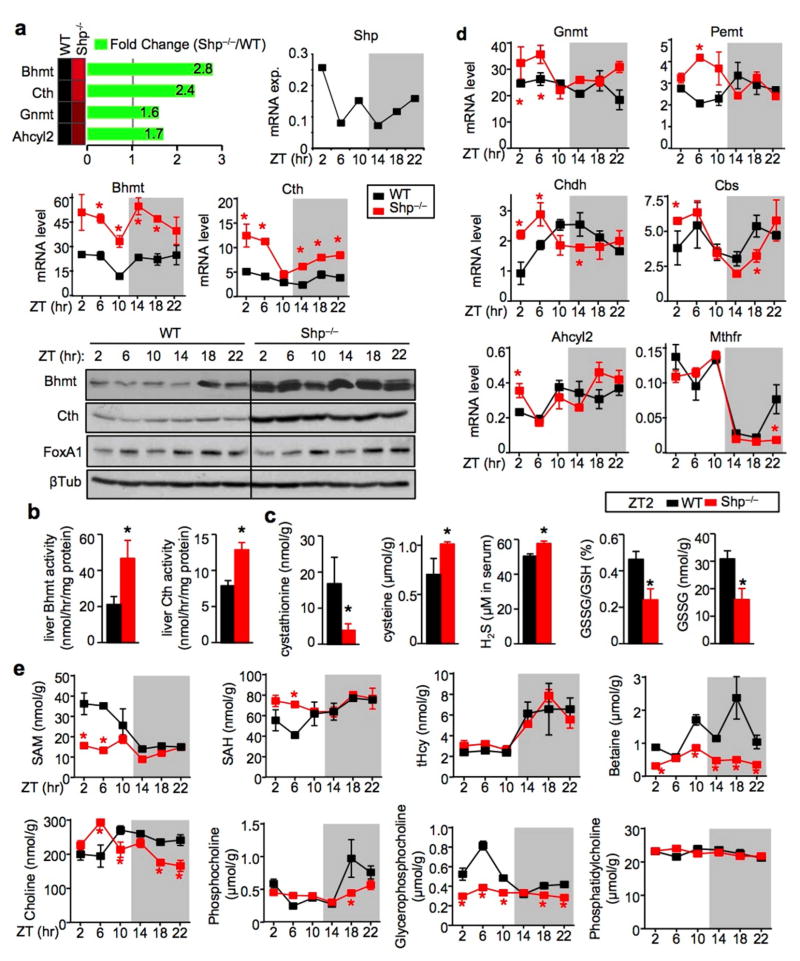
In addition to the established role of SHP in bile acid17, 23 and lipid metabolism,9, 21 new gene signatures implicated in liver fibrosis and cirrhosis in humans were identified by RNA-sequencing (RNA-seq) in the Shp−/− mice.24 Of particular interest, the expression of Hcy metabolism genes, including Bhmt and Cth, was highly upregulated in Shp−/− mice (Fig. 1a, top left), indicating a role of SHP in the transcriptional control of Hcy metabolism. SHP was recently shown to be part of the liver circadian clock network7, 25 and Shp mRNA exhibits a circadian expression pattern (top right). This prompted us to examine the rhythmic expression of hepatic Bhmt and Cth mRNA and protein over a 24h light/dark (LD) (12h/12h) cycle. As expected, the mRNA (Fig. 1a, middle) and protein (Fig. 1a, bottom) expression of Bhmt and Cth were both highly induced in Shp−/− liver compared with WT liver. The expression of both genes did not show strong rhythmicity in WT mice, however it became more evident in Shp−/− liver, particularly at the mRNA levels. In contrast, FoxA1 expression was not markedly altered by Shp-deficiency.
Figure 1. Shp-deficiency disrupts the oscillatory homocysteine metabolic program.
a, Top: RNA-seq revealed upregulation of Hcy metabolic genes in the liver of Shp−/− mice relative to wild-type (WT) mice. Middle: qPCR of hepatic Bhmt and Cth mRNA in Shp−/− (red) and WT (black) mice collected over a 12h/12h light/dark cycle. Data are shown in mean ± SEM. Each time point represents a pooled sample (equal amount of RNA) from 5 individual mice with triplicate assays. *P < 0.01, Shp−/− vs WT at each time point. ZT, Zeitgeber time. Hprt1, internal control. Bottom: Western blot (WB) of hepatic Bhmt, Cth and FoxA1 protein expression in Shp−/− and WT mice collected over a 12h/12h light/dark cycle. β-Tublin (βTub), loading control. Each band represents a pooled sample (equal amount of protein) from 5 individual mice.
b–c, Enzymatic activities of Bhmt and Cth (b) and LC/MS analysis of liver metabolites and serum H2S production as well as HPLC analysis of liver GSH and GSSG (c) in WT (black) and Shp−/− (red) mice at ZT2. Data are shown in mean ± SEM (n=5 mice/group with triplicate assays). *P < 0.01, Shp−/− vs WT.
d, qPCR analysis of the expression of additional genes in the Hcy metabolic pathway. Data are shown in mean ± SEM. *P < 0.01, Shp−/− vs WT. The same condition as in (1a) middle.
e, LC/MS analysis of liver metabolites in WT (black) and Shp−/− (red) mice. Data are shown in mean ± SEM (n=5 mice/group with triplicate assays). *P < 0.01, Shp−/− vs WT.
In addition, the enzymatic activities of Bhmt and Cth were significantly higher in Shp−/− liver than in WT mice at ZT2 (Fig. 1b). Cystathionine, the CTH substrate in the transsulfuration pathway, was significantly decreased in the liver of Shp−/− mice, whereas its products cysteine and hydrogen sulfide were increased, 2, 4 the latter provides a reductive atmosphere in cells, in part, by preserving reduced glutathione levels (Fig. 1c).26 Moreover, glutathione consists of glutamine and glycine, as well as cysteine, all of which are endo-products in the CTH reactions. Considering these changes, it is not surprising that the oxidized glutathione was decreased in the liver of Shp−/− mice.
To better understand the overall impact of Shp-deficiency on Hcy metabolism, additional genes were analyzed. Most genes showed strong (Mthfr, Cbs, Chdh) to modest (Pemt, Ahcyl2) circadian rhythm in expression (Fig. 1d). In contrast to the over-induction of Bhmt and Cth in Shp−/− mice, the rhythmicity of Mthfr and Ahcyl2 remained similar in WT and Shp−/− mice. The expression of Cbs and Chdh showed a shift in circadian phase; expression was increased during the light cycle but decreased during the dark cycle in Shp−/− vs. WT mice. Gnmt and Pemt, on the other hand, exhibited increased expression in Shp−/− mice only during the light cycle. Based on these observations, it is presumed that the upregulation of Bhmt and Cth in Shp−/− mice is a direct consequence of the loss of Shp inhibition, whereas changes in other genes are likely secondary phenomenon driven by changes of intermediate metabolites.
In the liver, betaine, a methyl donor in BHMT-dependent Hcy remethylation pathway (Supplementary Fig. 1),3 was significantly decreased in Shp−/− mice, although total Hcy (tHcy) was not altered (Fig. 1e and Supplementary Fig. 2a). This may reflect adaptions in the Met cycle that compensated for the increased SAM-dependent methylation. Indeed, decreased SAM and increased SAH concentrations were observed in Shp−/− mice during the light cycle. The rhythmic levels of choline resembled the expression pattern of Chdh. Phosphatidylcholine, a main component of cellular membranes and very low density lipoprotein (VLDL), is produced from choline via phosphocholine as an intermediate and is degraded to glycerophosphocholine by phospholipases. Interestingly, distinct changes in patterns were observed for these metabolites. Overall, most of the metabolites showed strong rhythmicity in WT mice and their oscillations were noticeably altered in Shp−/− liver.
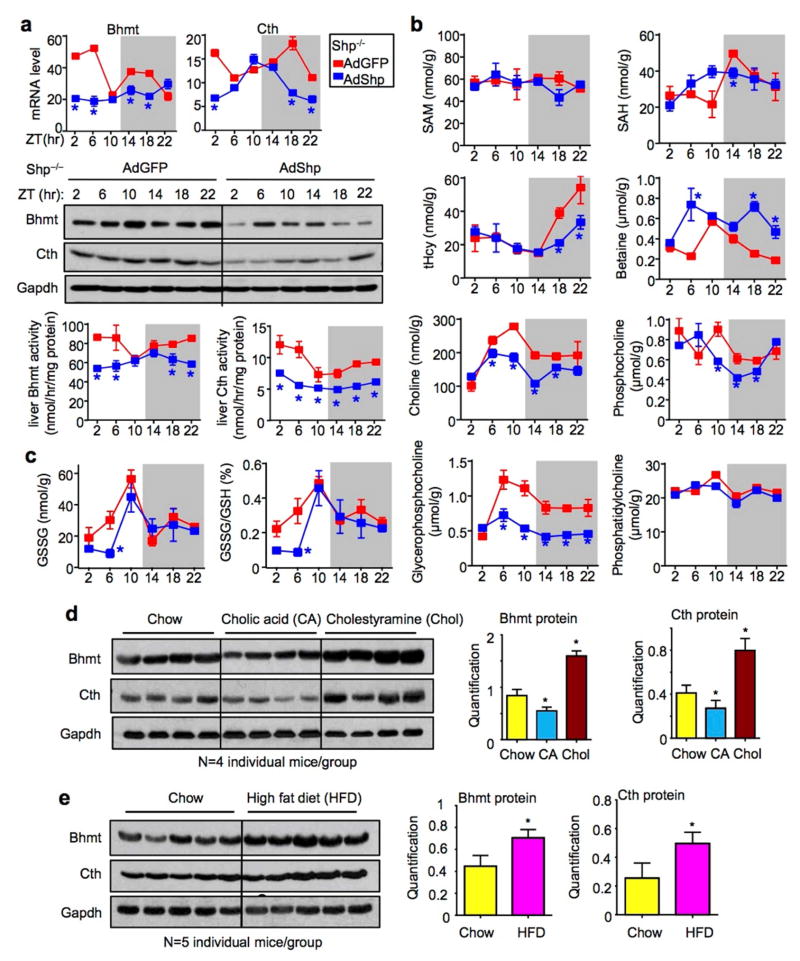
To further determine a direct regulation of Bhmt and Cth by SHP, we re-expressed Shp in Shp−/− liver using adenovirus mediated gene delivery.25 Hepatic Bhmt and Cth mRNA and protein expression, as well enzymatic activity, were largely suppressed by Shp re-expression in AdShp mice compared with AdGFP mice (Fig. 2a), demonstrating a direct inhibition of both genes by Shp in vivo.
Figure 2. Shp re-expression partially rescues oscillatory one-carbon metabolism.
a, qPCR for mRNA (top), WB for protein (middle) and enzymatic activities (bottom) of hepatic Bhmt and Cth in Shp−/− mice that were re-expressed with GFP (red) or Shp-adenovirus (blue). *P < 0.01, AdShp vs AdGFP. Each ZT time point represents pooled samples from 5 individual mice.
b–c, LC/MS analysis of liver metabolites (b) and HPLC analysis of liver GSH and GSSG (c) in AdGFP and AdShp Shp−/− mice. Data are shown in mean ± SEM (n=5 mice/group with triplicate assays). *P < 0.01, AdShp vs AdGFP.
d–e, Western blot (left) and quantitative analysis (right) of hepatic Bhmt and Cth protein in WT mice fed with 1% cholic acid and 2% cholestyramine (d) or 60% high-fat diet (e). Each line represents one single mouse sample in the indicated genotype group.
To gain more insights into the alterations of oscillatory metabolites regulated by SHP in Hcy metabolic pathway, we analyzed hepatic one-carbon metabolites in AdShp Shp−/− vs. AdGFP Shp−/− mice. In agreement with the suppressed Bhmt activity, betaine accumulated in AdShp Shp−/− mice (Fig. 2b and Supplementary Fig. 2b). However, the peak levels of tHcy at ZT18 and ZT22 during the dark cycle was decreased in AdShp Shp−/− mice whereas SAM and SAH showed no or only moderate changes. In addition, the oscillatory levels of choline, phosphocholine, glycerophosphocholine and oxidized glutathione were not reversed by Shp re-expression in AdShp Shp−/− mice as compared to AdGFP Shp−/− mice. The results suggest that a temporal re-expression of SHP mainly in hepatocytes could not fully rescue the metabolic changes caused by deletion of Shp in the entire liver that is composed of both non-parenchymal and parenchymal cells.
To link Shp-mediated regulation of Bhmt and Cth expression under a physiological condition, WT mice were fed 1% cholic acid (CA) diet which is known to induce the endogenous Shp expression or 2% cholestyramine (Chol) diet to interrupt the enterohepatic circulation of bile acids. 17, 20 As expected, Bhmt and Cth proteins were decreased by CA feeding but increased by Chol feeding (Fig. 2d). The effect of cholestyramine was more striking, consistent with its efficacy to block BA reabsorption. In addition, a high-fat diet feeding induced Cth and Bhmt expression (Fig. 2e), the latter was also observed by another group. 27 The induction could be a compensatory response to the fat load in the liver, as Bhmt−/− mice developed fatty liver. 3 We further examined the effects of fasting and refeeding, but did not observe major changes in Bhmt and Cth expression under these conditions (Supplementary Fig. 3). Therefore, it is postulated that the expression of Bhmt and Cth is primarily regulated by Shp rather than by the liver clock machinery. Their enhanced rhythmicity in Shp−/− mice may represent a consequence resulting from the role of SHP in modulating the circadian clock genes. 25
The expression of Bhmt and Cth was controlled by SHP and FoxA1 crosstalk
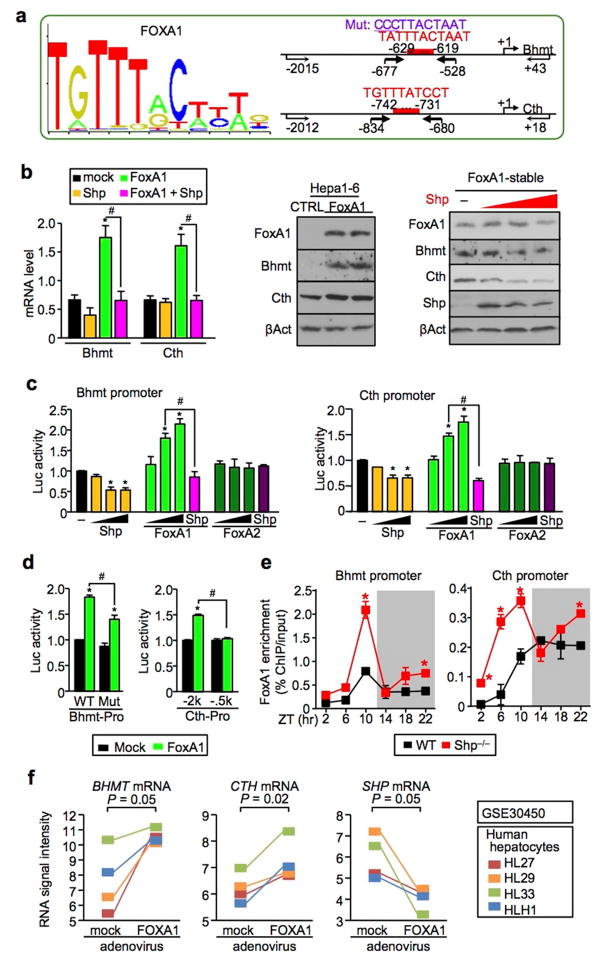
SHP is a unique member of the nuclear receptor superfamily in that it exerts its repressive function by suppressing the transactivation of other transcription factors (TFs).6 To elucidate the molecular basis by which SHP inhibits Bhmt and Cth expression, we predicted TF response elements and identified conserved binding sites for FoxA1 in the mouse Bhmt and Cth promoters (Fig. 3a and Supplementary Fig. 4a). FoxA1 markedly induced Bhmt and Cth mRNA (Fig. 3b, left) and protein (right) expression in mouse Hepa1-6 cells, which was suppressed by Shp co-expression (right). Luciferase reporter assays demonstrated that FoxA1, but not FoxA2, activated Bhmt (Fig. 3c, left) as well as Cth (right) promoter, and FoxA1 activation was completely blocked by Shp co-transfection. This is likely mediated by a physical interaction between SHP and FOXA1 proteins.28 In addition, mutation of the binding site in Bhmt promoter attenuated FoxA1 activity (Fig. 3d, left), suggesting that the predicted site is at least in part responsible for FoxA1 activation of Bhmt. In a similar fashion, deletion of a putative binding site within −742bp ~ −731bp relative to the transcriptional start site prevented FoxA1 from activating the Cth promoter (right), suggesting that this is a functional site for FoxA1. Importantly, the recruitment of FoxA1 to the Bhmt and Cth promoters in vivo was rhythmic and overly augmented in Shp−/− liver (Fig. 3e), and this resembled, to a large extent, the circadian expression pattern of Bhmt and Cth (Fig. 1a). FoxA1 was shown to serve as a pioneer factor to recruit other TFs in the promoter and enable rapid response of chromosome to subsequent stimuli.29, 30 The slight differences between the pattern of FoxA1 binding and Bhmt/Cth expression could be attributed to a combinational effect of FoxA1 and additional TFs recruited to the Bhmt and Cth promoters. Nonetheless, it is evident that SHP functions as a transcriptional repressor of Bhmt and Cth expression through inhibiting FoxA1 transactivity, but not FoxA1 gene expression (Supplementary Fig. 4b–4c). Interestingly, Moya et al. reported that FOXA1 is involved in lipid metabolism in human liver.31 Based on their gene expression database (GSE30450), overexpression of FOXA1 in primary human hepatocytes correlated with the induction of BHMT (p = 0.05) and CTH (p = 0.02) but the reduction of SHP (Fig. 3f), suggesting a direct regulation. Taken together, our results identified a crosstalk between FoxA1 and SHP to control Bhmt and Cth expression.
Figure 3. FoxA1 and Shp crosstalk is critical to control Bhmt and Cth expression.
a, (right) Sequence logo of FoxA1-binding site (MA0148.1; http://jaspar.genereg.net). (left) FoxA1-binding sites (red) in the mouse Bhmt (upper) and Cth (lower) promoters. Arrows indicate primers location for the construction of Bhmt and Cth promoter luciferase reporters. Bold arrows indicate primers location for ChIP assay (f). Mut, mutation.
b, (right) qPCR of Bhmt and Cth mRNA in Hepa1-6 cells transiently overexpressed FoxA1 and/or Shp. Data are shown in mean ± SEM (n = 4). *P < 0.01, FoxA1 vs mock; #P < 0.01, FoxA1+Shp vs FoxA1. (middle) Western blot of FoxA1, Bhmt and Cth protein expression in two independently established FoxA1-stable Hepa1-6 cells. CTRL, control. β-Actin (βAct), loading control. (left) Western blot of FoxA1, Bhmt, Cth and Shp protein expression in FoxA1-stable cells transfected with 0, 1.0, 1.5, and 2.0 μg of Shp expression plasmid (red). βAct, loading control.
c, Luciferase reporter assays. Wild-type Bhmt (right) and Cth (left) promoter reporters were transfected with expression plasmids of Shp, FoxA1, and FoxA2 alone (50, 150, and 250 ng) or in combination (150 ng). Data are shown in mean ± SEM (n = 4). *P < 0.01 vs mock; #P < 0.01 vs FoxA1.
d, Mutant Bhmt (right) and Cth (left) promoter reporters were transfected with expression plasmids of FoxA1 (150 ng). Data are shown in mean ± SEM (n = 4). *P < 0.01 vs mock; #P < 0.01 vs FoxA1.
e. ChIP assays showing rhythmic binding of FoxA1 to the Bhmt (right) and Cth (left) promoters in WT (black) and Shp−/− (red) liver. Data are shown in mean ± SEM from triplicate assays. The samples are the same as in Fig. 1a. *P < 0.01, Shp−/− vs WT. ZT, Zeitgeber time.
f, Relative BHMT (right), CTH (middle), and SHP (right) mRNA in human primary hepatocytes transduced with FOXA1-adenovirus. The data was retrieved from the gene expression omnibus database (GSE30540). The P values were calculated from the paired Student’s t-test.
Alcohol-induced hyperhomocysteinemia was prevented by Shp-deficiency
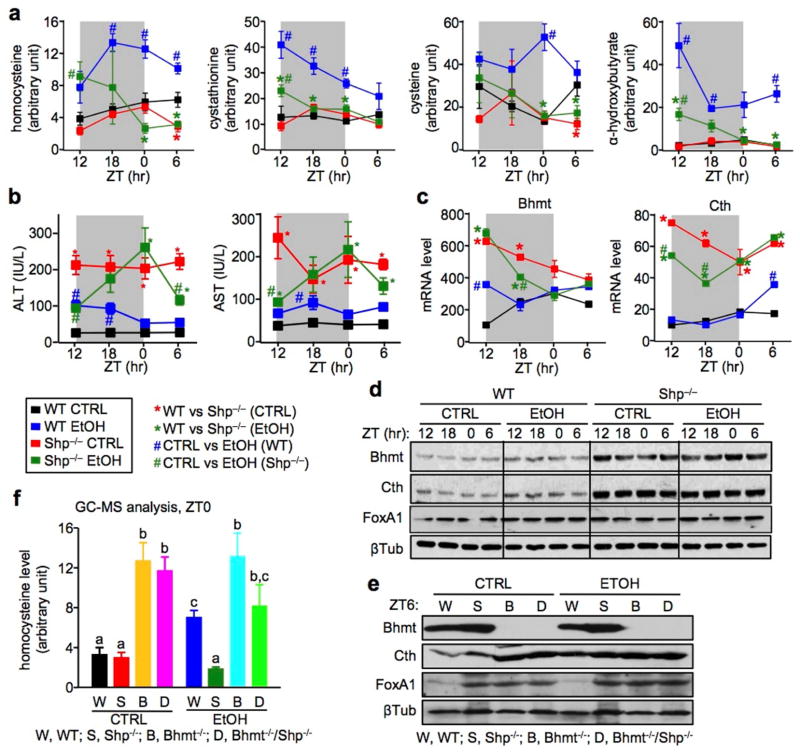
Chronic alcohol consumption is a major public health problem that can lead to the development of liver steatosis, fibrosis, and eventually cirrhosis and hepatocellular carcinoma.32 HHcy is a pathological consequence of alcoholic liver disease.33 We adopted a simple chronic and binge ethanol (EtOH) feeding model18 in WT and Shp−/− mice to better understand the effect of SHP on alcohol-induced HHcy. We collected samples over a 24h LD cycle in order to assess the oscillatory profile of metabolites (Supplementary Fig. 5a). Diet consumption as well as changes in body weight appeared compatible between WT and Shp−/− mice (Supplementary Fig. 5b–5c). Metabolomic (GC/MS) analysis of mouse serum revealed that the WT EtOH mice (blue) developed HHcy which lasted over the entire LD cycle, whereas Shp−/− EtOH mice (dark green) were protected against HHcy (Fig. 4a). Metabolites in the transsulfuration pathway, including cystathionine, cysteine, and α-hydroxybutylate, were all significantly increased in WT EtOH mice. Interestingly, serum methionine levels remained unaltered among the groups (data not shown), which was similar to that observed in Bhmt−/− mice that spontaneously developed HHcy.3 It was also noted that the levels of those metabolites did not change in WT and Shp−/− mice fed with the control liquid/maltose binge diet (CTRL). Although it is commonly used in the alcohol research field, the CTRL diet consists of monosaccharides and disaccharides (different forms of sugar, such as glucose, maltose) that are not present in the chow diet for the purpose of balancing calorie intake from the ethanol diet. We reason that such CTRL diet may affect to some extent the gene expression and phenotypic profile as compared to the regular chow diet. Consistent with Bertola,18 serum alanine aminotransferase (ALT) levels were transiently increased in WT EtOH mice 9h after binge (ZT12) (Fig. 4b), and decreased to the basal levels 24h later. To our surprise, both ALT and aspartate transaminase (AST) levels were constantly high over the entire light/dark cycle in Shp−/− CTRL vs WT CTRL mice, and the pattern was noticeably altered by ethanol-binge. Alcohol-binge caused minimal changes in hepatic Bhmt and Cth mRNA (Fig. 4c) and protein (Fig. 4d and Supplementary Fig. 5d) in WT mice, despite having a striking effect on Hcy catabolism. On the other hand, Bhmt and Cth mRNA and protein, but not FoxA1 protein, remained elevated in Shp−/− CTRL liver vs WT CTRL liver.
Figure 4. Shp−/− mice are resistant to alcohol-induced hyperhomocysteinemia.
a, GC/MS analysis of Hcy metabolites. Sera were collected from WT CTRL (black), WT EtOH (blue), Shp−/− CTRL (red), and Shp−/− EtOH (dark green) mice over a 12h/12h light/dark cycle using the NIAAA-binge model. Five individual mice were analyzed in each group. Data are shown in mean ± SEM (n=5). *P < 0.01, Shp−/− vs WT; #P < 0.01, EtOH vs CTRL. ZT, Zeitgeber time.
b, Serum ALT and AST levels in WT CTRL (black), WT EtOH (blue), Shp−/− CTRL (red), and Shp−/− EtOH (dark green) mice over a 12h/12h light/dark cycle using the NIAAA-binge model. *P < 0.01, Shp−/− vs WT; #P < 0.01, EtOH vs CTRL. ZT, Zeitgeber time.
c, qPCR of hepatic Bhmt and Cth mRNA in WT CTRL (black), WT EtOH (blue), Shp−/− CTRL (red), and Shp−/− EtOH (dark green) mice over a 12h/12h light/dark cycle using the NIAAA-binge model. *P < 0.01, Shp−/− vs WT; #P < 0.01, EtOH vs CTRL. ZT, Zeitgeber time.
d, Western blot of hepatic Bhmt, Cth, and FoxA1 protein expression in WT CTRL, WT EtOH, Shp−/− CTRL, and Shp−/− EtOH mice over a 12h/12h light/dark cycle using the NIAAA-binge model. β-Tublin (βTub), loading control.
e, Western blot of hepatic Bhmt, Cth, and FoxA1 protein expression at ZT0 in WT (W), Shp−/− (S), Bhmt−/− (B), and Bhmt−/−Shp−/− (D) mice using the NIAAA-binge model. β-Tublin (βTub), loading control.
f, GC/MS analysis of serum homocysteine levels at ZT0 in WT (W), Shp−/− (S), Bhmt−/− (B), and Bhmt−/−Shp−/− (D) mice using the NIAAA-binge model. Data are shown in mean ± SEM (n =5). Different characters indicate significant differences (P < 0.05).
To assess the contribution of Bhmt in Hcy degradation in Shp−/− mice, we generated Bhmt−/−Shp−/− double knockouts by intercrossing Bhmt+/− with Shp+/− mice, and then subjected mice to EtOH/binge treatment. Liver Bhmt protein was undetectable in Bhmt−/− and Bhmt−/−Shp−/− mice (Fig. 4e), confirming its deficiency. A striking observation was the increased hepatic Cth protein in Bhmt−/− and Bhmt−/−Shp−/− CTRL mice, which may represent a compensatory mechanism prompted by Bhmt-deficiency. FoxA1 protein was increased to a similar extent in Shp−/−, Bhmt−/− and Bhmt−/−Shp−/− mice, suggesting both Shp- and Bhmt-dependent expression regulation. Consistent with our earlier report,3 Bhmt−/− CTRL mice developed HHcy (gold vs black), which was not further elevated by alcohol/binge (cyan vs gold) (Fig. 4f). In agreement with the results in Fig. 4a, Shp-deficiency did not alter Hcy levels on a normal diet (red vs black), but markedly diminished alcohol-induced HHcy (dark green vs blue). Although Shp-deficiency in Bhmt−/−Shp−/− mice did not improve HHcy in Bhmt−/− CTRL group (magenta vs gold), it partially rescued it in the EtOH group (green vs cyan). This effect is in part through Bhmt- and Cth-mediated regulation. The results suggest that diminished Shp function is more effective in preventing HHcy induced by stress (alcohol).
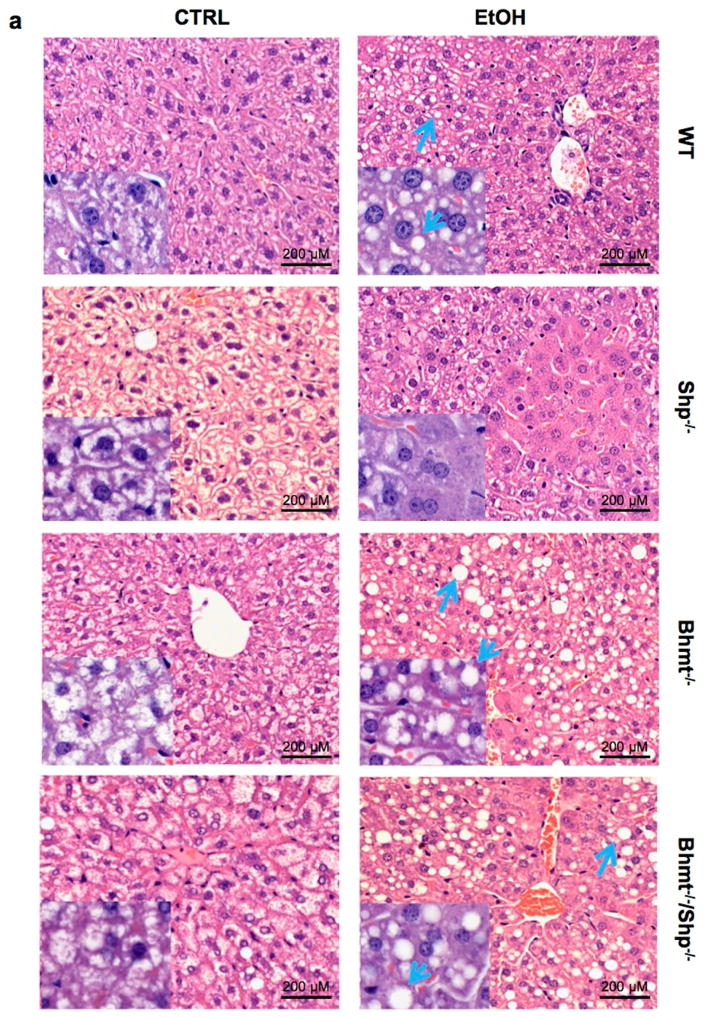
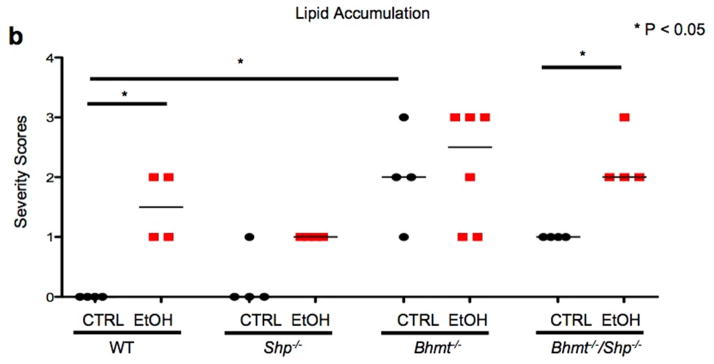
We conducted H&E staining to detect histomorphologic changes in the livers. CTRL diet resulted in lipid accumulation in Bhmt−/− and Bhmt−/−Shp−/− mice compared with WT mice (Fig. 5a–5b, Supplementary Fig. 6a–6d). Following ethanol-binge, macrovesicular fatty changes were observed in the livers of WT (mild), Bhmt−/− (moderate) and Bhmt−/−Shp−/− (moderate) mice. Lipid accumulation was characterized by variably-sized, clear vacuoles that displaced the nucleus to the cell margin (blue arrow). Minimal hepatocellular necrosis was observed in Shp−/− mice on CTRL or ethanol-binge diet that likely contributed to the elevation of ALT and AST (Fig. 4b). The increased microvesicular fat in Shp−/− CTRL mice was in contrast to early findings that Shp-deficiency decreased liver TG under chow or a high-fat diet. 9, 21, 23 The results suggest that these fatty changes are likely independent of changes in Hcy metabolites. Contrary to Shp−/− mice in which Bhmt is highly induced, in Bhmt−/−Shp−/− mice there can be no such induction of Bhmt; this may explain why Shp-deficiency does not prevent alcohol-induced macrovesicular fatty liver in Bhmt−/− mice.
Figure 5. Alcohol stimulates lipid accumulation to a greater extent in Bhmt−/− mice than Shp−/− mice.
a, H&E staining of liver sections from WT, Shp−/−, Bhmt−/−, and Bhmt−/−Shp−/− mice fed with etanol-binge (EtOH) or pair-fed with control liquid/maltose binge (CTRL) diet following the NIAAA-binge model (n=6–8). Macrovesicular lipid accumulation is characterized by round, clear droplet(s) within liver cells (blue arrows). Magnification: 10X. Insert: 40X.
b, Lipid accumulation (macrovesicular) was assessed using the following grading scale: 0, none; 1, minimal; 2, mild; 3, moderate; 4, marked; 5, severe. Data are presented as raw scores and medians. Scores were rank-ordered prior to one-way analysis of variance and a Newman-Keuls posthoc test (GraphPad Prism 6.0).
Hcy-induced glucose intolerance was abrogated by Shp-deficiency
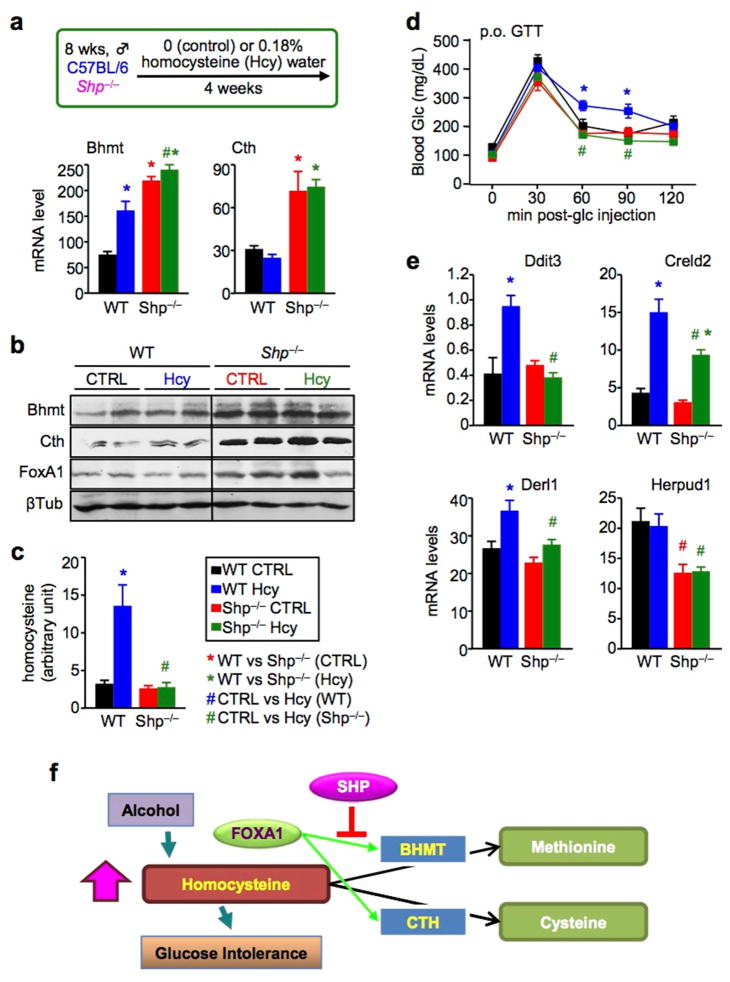
Excessive alcohol consumption damages liver function in both an Hcy-dependent and -independent manner.34 To further understand the role of SHP in Hcy homeostasis, we used a model of chronic HHcy,19 i.e. by supplying WT and Shp−/− mice with drinking water containing 0.18% of DL-Hcy for four weeks (Fig. 6a). Bhmt mRNA and protein (Fig. 6b) were induced by Hcy-feeding in WT mice. The expression of Bhmt, Cth and FoxA1 was elevated in Shp−/− liver, regardless of Hcy-feeding. Hcy-feeding stimulated HHcy (Fig. 6c) and glucose intolerance19 (Fig. 6d) in WT mice (blue vs black), which was prevented in Shp−/− mice (dark green vs blue). Hcy is an inducer of ER stress in the liver.35 The expression of ER stress target genes, including DNA-damage inducible transcript 3 (Ddit3), cysteine-rich with EGF-like domains 2 (Creld2), Der1-like domain family, member 1 (Derl1), and Hcy-inducible, endoplasmic reticulum stress-inducible, ubiquitin-like domain member 1 (Herpud1), were upregulated in WT Hcy compared to the Shp−/− groups (Fig. 6e). Therefore, Shp-deficiency appears to confer resistance to Hcy-induced glucose intolerance, which is associated with the increased Bhmt and Cth expression. This study suggests a new underlying mechanism that explains the improved insulin sensitivity in Shp−/− mice.9, 21
Figure 6. Homocysteine-induced glucose intolerance is diminished in Shp−/− mice.
a, (upper) Mouse model of chronic HHcy. WT and Shp−/− mice fed with a chow diet were supplied with drinking water containing 0.18% of DL-Hcy for four weeks. (lower) qPCR of hepatic Bhmt and Cth mRNA in WT CTRL (black), WT Hcy (blue), Shp−/− CTRL (red), and Shp−/− Hcy (dark green) mice. Data are shown in mean ± SEM (n = 5). *P < 0.01 vs WT CTRL; #P < 0.01, Shp−/− Hcy vs WT Hcy.
b, Western blot of hepatic Bhmt, Cth, and FoxA1 protein expression in WT CTRL, WT Hcy, Shp−/− CTRL and Shp−/− Hcy mice. β-Tublin (βTub), loading control.
c, Serum Hcy levels in WT CTRL (black), WT Hcy (blue), Shp−/− CTRL (red), and Shp−/− Hcy (dark green) mice. Data are shown in mean ± SEM (n = 5). *P < 0.01 vs WT CTRL; #P < 0.01, Shp−/− Hcy vs WT Hcy.
d, Oral glucose tolerance test in WT CTRL (black), WT Hcy (blue), Shp−/− CTRL (red), and Shp−/− Hcy (dark green) mice. Data are shown in mean ± SEM (n = 5). *P < 0.01 WT Hcy vs WT CTRL; #P < 0.01, Shp−/− Hcy vs WT Hcy.
e, qPCR of mRNA for ER-stress target genes in the liver of WT CTRL (black), WT Hcy (blue), Shp−/− CTRL (red), and Shp−/− Hcy (dark green) mice. Data are shown in mean ± SEM (n = 5). *P < 0.01 vs WT CTRL; #P < 0.01, Shp−/− Hcy vs WT Hcy.
f, Schematics of findings in the present study. SHP is a new modulator of Hcy metabolism by suppressing FoxA1-induced Bhmt and Cth expression. Shp-deficiency results in upregulation of Bhmt and Cth, which in turn facilitates Hcy catabolism, diminishes alcohol-induced HHcy, and prevents HHcy-induced glucose intolerance.
Conclusion
In summary, we identified SHP and FOXA1 as new components in hepatic Hcy metabolism by reciprocally regulating BHMT and CTH expression (Fig. 6f). Intriguingly, Shp-deficiency protects against alcohol- and Hcy-induced HHcy. Further studies are necessary to explore the role of SHP as well as FOXA1 in human disease conditions associated with HHcy. Although folate and vitamin B12 supplementation are used to lower Hcy levels, such treatment can potentially cause harmful effects, especially in patients with HHcy.36, 37 In light of our findings, therapeutic approaches to modulate SHP activity could be envisioned for the treatment of HHcy caused by Hcy metabolic dysregulation.
Supplementary Material
Acknowledgments
Grant Support: L.W. is supported by NIH DK080440, American Heart Association 13GRNT14700043, VA Merit Award 1I01BX002634, DK104656, 5 P30 DK020579 by the DRC at Washington University, and P30 CA042014 from Huntsman Cancer Institute. H.T. is supported by Manpei Suzuki Diabetes Foundation and Mochida Memorial Foundation for Medical and Pharmaceutical Research. S.L. is supported by AHA Postdoctoral fellowship 13POST14630070. R.S. is supported by AHA Predoctoral fellowship 14PRE17930013. Y.Z. is supported by NCI K22 Transition Career Development Award K22CA184146. S.H.Z. and S.J.O. are supported by NIH DK056350.
We thank the Metabolomics Core at the University of Utah for GC/MS analysis and Microarray and Genomic Analysis Core for RNA-seq analysis.
Abbreviations
- AHCYL2
adenosylhomocysteinase-like 2
- BHMT
Betaine-homocysteine S-methyltransferase
- CBS
cystathionine β-synthase
- CHDH
choline dehydrogenase
- CTH
cystathionine γ-lyase
- CTRL
control
- ER
endoplasmic reticulum
- EtOH
ethanol
- FOXA1
forkhead box A1
- GNMT
glycine N-methyltransferase
- Hcy
homocysteine
- HHcy
Hyperhomocysteinemia
- LD
light/dark
- MTHFR
methylenetetrahydrofolate reductase
- PEMT
phosphatidylethanolamine N-methyltransferase
- SAM
S-adenosylmethionine
- SAH
S-adenosylhomocysteine
- SHP
small heterodimer partner
- TF
transcription factor
- WT
wild-type
- ZT
Zeitgeber time
Footnotes
Disclosures: The authors declare no competing financial and personal interests.
Author contributions: H.T. performed experiments and wrote the manuscript. K.D., S.L., B.R., S.H.O., Z.Y., M.L., M.G., H.J., Y.Z., K.B., S.R., R.S., G.G., S.F., and S.H.Z. performed experiments. L.W. conceived and supervised the study, and wrote the manuscript.
Author names in bold designate shared co-first authorship.
Publisher's Disclaimer: This is a PDF file of an unedited manuscript that has been accepted for publication. As a service to our customers we are providing this early version of the manuscript. The manuscript will undergo copyediting, typesetting, and review of the resulting proof before it is published in its final citable form. Please note that during the production process errors may be discovered which could affect the content, and all legal disclaimers that apply to the journal pertain.
References
- 1.Avila MA, Berasain C, Prieto J, et al. Influence of impaired liver methionine metabolism on the development of vascular disease and inflammation. Curr Med Chem Cardiovasc Hematol Agents. 2005;3:267–81. doi: 10.2174/1568016054368197. [DOI] [PubMed] [Google Scholar]
- 2.Shirozu K, Tokuda K, Marutani E, et al. Cystathionine gamma-lyase deficiency protects mice from galactosamine/lipopolysaccharide-induced acute liver failure. Antioxid Redox Signal. 2014;20:204–16. doi: 10.1089/ars.2013.5354. [DOI] [PMC free article] [PubMed] [Google Scholar]
- 3.Teng YW, Mehedint MG, Garrow TA, et al. Deletion of betaine-homocysteine S-methyltransferase in mice perturbs choline and 1-carbon metabolism, resulting in fatty liver and hepatocellular carcinomas. J Biol Chem. 2011;286:36258–67. doi: 10.1074/jbc.M111.265348. [DOI] [PMC free article] [PubMed] [Google Scholar]
- 4.Tehlivets O. Homocysteine as a risk factor for atherosclerosis: is its conversion to s-adenosyl-L-homocysteine the key to deregulated lipid metabolism? J Lipids. 2011;2011:702853. doi: 10.1155/2011/702853. [DOI] [PMC free article] [PubMed] [Google Scholar]
- 5.Schalinske KL, Smazal AL. Homocysteine imbalance: a pathological metabolic marker. Adv Nutr. 2012;3:755–62. doi: 10.3945/an.112.002758. [DOI] [PMC free article] [PubMed] [Google Scholar]
- 6.Zhang Y, Hagedorn CH, Wang L. Role of nuclear receptor SHP in metabolism and cancer. Biochim Biophys Acta. 2011;1812:893–908. doi: 10.1016/j.bbadis.2010.10.006. [DOI] [PMC free article] [PubMed] [Google Scholar]
- 7.Pan X, Zhang Y, Wang L, et al. Diurnal regulation of MTP and plasma triglyceride by CLOCK is mediated by SHP. Cell Metab. 2010;12:174–86. doi: 10.1016/j.cmet.2010.05.014. [DOI] [PMC free article] [PubMed] [Google Scholar]
- 8.Goodwin B, Jones SA, Price RR, et al. A regulatory cascade of the nuclear receptors FXR, SHP-1, and LRH-1 represses bile acid biosynthesis. Mol Cell. 2000;6:517–26. doi: 10.1016/s1097-2765(00)00051-4. [DOI] [PubMed] [Google Scholar]
- 9.Huang J, Iqbal J, Saha PK, et al. Molecular characterization of the role of orphan receptor small heterodimer partner in development of fatty liver. Hepatology. 2007;46:147–57. doi: 10.1002/hep.21632. [DOI] [PubMed] [Google Scholar]
- 10.Boulias K, Katrakili N, Bamberg K, et al. Regulation of hepatic metabolic pathways by the orphan nuclear receptor SHP. EMBO J. 2005;24:2624–33. doi: 10.1038/sj.emboj.7600728. [DOI] [PMC free article] [PubMed] [Google Scholar]
- 11.Park YJ, Qatanani M, Chua SS, et al. Loss of orphan receptor small heterodimer partner sensitizes mice to liver injury from obstructive cholestasis. Hepatology. 2008;47:1578–86. doi: 10.1002/hep.22196. [DOI] [PubMed] [Google Scholar]
- 12.Zhang Y, Xu N, Xu J, et al. E2F1 is a novel fibrogenic gene that regulates cholestatic liver fibrosis through the Egr-1/SHP/EID1 network. Hepatology. 2014 doi: 10.1002/hep.27121. [DOI] [PMC free article] [PubMed] [Google Scholar]
- 13.Song G, Wang L. Nuclear receptor SHP activates miR-206 expression via a cascade dual inhibitory mechanism. PLoS One. 2009;4:e6880. doi: 10.1371/journal.pone.0006880. [DOI] [PMC free article] [PubMed] [Google Scholar]
- 14.Li G, Zhu Y, Tawfik O, et al. Mechanisms of STAT3 activation in the liver of FXR knockout mice. Am J Physiol Gastrointest Liver Physiol. 2013;305:G829–37. doi: 10.1152/ajpgi.00155.2013. [DOI] [PMC free article] [PubMed] [Google Scholar]
- 15.Yang Z, Zhang Y, Wang L. A feedback inhibition between miRNA-127 and TGFbeta/c-Jun cascade in HCC cell migration via MMP13. PLoS One. 2013;8:e65256. doi: 10.1371/journal.pone.0065256. [DOI] [PMC free article] [PubMed] [Google Scholar]
- 16.He N, Park K, Zhang Y, et al. Epigenetic inhibition of nuclear receptor small heterodimer partner is associated with and regulates hepatocellular carcinoma growth. Gastroenterology. 2008;134:793–802. doi: 10.1053/j.gastro.2008.01.006. [DOI] [PubMed] [Google Scholar]
- 17.Wang L, Lee YK, Bundman D, et al. Redundant pathways for negative feedback regulation of bile acid production. Dev Cell. 2002;2:721–31. doi: 10.1016/s1534-5807(02)00187-9. [DOI] [PubMed] [Google Scholar]
- 18.Bertola A, Mathews S, Ki SH, et al. Mouse model of chronic and binge ethanol feeding (the NIAAA model) Nat Protoc. 2013;8:627–37. doi: 10.1038/nprot.2013.032. [DOI] [PMC free article] [PubMed] [Google Scholar]
- 19.Li Y, Zhang H, Jiang C, et al. Hyperhomocysteinemia promotes insulin resistance by inducing endoplasmic reticulum stress in adipose tissue. J Biol Chem. 2013;288:9583–92. doi: 10.1074/jbc.M112.431627. [DOI] [PMC free article] [PubMed] [Google Scholar]
- 20.Kong B, Wang L, Chiang JY, et al. Mechanism of tissue-specific farnesoid X receptor in suppressing the expression of genes in bile-acid synthesis in mice. Hepatology. 2012;56:1034–43. doi: 10.1002/hep.25740. [DOI] [PMC free article] [PubMed] [Google Scholar]
- 21.Wang L, Liu J, Saha P, et al. The orphan nuclear receptor SHP regulates PGC-1alpha expression and energy production in brown adipocytes. Cell Metab. 2005;2:227–38. doi: 10.1016/j.cmet.2005.08.010. [DOI] [PubMed] [Google Scholar]
- 22.Renga B, Mencarelli A, Migliorati M, et al. Bile-acid-activated farnesoid X receptor regulates hydrogen sulfide production and hepatic microcirculation. World J Gastroenterol. 2009;15:2097–108. doi: 10.3748/wjg.15.2097. [DOI] [PMC free article] [PubMed] [Google Scholar]
- 23.Wang L, Han Y, Kim CS, et al. Resistance of SHP-null mice to bile acid-induced liver damage. J Biol Chem. 2003;278:44475–81. doi: 10.1074/jbc.M305258200. [DOI] [PubMed] [Google Scholar]
- 24.Smalling RL, Delker DA, Zhang Y, et al. Genome-wide transcriptome analysis identifies novel gene signatures implicated in human chronic liver disease. Am J Physiol Gastrointest Liver Physiol. 2013;305:G364–74. doi: 10.1152/ajpgi.00077.2013. [DOI] [PMC free article] [PubMed] [Google Scholar]
- 25.Lee SM, Zhang Y, Tsuchiya H, et al. Shp/Npas2 axis in regulating the oscillation of liver lipid metabolism. Hepatology. 2014 doi: 10.1002/hep.27437. [DOI] [PMC free article] [PubMed] [Google Scholar]
- 26.Calvert JW, Coetzee WA, Lefer DJ. Novel insights into hydrogen sulfide--mediated cytoprotection. Antioxid Redox Signal. 2010;12:1203–17. doi: 10.1089/ars.2009.2882. [DOI] [PMC free article] [PubMed] [Google Scholar]
- 27.Dahlhoff C, Desmarchelier C, Sailer M, et al. Hepatic methionine homeostasis is conserved in C57BL/6N mice on high-fat diet despite major changes in hepatic one-carbon metabolism. PLoS One. 2013;8:e57387. doi: 10.1371/journal.pone.0057387. [DOI] [PMC free article] [PubMed] [Google Scholar]
- 28.Kim JY, Kim HJ, Kim KT, et al. Orphan nuclear receptor small heterodimer partner represses hepatocyte nuclear factor 3/Foxa transactivation via inhibition of its DNA binding. Mol Endocrinol. 2004;18:2880–94. doi: 10.1210/me.2004-0211. [DOI] [PubMed] [Google Scholar]
- 29.Cirillo LA, Lin FR, Cuesta I, et al. Opening of compacted chromatin by early developmental transcription factors HNF3 (FoxA) and GATA-4. Mol Cell. 2002;9:279–89. doi: 10.1016/s1097-2765(02)00459-8. [DOI] [PubMed] [Google Scholar]
- 30.Lupien M, Eeckhoute J, Meyer CA, et al. FoxA1 translates epigenetic signatures into enhancer-driven lineage-specific transcription. Cell. 2008;132:958–70. doi: 10.1016/j.cell.2008.01.018. [DOI] [PMC free article] [PubMed] [Google Scholar]
- 31.Moya M, Benet M, Guzman C, et al. Foxa1 reduces lipid accumulation in human hepatocytes and is down-regulated in nonalcoholic fatty liver. PLoS One. 2012;7:e30014. doi: 10.1371/journal.pone.0030014. [DOI] [PMC free article] [PubMed] [Google Scholar]
- 32.Jaurigue MM, Cappell MS. Therapy for alcoholic liver disease. World J Gastroenterol. 2014;20:2143–58. doi: 10.3748/wjg.v20.i9.2143. [DOI] [PMC free article] [PubMed] [Google Scholar]
- 33.Hultberg B, Berglund M, Andersson A, et al. Elevated plasma homocysteine in alcoholics. Alcohol Clin Exp Res. 1993;17:687–9. doi: 10.1111/j.1530-0277.1993.tb00820.x. [DOI] [PubMed] [Google Scholar]
- 34.Ji C. Mechanisms of alcohol-induced endoplasmic reticulum stress and organ injuries. Biochem Res Int. 2012;2012:216450. doi: 10.1155/2012/216450. [DOI] [PMC free article] [PubMed] [Google Scholar]
- 35.Werstuck GH, Lentz SR, Dayal S, et al. Homocysteine-induced endoplasmic reticulum stress causes dysregulation of the cholesterol and triglyceride biosynthetic pathways. J Clin Invest. 2001;107:1263–73. doi: 10.1172/JCI11596. [DOI] [PMC free article] [PubMed] [Google Scholar]
- 36.Bonaa KH, Njolstad I, Ueland PM, et al. Homocysteine lowering and cardiovascular events after acute myocardial infarction. N Engl J Med. 2006;354:1578–88. doi: 10.1056/NEJMoa055227. [DOI] [PubMed] [Google Scholar]
- 37.Loland KH, Bleie O, Blix AJ, et al. Effect of homocysteine-lowering B vitamin treatment on angiographic progression of coronary artery disease: a Western Norway B Vitamin Intervention Trial (WENBIT) substudy. Am J Cardiol. 2010;105:1577–84. doi: 10.1016/j.amjcard.2010.01.019. [DOI] [PubMed] [Google Scholar]
Associated Data
This section collects any data citations, data availability statements, or supplementary materials included in this article.


