Abstract
The TRPA1 ion channel (a.k.a the ‘wasabi receptor’) is a detector of noxious chemical agents encountered in our environment or produced endogenously during tissue injury or drug metabolism. These include a broad class of electrophiles that activate the channel through covalent protein modification. TRPA1 antagonists hold potential for treating neurogenic inflammatory conditions provoked or exacerbated by irritant exposure. Despite compelling reasons to understand TRPA1 function, structural mechanisms underlying channel regulation remain obscure. Here, we use single-particle electron cryo-microscopy to determine the structure of full-length human TRPA1 to ~4Å resolution in the presence of pharmacophores, including a potent antagonist. A number of unexpected features are revealed, including an extensive coiled-coil assembly domain stabilized by polyphosphate co-factors and a highly integrated nexus that converges on an unpredicted TRP-like allosteric domain. These findings provide novel insights into mechanisms of TRPA1 regulation, and establish a blueprint for structure-based design of analgesic and anti-inflammatory agents.
Transient receptor potential (TRP) ion channels play critical roles in somatosensation by serving as sensors for thermal and chemical stimuli1,2. In mammals, the TRPA1 subtype (so named for its extensive N-terminal ankyrin repeat domain) is expressed by primary afferent nociceptors, where it detects structurally diverse noxious compounds that elicit pain and neurogenic inflammation. Such activators include pungent irritants from mustard, onion, and garlic, as well as volatile environmental toxins and endogenous pro-algesic agents3–9. TRPA1 is also activated downstream of phospholipase C-coupled receptors and has been proposed to function as a sensor of noxious cold3,6,10,11. TRPA1 is associated with persistent pain, respiratory, and chronic itch syndromes12,13 and is therefore a promising target for treating these and other neurogenic inflammatory conditions. While selective TRPA1 antagonists have been developed, their sites and mechanisms of action remain unclear.
Many TRPA1 agonists are potent electrophiles that activate the channel through covalent modification of conserved cysteine or lysine residues within the cytoplasmic N-terminus14,15. While these and other functional properties have been gleaned from electrophysiological studies of TRPA1 in whole cells, channel activity is not readily retained in excised membrane patches. This ‘run down’ can be mitigated if membranes are excised into solutions containing polyphosphates, suggesting that obligate cytoplasmic co-factors support TRPA1 function in intact cells16–18. Importantly, robust TRPA1 activity has yet to be demonstrated with purified protein, further suggesting that co-factors are required to stabilize the channel in cell-free systems. Therefore, elucidating the biophysical and structural basis of polyphosphate regulation is key to understanding how TRPA1 is regulated in vivo, and how it can be efficiently manipulated in artificial systems for more detailed functional characterization.
A transformative step in addressing these questions would be to determine the channel’s three-dimensional (3D) atomic structure. TRP channels have posed particular challenges in this regard, likely reflecting their conformationally dynamic nature and diverse intracellular elements. Electron microscopy provides a potential means to achieve this goal, although for TRPA1 this approach has heretofore yielded densities of relatively low-resolution (~16Å)19. However, advances in single particle electron cryo-microscopy (cryo-EM) have recently enabled de novo structural analysis of TRPV1 to near-atomic (≤4.0Å) resolution20,21. Here, we exploit this approach to determine the structure of the full-length human TRPA1 channel to ~4Å resolution, revealing the structural basis of subunit assembly, polyphosphate action, and antagonist binding.
Unique architecture of human TRPA1
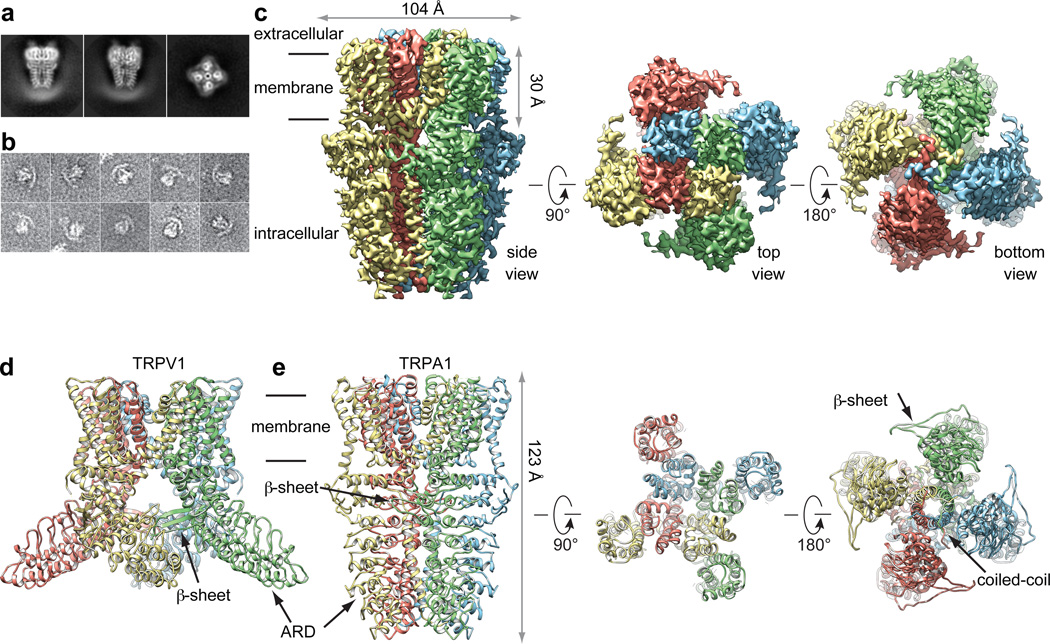
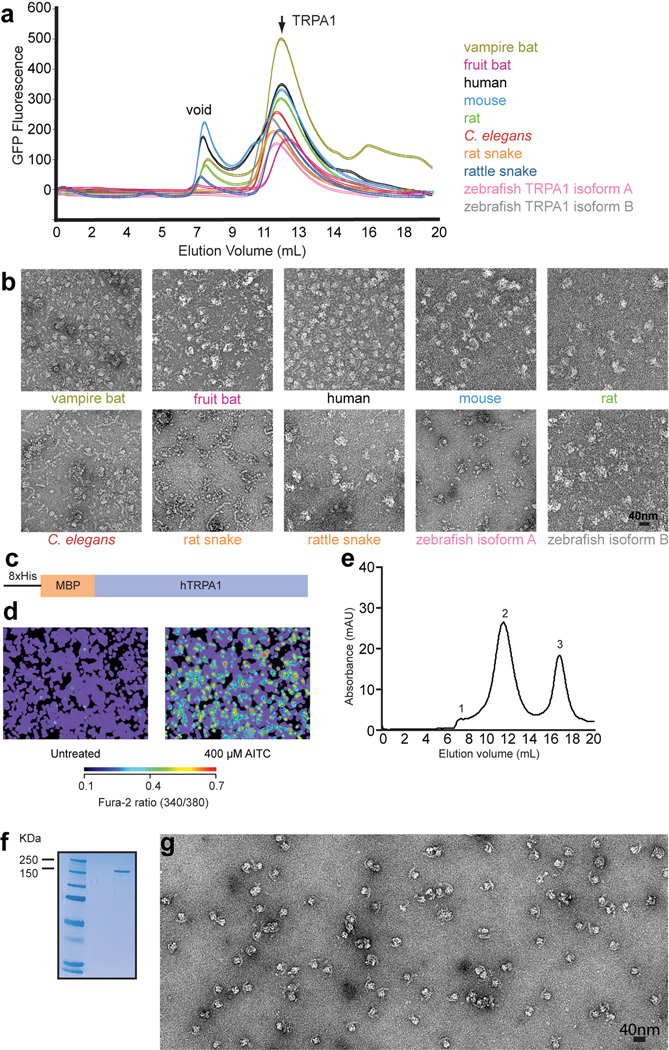
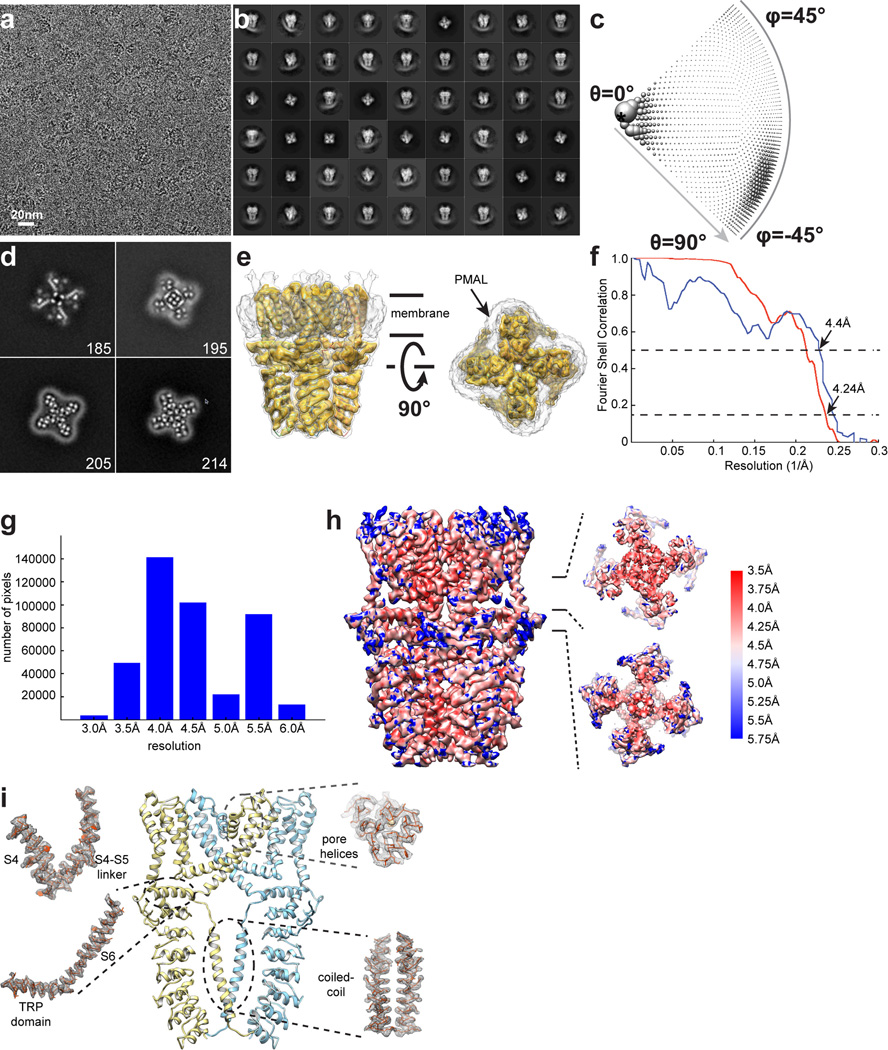
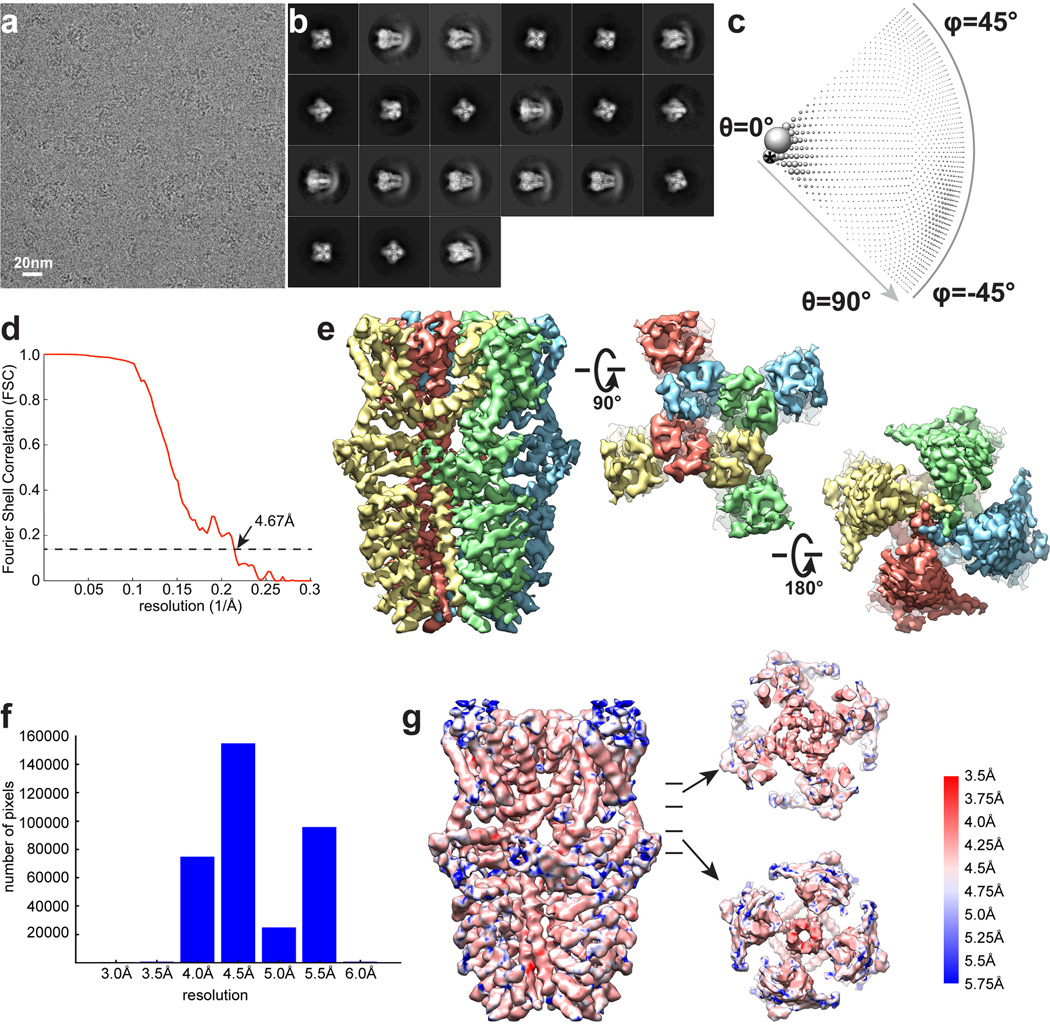
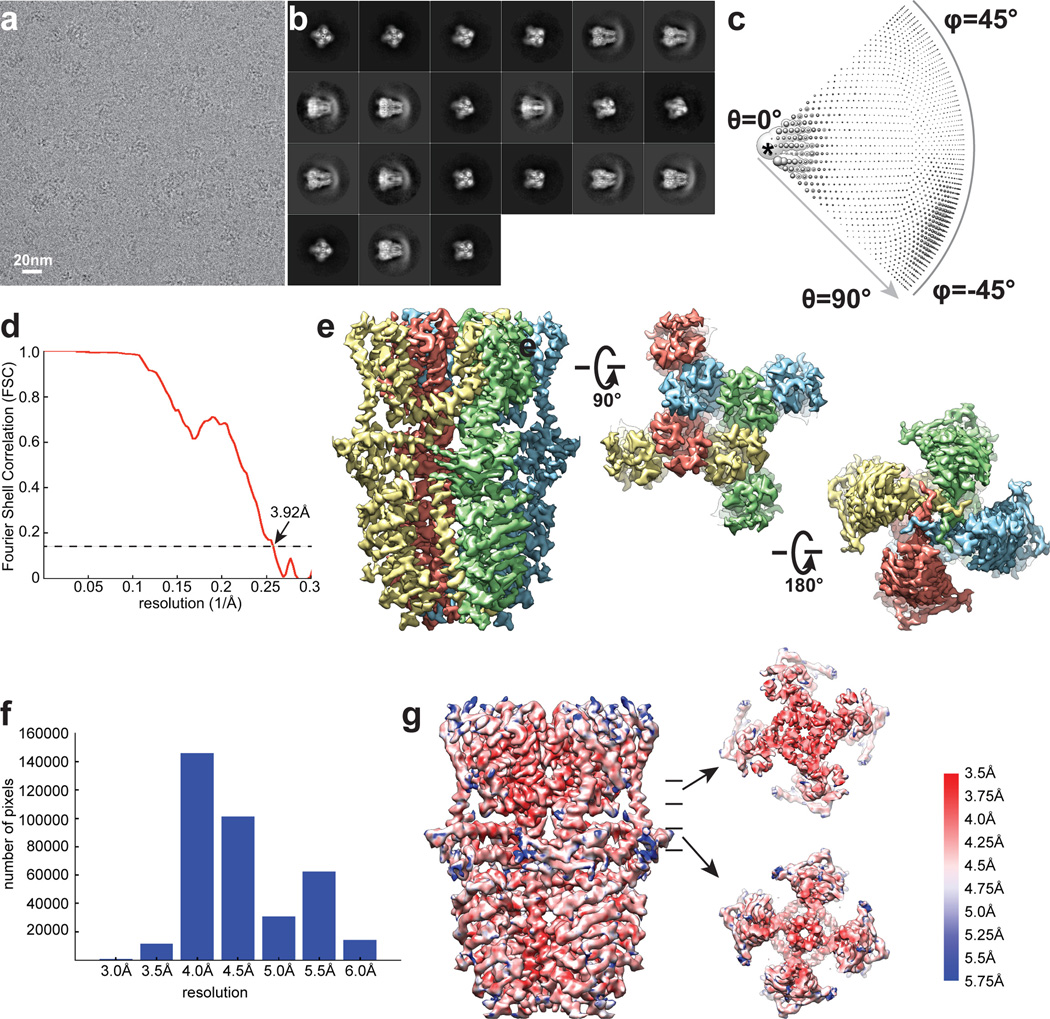
A screen of TRPA1 orthologues identified the human channel as the top candidate for structural analysis based on particle size and conformational homogeneity (Extended Data Fig. 1a, b). Purified, detergent solubilized protein appeared as homogeneous, mono-dispersed particles from which gross architectural features, such as a putative transmembrane core and extensive intracellular domain, could already be discerned (Extended Data Fig. 1b). Following exchange into an amphipathic polymer, hTRPA1 samples were imaged using negative stain and single-particle cryo-EM, as previously described (Fig. 1a, b and Extended Data Figs. 1g and 2–5)21. We imaged samples under a variety of conditions, ultimately obtaining high-resolution 3D reconstructions only in the presence of an agonist (allyl isothiocyanate, AITC) or antagonists (HC-030031 with and without A-967079) to 4.24Å, 3.9Å, and 4.7Å, respectively using gold-standard refinement and Fourier shell correlation (FSC) = 0.143 criterion for resolution estimation (Fig. 1c and Extended Data Figs. 3–5). Indeed, even two-dimensional (2D) class averages of particles with these additives revealed elements of secondary and tertiary structure, including the channel’s tetrameric organization, well-resolved densities for the putative transmembrane core, and a central stalk flanked by convex stems that transition into a highly flexible crescent-shaped element (Fig. 1a and Extended Data Figs. 3b, 4b, and 5b). This latter element was routinely observed by negative stain imaging for all orthologues examined (Fig. 1b and Extended Data Fig. 1b and g), and is thus a bona fide and conserved structural feature. In 3D reconstructions, most side-chains were seen in sufficient detail to allow de novo atomic model building, which was initially achieved with samples treated with AITC (Fig. 1e and Extended Data Figs. 3 and 6). High-resolution information suitable for model building spanned residues K446-T1078, excluding only the most distal cytoplasmic regions, a short S1–S2 linker that extends into the extracellular space, and a short helix that links a putative C-terminal β-strand to the coiled-coil domain (Extended Data Fig. 7a, b). Thus, we have resolved the structure of the vast majority of the transmembrane core and proximal cytoplasmic regions involved in subunit assembly and electrophile detection. Together, these regions represent ~50% of the protein. Except where noted, discussion of the structure pertains to the AITC-treated sample.
Figure 1. 3D reconstruction of hTRPA1.
a, Representative cryo-EM 2D class averages of hTRPA1 (side views, left and middle; end-on view, right). b, Representative negative stain particles in amphipol. c, 3D density map of hTRPA1 from AITC-treated sample filtered to 3.5Å resolution with each subunit color-coded. Three views show side, top, and bottom. d, Ribbon diagram of rTRPV1 apo-state atomic model for comparison. e, Ribbon diagram of hTRPA1 atomic model for residues K446-T1078, including the last five ankyrin repeats. Channel dimensions are indicated; side, top, and bottom views are shown.
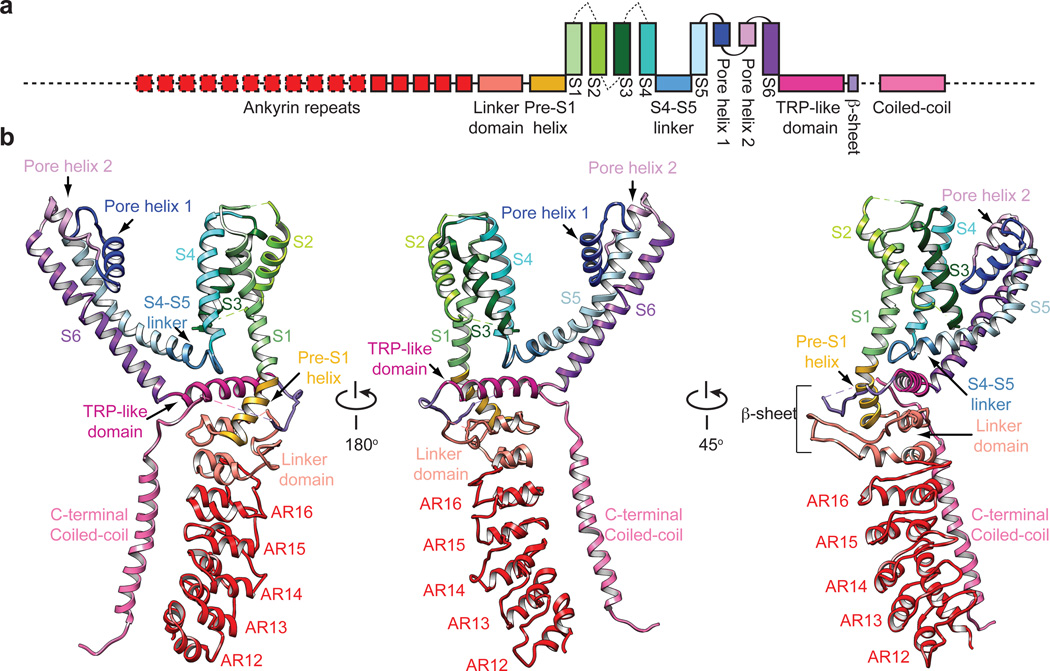
From a bird’s-eye view, hTRPA1 resembles TRPV1 and distantly related voltage-gated potassium (Kv) channels: each subunit consists of six transmembrane α-helices (S1 – S6) plus a re-entrant pore loop between S5 and S6; homotetramers are formed through ‘domain swap’ interactions (Fig. 1d and e). Apart from this conserved transmembrane core, hTRPA1 exhibits numerous distinctive features, particularly within the large intracellular N- and C-terminal domains, which together account for ~80% of the channel’s mass (Fig. 2). For example, a C-terminal tetrameric parallel coiled-coil mediates extensive subunit interactions (Figs. 1e and 2b). Also, a domain that contains five ankyrin repeats surrounds the coiled-coil and is linked with another extended feature that forms the crescent-shaped element (Figs. 1e, 2b and Extended Data Fig. 8). Key cysteines that contribute to activation by electrophiles are located within the pre-S1 region at solvent accessible sites, likely accounting for their relative chemical reactivity. Moreover, these residues are in close apposition to a ‘TRP-like’ allosteric modulatory domain characteristic of other TRP channels (but not predicted to exist in TRPA1), providing mechanistic insight into electrophile-evoked channel gating.
Figure 2. Structural details of a single hTRPA1 subunit.
a, Linear diagram depicting major structural domains color-coded to match ribbon diagrams below. Dashed lines and boxes denote regions for which density was insufficient to resolve detailed structure (sequence prior to AR12, loop containing C665, S1–S2, S2–S3 and S3–S4 linkers, connection between third β-strand and coiled-coil, C-terminus subsequent to coiled-coil), or where specific residues could not be definitively assigned (portion of the linker prior and subsequent to the coiled-coil). b, Ribbon diagrams depicting three views of hTRPA1 subunit.
Coiled-coil and polyphosphate binding
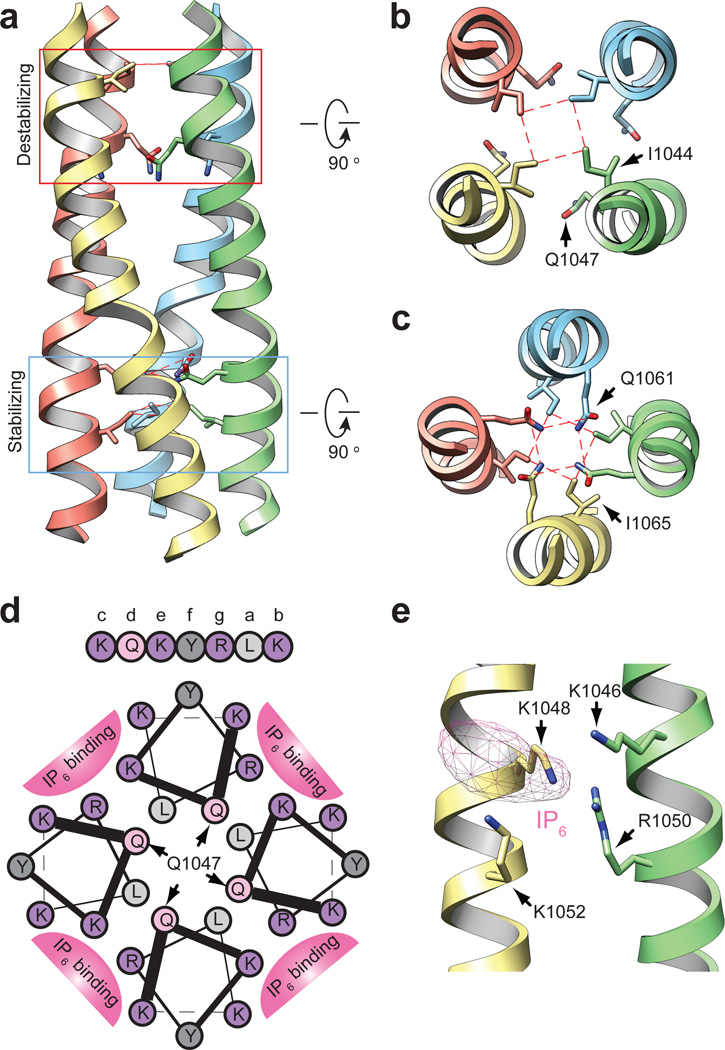
A striking feature of the hTRPA1 structure is a well resolved (<4Å) tetrameric coiled-coil located at the center of the channel, below the ion permeation pore near the C-terminus, where it forms a stalk-like interaction locus for all four subunits (Fig. 1e and Extended Data Fig. 7c, d). Although coiled-coils have been shown to mediate subunit assembly for some TRP subtypes, the primary sequence within this region of TRPA1 is predicted to contain α-helices, but not a coiled-coil, per se22. Nonetheless, our structure reveals side chain interactions at ‘a’ and ‘d’ positions throughout the core, consistent with coiled-coil geometry, but distinct from the canonical coiled-coil heptad repeat, where ‘a’ and ‘d’ position are typically occupied by hydrophobic residues. Instead, TRPA1 contains two glutamines in staggered ‘d’ positions that may destabilize the structure (Q1047) and/or interact through intra-planar hydrogen bonds (Q1061) (Fig. 3a–c)23. Furthermore, residues on the exterior surface of coiled-coils (‘b, c, e–g’ positions) are commonly polar or charged to facilitate inter-helix and solvent interactions, but here we see a number of hydrophobic or aromatic residues in these locations, of which only half interact with another channel domain (see below). This coiled-coil based mechanism of subunit interaction differs from that seen in TRPV1, where ankyrin repeats on one subunit form contacts with a three-stranded β-sheet on the adjacent subunit (Fig. 1d). Thus, TRP channels associate through at least two broad structural mechanisms, irrespective of whether they contain an ARD.
Figure 3. C-terminal coiled-coil mediates cytosolic interactions and polyphosphate association.
a, Side view of hTRPA1 coiled-coil with two core glutamines boxed in red (destabilizing) or blue (stabilizing). b and c, Cross sections of coiled-coil at indicated regions with core residues depicted in stick format. Dashed red lines show residue interactions. d, Helical wheel presentation of residues K1046–K1052. Q1047 from each subunit is indicated with an arrow. Basic residues in ‘b, e’ and ‘c, g’ positions of neighboring helices form the binding site for IP6. Colors differentiate class of residues: light gray, aliphatic; dark gray, aromatic; light pink, polar; purple, basic. e, 3D reconstruction contains density for IP6 adjacent to positively-charged pocket formed by K1046, R1050 and K1048, K1052 between neighboring coiled-coil helices. Though not modeled, IP6 likely docks parallel to the coiled-coil such that each positively charged residue coordinates an individual phosphate moiety.
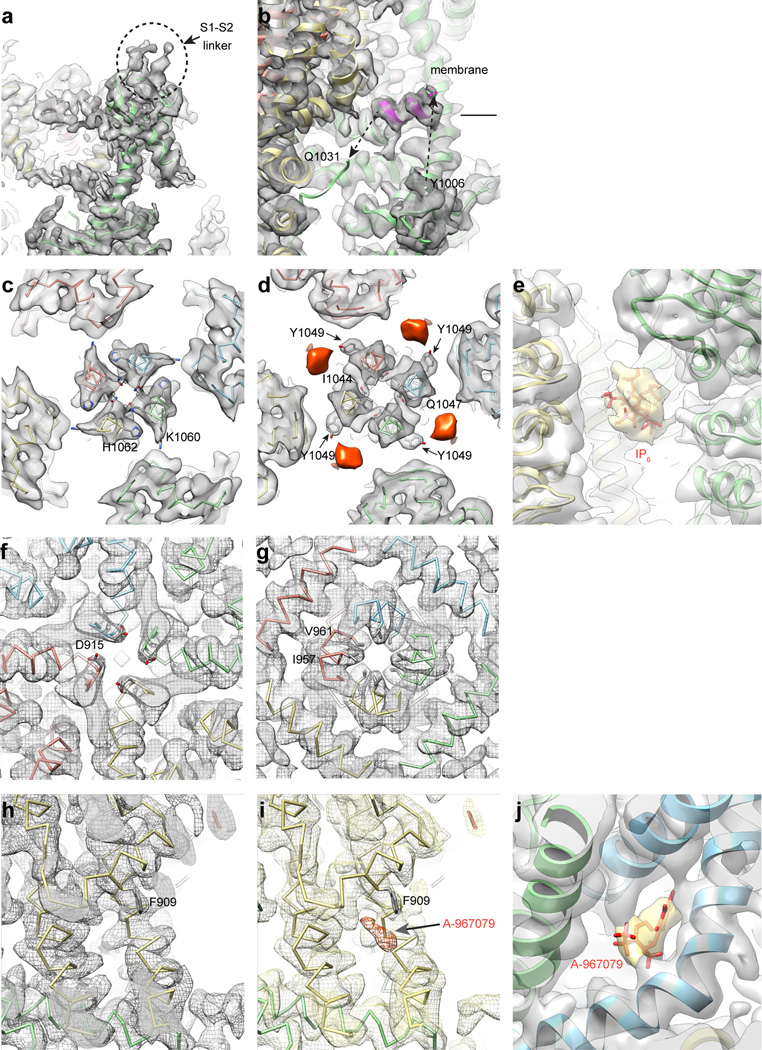
Physiological studies have shown that soluble polyphosphates sustain TRPA1 channel activity in excised membrane patches16–18. Indeed, we found that inclusion of inositol hexakisphosphate (IP6) throughout channel purification was a prerequisite to obtaining mono-dispersed protein. Nevertheless, a mechanistic explanation for this phenomenon has been lacking. Remarkably, we always observed strong densities near the coiled-coil that likely correspond to IP6 (Extended Data Fig. 7d, e). Positively charged residues K1046, R1050 and K1048, K1052 from neighboring coiled-coil strands associate with this density via four-coordinate charge-charge interactions, consistent with the observation that polyphosphates having at least four phosphate moieties are most effective at supporting TRPA1 function (Fig. 3d, e)16. Interestingly, the presumptive destabilizing core residue (Q1047) is located between IP6-coordinating side chains (K1046 and K1048), and thus inter-helical cross bridging by IP6 could counteract this glutamine-mediated coiled-coil destabilization (Fig. 3a and d). This interaction is reminiscent of a previously established role for IP6 as an essential co-factor for adenosine deaminase24, and further illustrates how cellular polyphosphates can function as primitive protein stabilization factors25.
Pre-S1, TRP domain, and reactive sites
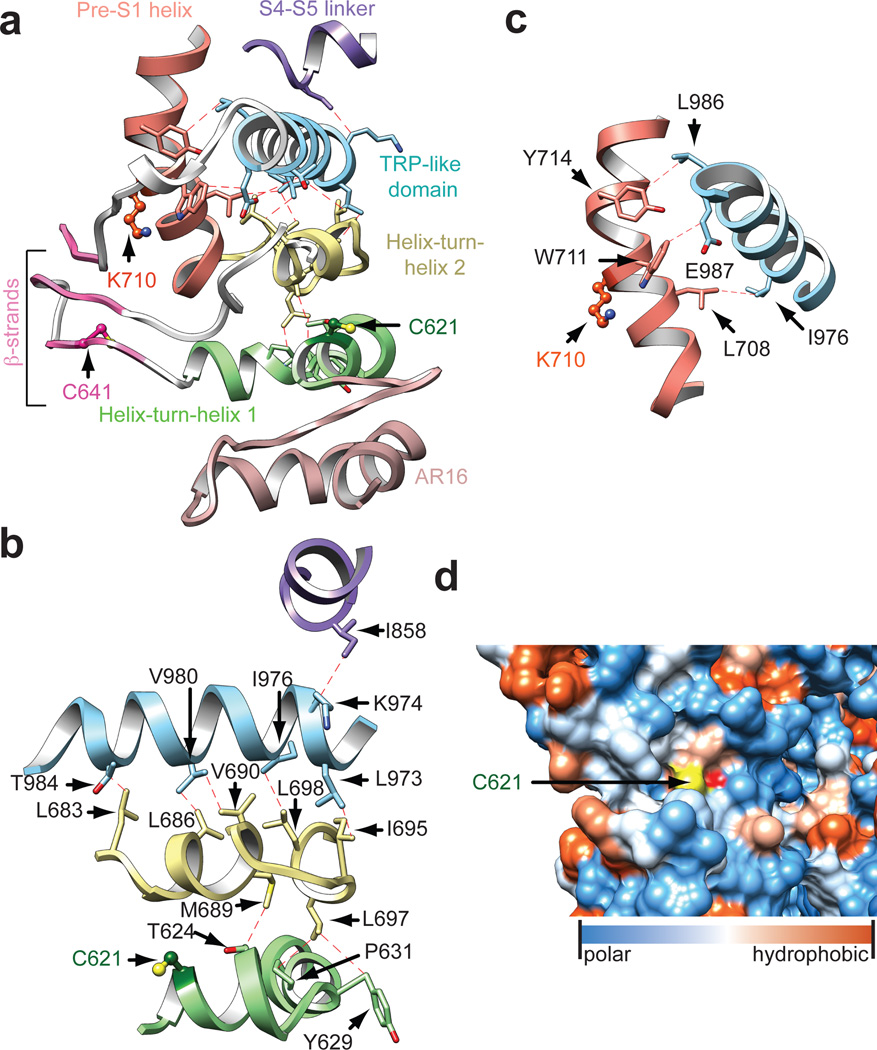
The pre-S1 region connects the ankyrin repeat domain (ARD) to S1 and is of particular interest because it contains residues targeted by electrophilic agonists (Fig. 4a)14,15. This region consists of two elements, including the pre-S1 helix and a preceding linker region, whose primary sequence yields little insight into its structure or mechanistic connection to channel gating. Our 3D structures reveal an overall topology for the linker consisting of two helix-turn-helix motifs separated by two putative anti-parallel β-strands (Fig. 4a). Although TRPA1 was not predicted to contain a TRP domain because it lacks a canonical ‘TRP box’ motif, an α-helix directly following S6 is structurally and topologically analogous to the TRP domain in TRPV1, although located further below the inner membrane leaflet compared to TRPV1.
Figure 4. Cytoplasmic domains form an integrated nexus.
a, Domain architecture and web of interactions between the TRP-like domain (blue) and pre-S1 helix (orange), the overlying S4–S5 linker (purple) and underlying linker region, consisting of two helix-turn-helix motifs (green and yellow) separated by two putative anti-parallel β-strands (pink). A third β-strand (pink) is contributed by residues following the TRP-like domain. Structurally resolved reactive cysteines and lysine (C621, C641, and K710) are shown in ball and stick format. The helix-turn-helices are stacked above the ARD (rose). b, The TRP-like domain forms hydrophobic interactions with the second helix-turn-helix motif and S4–S5 linker. The first helix-turn-helix (containing C621) is integrated with the TRP-like domain through interactions with the intervening second helix-turn-helix. c, The TRP-like domain also interacts with the pre-S1 helix. d, C621 is located in a closely-packed pocket lined by AR16 below and the second helix-turn-helix above. C621 is shown as a hydrophobicity surface.
The linker is integrated with the overlying TRP-like domain through two main structural features: multiple hydrophobic interactions between stacked α-helices, and formation of a putative three-stranded β-sheet in which two strands are contributed by the linker and one by the sequence following the TRP-like domain (Fig. 4a, b). While an analogous three-stranded β-sheet in TRPV1 mediates inter-subunit interactions, this putative motif in TRPA1 appears to be a freestanding structure (Fig. 1e). Interestingly, the third β-strand connects to a short, poorly resolved α-helix that is almost buried in the inner leaflet of the membrane and forms part of a poorly resolved loop connecting the TRP-like domain with the C-terminal coiled-coil (Extended Data Fig. 7b). Many TRP channels are modulated by membrane phospholipids (such as PIP2)26 and this connecting helix in hTRPA1 may provide a structural basis for such regulation.
The TRP-like domain in hTRPA1 makes additional contacts with other non-contiguous structures, including the pre-S1 helix and S4–S5 linker, consistent with proposed roles for TRP domains as sites of allosteric modulation (Fig. 4b, c)20. In TRPV1, the TRP domain interacts with the pre-S1 helix and S4–S5 linker via polar interactions20, whereas in TRPA1 these interactions are exclusively hydrophobic, and more extensive (Figure 4b, c). Nonetheless, our structure suggests that the TRP-like domain in TRPA1 likewise subserves allosteric regulation, which was not readily apparent without a 3D model.
Our structure also reveals the spatial distribution within the pre-S1 region of key cysteine and lysine residues that contribute to electrophile sensitivity: C621 resides in the first helix-turn-helix; C641 is located in the first strand of the putative β-sheet; C665 is in a flexible loop connecting the β-strands to the second helix-turn-helix; and K710 is located within the pre-S1 helix (Fig. 4a). Each of these sites is solvent accessible, and their locations within this allosteric nexus makes them well suited to detect reactive chemical agonists and transmit these events to the TRP-like domain (Fig. 4a–c). For example, C621 is packed in a polar pocket between ankyrin repeat 16 (AR16) and the overlying helix-turn-helix (Fig. 4a, d). As such, electrophiles may provide a driving force for conformational change that relieves steric hindrance and/or electrostatic repulsion following chemical modification. Additionally, this key cysteine is located at the beginning of an α–helix and adjacent to a lysine, likely reducing the pKa of the thiol moiety to enhance its nucleophilic character27. We were unable to resolve AITC-mediated adduct formation due to insufficient resolution at these sites (estimated at 4 – 4.5Å) and/or instability of the resulting modification, and thus this mechanism remains speculative until a bona fide ligand-channel complex can be clearly visualized. Moreover, we have not observed marked conformational changes within this region when comparing structures in the presence of AITC versus antagonists, but this may simply reflect lack of channel activity under conditions amenable to cryo-EM analysis. Additionally, residues in the distal N-terminus (e.g. C421 in mouse TRPA1) or transmembrane core (e.g. S943 and I946 in hTRPA1) may contribute to electrophile sensitivity15,28,29. The former region is unresolved in our structure, and the latter residues are unlikely to be directly modified by electrophiles. Among five cysteine and lysine residues in the transmebrane core, three (C727, K771, and C834) face the membrane environment and could therefore be modifiable by lipophilic electrophiles.
Ankyrin repeat domain
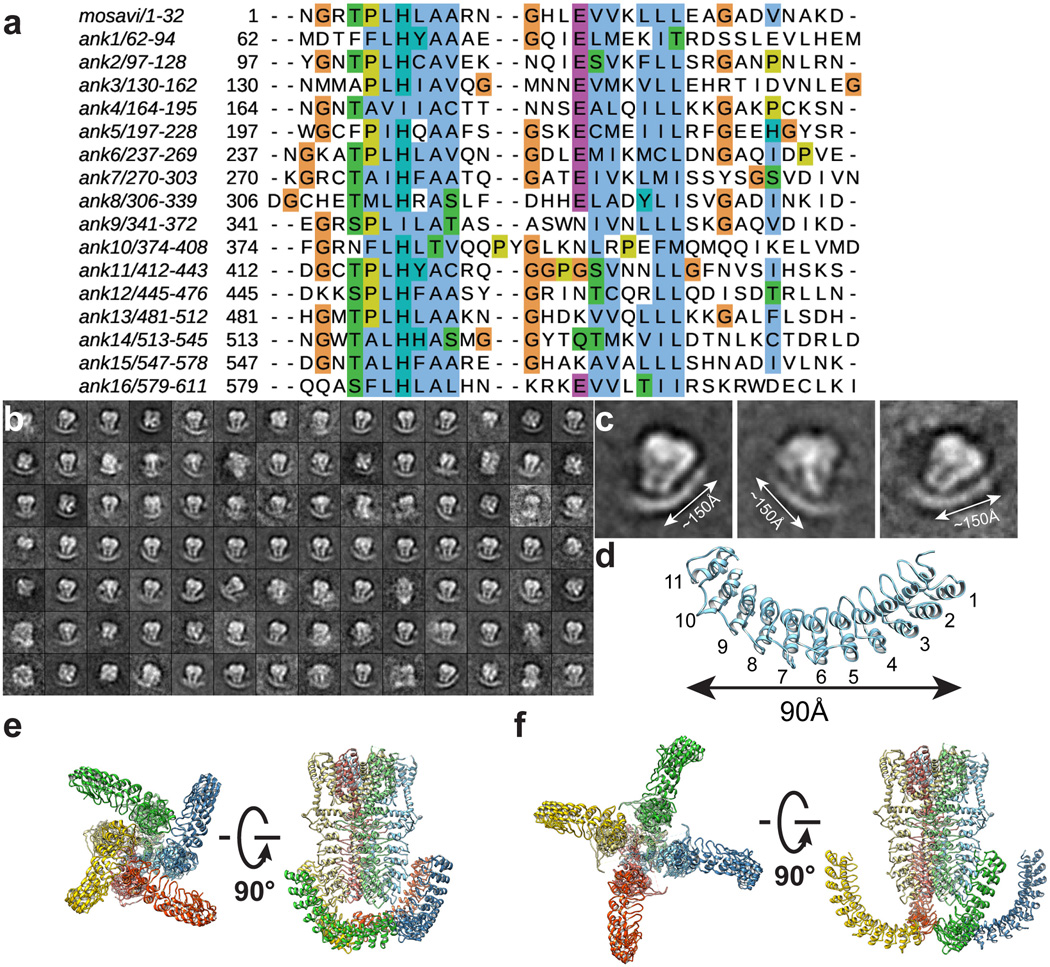
The extensive N-terminal ankyrin array is the namesake for TRPA1, yet we have little understanding of its functionality. Indeed, among vertebrate TRPs, TRPA1 boasts the longest ARD, variably estimated to consist of 14–18 ARs1,17,30,31. In our raw micrographs (negative stain and cryo-EM) and 2D class averages, the TRPA1 N-terminus is distributed into two distinct densities consisting of well-resolved convex ‘stems’ followed by a flexible ‘crescent’ (Fig. 1a and b). In all of our 3D reconstructions, we see density for five well-defined ARs (resolved to ~4 – 5Å) that contribute to the stems (Fig. 1c and Extended Data Figs. 3–5). A homology model predicts that the crescent consists of eleven ARs spanning ~100Å, which may adopt a propeller arrangement that facilitates intersubunit interactions (Extended Data Fig. 8).
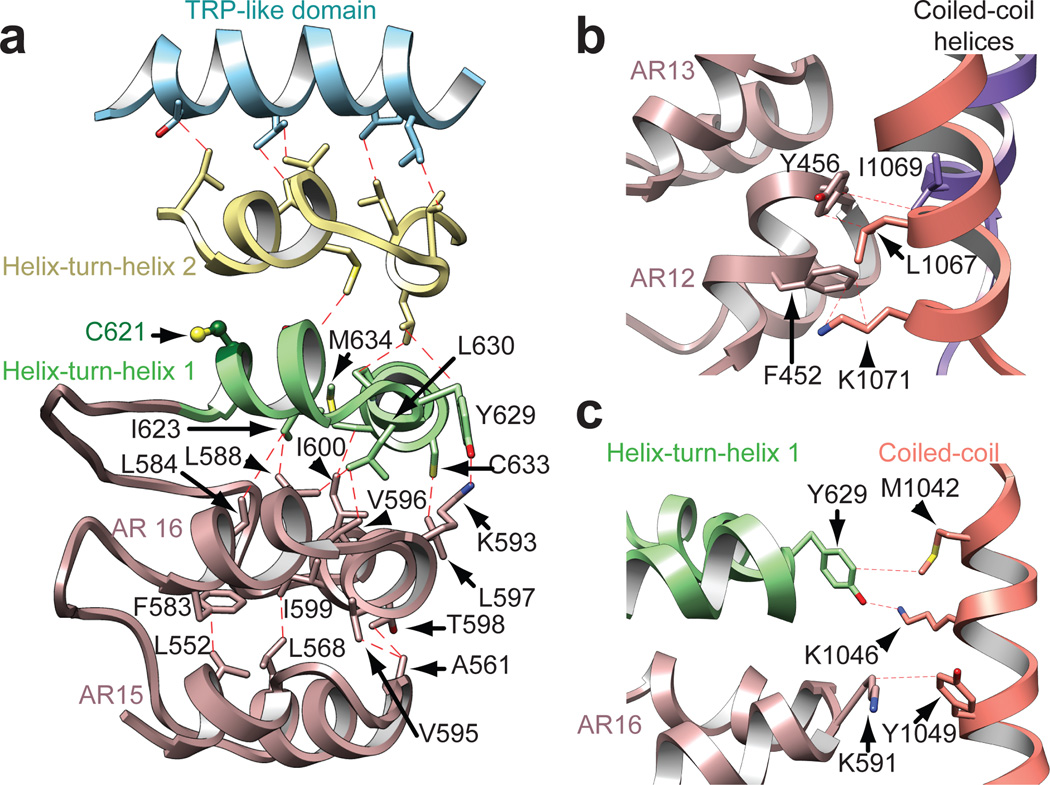
In some non-mammalian species, such as insects and snakes, TRPA1 exhibits relatively low sensitivity to electrophiles and is, instead, activated by heat32–35. Chimeric and mutagenesis studies have identified regions within the ARD that specify thermal or chemical responsiveness36,37, suggesting that the ARD can communicate with the pore. In this regard, packing interactions sterically link the ARs in the stem with the overlying helix-turn-helix motifs of the linker region through hydrophobic and some polar interactions (Fig. 5a). This is propagated upwards and terminates within the TRP-like domain, thereby forming a network of packed interactions capable of transducing information from the ARD to the pore (Fig. 5a). Also of note are close side chain interactions between the coiled-coil region and AR12, as well as AR16 and first helix-turn-helix, which likely stabilize the well-resolved intracellular stems, contributing to channel assembly (Fig. 5b, c). In addition to electrophilic irritants, mammalian TRPA1 can be activated or modulated downstream of phospholipase C-coupled receptors through increased cytosolic calcium or possibly direct interaction with Gβγ. These and other modulatory activities may also be specified by the ARD4,6,11,18, in which case further mechanistic insights will require high-resolution structures of several TRPA1 species orthologues that include this entire domain.
Figure 5. Structural integration of the ARD.
a, The interdigitated convex ‘stem’ region of the ARD consisting of AR12–16 (only AR15 and AR16 are shown; rose) couples to the allosteric TRP-like domain (blue) through interactions with two intervening helix-turn-helix motifs (green and yellow) of the linker region. AR15–16 stacking is stabilized through hydrophobic interactions. AR16 is also connected to the overlying first helix-turn-helix motif through hydrophobic and polar interactions. b and c, The ARD and linker region make connections with the coiled-coil through a series of hydrophobic, polar, and potentially π-cation interactions involving residues in AR12 and 13 (b) as well as AR16 and the first helix-turn-helix of the linker region (c). Coiled-coil α-helices from the same and neighboring subunit are colored orange and purple, respectively.
Pore and antagonist binding site
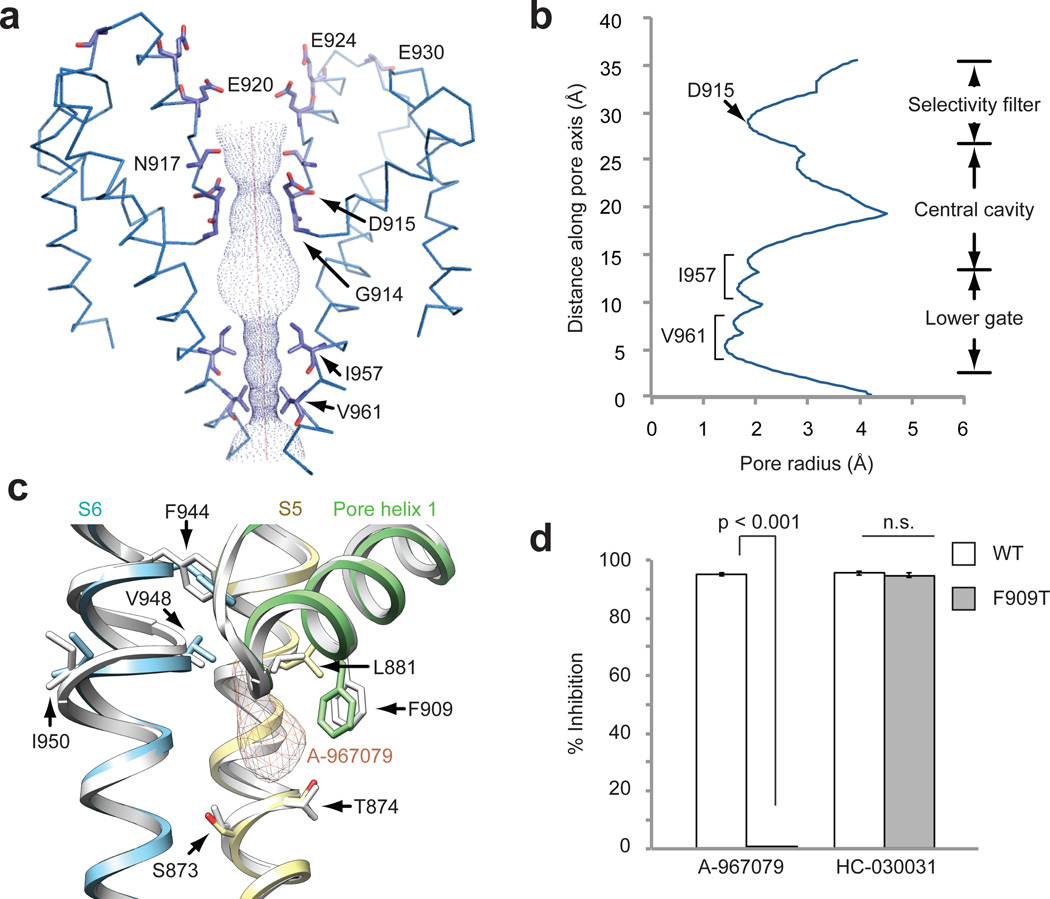
The central cavity in the ion permeation pathway of AITC-treated hTRPA1 (resolved to 3.5–4.5Å) grossly resembles that of TRPV1 in exhibiting two major constrictions (Fig. 6a, b). There are, however, some notable differences. For example, the outer pore domain of hTRPA1 contains two pore helices, reminiscent of bacterial voltage-gated sodium channels, where the second helix likely acts as a negatively charged conduit for attracting cations and repelling anions from the channel mouth (Fig. 6a)38. In contrast, TRPV1 and Kv channels contain only a single pore helix21,39. Moreover, the steeper shape of the outer pore region in hTRPA1 is distinct from the wider outer vestibule seen in TRPV1 (closed state) and bacterial Nav channels, but more reminiscent of Kv channels38,39.
Figure 6. The ion permeation pathway and antagonist binding site.
a, Solvent accessible pathway along the pore of AITC-treated channel mapped with HOLE program. D915 in a loop between the first and second pore helices is the sole contributor to the upper restriction, which is structurally analogous to M644 in TRPV1. In contrast, G914 and N917, structurally equivalent to G643 and D646 in TRPV1, do not appear to contribute to the upper constriction. A string of acidic residues in the second pore helix (E920, E924, E930) likely form a negatively charged conduit to attract cations and repel anions. The lower gate is formed by I957 and V961, the former of which is analogous to I679 in TRPV1. b, Radius of the pore as calculated through HOLE program. c, Cryo-EM map for the double antagonist-treated sample contains a unique density corresponding to A-967079 (orange) and located within a pocket formed by S5 (yellow), S6 (blue) and the first pore helix (green). Residues implicated in A-967079 antagonism are indicated, many of which line this pocket and undergo subtle conformational changes upon antagonist binding (AITC model shown in white). d, Quantification of antagonist-mediated inhibition of AITC-evoked currents in oocytes expressing wild-type or F909T mutant hTRPA1 channels. Responses were first evoked with AITC (200 µM) alone, and then in the presence of A-967079 (10 µM) or HC-030031 (100 µM). Data represent percentage of inhibition of the AITC-evoked maximal current at +80 mV (n = 7 independent cells per group, mean ± S.E.M, Student’s t-test). Representative current traces are in Extended Data Fig. 9.
Differences are also seen in the presumptive gates. First, the upper gate in TRPV1 is formed by two residues (G643 and M644), whereas that of hTRPA1 is formed by one (D915). Here, we see a restriction point measuring 7.0Å between diagonally opposed D915 residues, which is narrower than that seen in TRPV1 (7.6Å) in the activated state, but potentially wide enough (>6Å) to accommodate partially dehydrated calcium ions (Fig. 6a, b and Extended Data Fig. 7f)20,40,41. Interestingly, D915 has previously been implicated in controlling calcium permeability in mouse TRPA118. Second, the lower gate in TRPV1 is formed by a single constriction in S6 at residue I679, whereas that of hTRPA1 consists of two hydrophobic seals formed by I957 and V961, creating an increasingly constricted funnel whose narrowest point (6.0Å) is sufficient to block conduction of rehydrated cations (Fig. 6a, b and Extended Data Fig. 7g). Thus, we may have caught TRPA1 in an intermediate configuration in which the upper gate is partially open and the lower gate closed. Alternatively, the upper constriction may not constitute a regulated gate due to a more highly scaffolded structure afforded by the second pore helix. Distinguishing between these possibilities will require stabilizing TRPA1 in distinct functional states under conditions amenable to structural analysis.
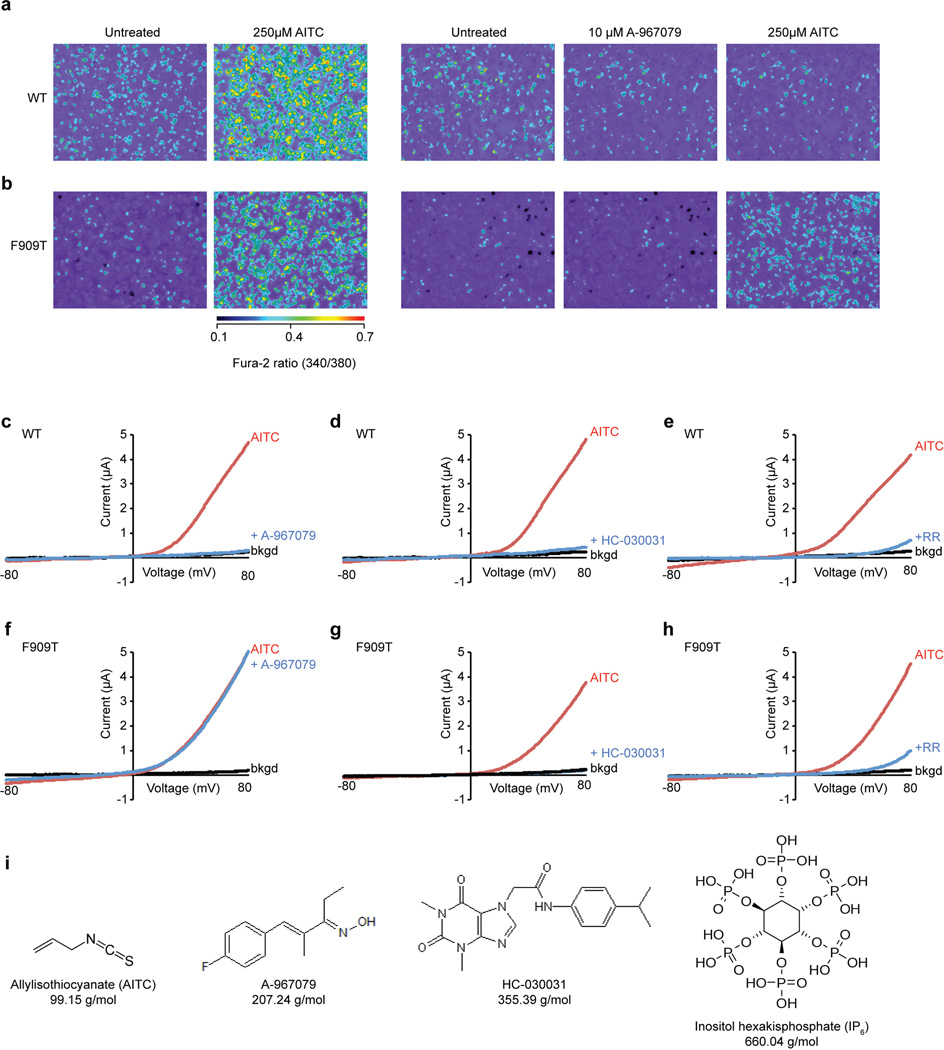
HC-030031 and A-967079 represent the two main classes of TRPA1 antagonists7,42,43. We determined structures of hTRPA1 in the presence of HC-030031, alone, or together with A-967079. Remarkably, the double antagonist structure revealed a unique density within a pocket formed by S5, S6 and the first pore helix (Fig. 6c and Extended Data Fig. 7h–j). This density was not observed in the structure with HC-030031 alone, and thus likely corresponds to A-967079. Phylogenetic comparisons together with molecular modeling have identified six residues required for A-967079 sensitivity44–47, all of which surround the observed density, as does F909, which is highly conserved and therefore not previously implicated in A-967079 binding (Fig. 6c). Indeed, mutation of this residue (F909T) abrogated A-967079 inhibition of AITC-evoked responses (Fig. 6d and Extended Data Fig. 9), further corroborating assignment of this antagonist site. It has been proposed that A-967079 forms H-bond interactions with S873 and/or T874, which are also located at the bottom of the putative binding pocket (Fig. 6c)47. Consequently, orientation of the antagonist’s phenyl ring in proximity to F909 may stabilize ligand binding through π–π interactions. In fact, in the double antagonist structure, F909 and additional key residues move closer to the A-967079 density, suggesting that drug binding occurs via an ‘induced fit’ mechanism involving movements in all three aforementioned regions that comprise the pocket (Fig. 6c, compare to AITC model in white).
A-967079 may hinder channel activity through coordinated binding to S5, S6, and first pore helix domains, which in TRPV1 are mobile elements involved in gating. As such, A-967079 may act as a molecular wedge to inhibit opening of the lower gate by impeding movement of these elements. In the case of TRPV1, classic vanilloid ligands occupy a site within the lower S2–S4 bundle. Moreover, local anesthetics inhibit Nav channels by binding to discrete sites along the S6 pore-lining surface to block the selectivity filter or activation gate48,49. Therefore, the A-967079 binding pocket described here constitutes a novel pharmacological site. Lastly, the mutations described above do not impair HC-030031 antagonism, suggesting that these two compounds bind to discrete sites (Fig. 6d and Extended Data Fig. 9g). We were unable to identify a second density corresponding to HC-030031, perhaps owing to its lower affinity, leaving its binding site and mechanism of action unresolved.
Concluding remarks
TRPA1 is a sensor for chemical irritants and a major contributor to chemonociception. We now show that key residues involved in irritant detection are solvent accessible and lie within a putative allosteric nexus converging on an unpredicted TRP-like domain, suggesting a structural basis whereby TRPA1 functions as a sensitive, low threshold electrophile receptor. An important next step is to visualize electrophile-evoked conformational changes in hTRPA1 that are associated with gating, a goal that will require robust stabilization of TRPA1 under conditions amenable to structural studies. Our analysis of how IP6 stabilizes the channel represents a step in this direction. But what physiologic purpose does IP6 interaction serve? Perhaps by stabilizing the coiled-coil domain, polyphosphates function as second messengers that, together with cytosolic calcium and G-proteins, modulate TRPA1 activity when phospholipase C-coupled receptors hydrolyze phosphatidylinositol 4,5-bisphospate to generate inositol polyphosphates.
Our study uncovers a number of similarities between TRPA1 and TRPV1 that likely represent pan-TRP features20,21. Both channels assemble as homotetramers that exhibit domain swapping within the transmembrane core, and possess an ion permeation pathway controlled by two restriction points, the lower of which involves a conserved isoleucine residue. Additional modes of intersubunit interactions are facilitated by discrete substructures within the cytoplasmic domain, though the exact nature of these contacts is protein-specific (e.g. β-strand:ARD interactions, coiled-coil, crescent propeller, etc). These cytoplasmic intersubunit interactions may regulate channel assembly and/or facilitate concerted conformational changes upon co-factor binding or agonist-evoked gating, akin to domain swapping in the transmembrane core. Additionally, an α-helix subsequent to S6 (TRP domain or structural analogue) likely operates as a conserved allosteric regulatory structure that engages in extensive interactions with pore-forming domains. High-resolution structures of additional TRP subtypes will no doubt expand on this preliminary list of common and distinct features that account for the great functional diversity of TRP ion channels.
Methods
FSEC screening of TRPA1 species orthologues
10 TRPA1 species orthologues (human, mouse, rat, fruit bat, vampire bat, C. elegans, zebrafish isoform A, zebrafish isoform B, rat snake, rattlesnake) were screened by fluorescence size exclusion chromatography (FSEC) as previously described (Extended Data Figure 1a)50. Briefly, orthologues were subcloned into a pCDNA3.1(+) vector containing an N-terminal EGFP tag. 16 hours after transient transfection in the presence of 3 µM ruthenium red (RR), HEK293 cells were washed with PBS, collected in buffer A (50 mM Tris, 37.5 mM sucrose, 5 mM EDTA, 1 mM β-mercaptoethanol, 1 mM phytic acid (inositol hexakisphosphate, IP6, Sigma), 1× complete protease inhibitor cocktail (PIC, Roche), pH 7.5) and lysed by sonication on ice. Cell debris was cleared by centrifugation (8000 g × 20 min) at 4°C and membrane pellets were collected by ultracentrifugation (100,000 g × 1 h) at 4°C. The resulting pellets were resuspended in buffer B (20 mM HEPES, 150 mM NaCl, 10% glycerol, 1 mM DTT, 1 mM IP6, 1× PIC, pH 8.0) and membranes were solubilized with 10 mM MNG-3 for 1.5 h at 4°C51. Detergent-insoluble material was removed by ultracentrifugation as above and the supernatant was separated on a superose 6 column in buffer C (20 mM HEPES, 150 mM NaCl, 10% glycerol, 1 mM DTT, 1 mM IP6, 0.5 mM MNG-3, pH 8.0). The eluent from the superose 6 column was passed through a Jasco fluorometer (FP-2020 Plus) fitted with a flow cell, as described in the manufacturer’s instructions. The fluorometer settings were: excitation 488nm, emission 509nm. Based on the FSEC screen, the vampire bat TRPA1 orthologue was initially pursued for structural studies, however, this sample did not show sufficient particle homogeneity nor did it retain the ankyrin repeat domain diffuse skirt subsequent to exchange into amphipols. Therefore, the 10 species orthologues were further screened by negative stain imaging of MBP-tagged constructs to identify the human TRPA1 (hTRPA1) orthologue as the most promising target for structural analysis.
Protein expression and purification
TRPA1 species orthologues were subcloned into a pFastBac vector containing a mammalian promoter (PCMV) and an N-terminal MBP tag for baculovirus transduction-based expression in HEK293S GnTi− cells as previously described21. For protein expression, HEK293 GnTi− cells, grown in suspension at 37°C in an orbital shaker, were transduced when cell density reached 1–1.5 × 10⁶ per ml and were supplemented with 3 µM RR. Sodium butyrate was added to the culture 24 h after transduction at a final concentration of 10 mM to boost protein expression. Cells were collected 48 h after transduction and were broken by passing through an emulsifier twice in buffer A. Cell debris was cleared by centrifugation (8000 g × 20 min). Membranes were collected by ultracentrifugation (200,000 g × 1 h) and solubilized in buffer B. Membranes were stored at −80°C or solubilized with 10 mM MNG-3 for 2 h at 4°C. Detergent-insoluble material was removed by ultracentrifugation (30,000 g × 30 min) and the supernatant was mixed with amylose resin (New England Biolabs) for 2 h at 4°C. The resin was washed with buffer D (20 mM HEPES, 150 mM NaCl, 1 mM DTT, 1 mM IP6, pH 8.0) containing 0.5 mM MNG-3 and bound protein was eluted with the same buffer supplemented with 40 mM maltose. For orthologue screening, eluted protein was used directly for negative stain EM imaging (Extended Data Figure 1b). For preparation of samples for cryo-EM analysis, MBP-tagged hTRPA1 was mixed with PMAL-C8 (Affymetrix) at 1:3 (w/w) with gentle agitation overnight at 4°C. Detergent was removed with Bio-Beads SM-2 (Bio-Rad) for 1 h at 4°C, and the beads were subsequently removed over a disposable polyprep column. The eluent was cleared by centrifugation before further purification on a superose 6 column in buffer E (20 mM HEPES, 150 mM NaCl, 1 mM DTT, 1 mM IP6, pH 8.0). The peak corresponding to tetrameric MBP-tagged hTRPA1 was collected for analysis by cryo-EM. Protein was supplemented with 2.5% (v/v) glycerol and mixed with agonist (100 µM allyl isothiocyanate, AITC, Sigma) or antagonists (50 µM HC-030031 and 50 µM A-967079, 2% (v/v) DMSO, Tocris) for 10 min at room temperature prior to applying to grids. In PMAL-C8, purified hTRPA1 remained stable and monodispersed (Extended Data Fig. 1g, 3a, 4a, and 5a). Each subunit of native (untagged) hTRPA1 consists of 1119 residues with a mass of 127.5 KDa. Chemical structures and molecular weights of important compounds used in this study are shown in Extended Data Fig. 9i.
Cell imaging and electrophysiology
16 hours after transient transfection, HEK293 cells were loaded with Fura-2-acetoxymethylester in physiologic Ringer’s buffer (140 mM NaCl, 5 mM KCl, 2 mM CaCl2, 2 mM MgCl2, 10 mM HEPES, pH 7.4) for ratiometric calcium imaging. Activity of hTRPA1 constructs was determined by application of AITC (250µM) and sensitivity to A-967079 was initially examined by application of antagonist (10µM) 1 min prior to AITC addition. The F909T mutant was generated by site-directed mutagenesis with a QuikChange Lightning kit (Agilent). Oocyte recordings were carried out as previously described36. Oocytes were injected with 1 ng cRNA encoding wild type or mutant TRPA1 channels and currents were recorded on the following day. Drugs were applied by superfusion using an AutoMate perfusion system. Currents were first evoked with AITC (200 µM) to obtain maximal response, and then percent inhibition determined by subsequent co-application of AITC with antagonist (Extended Data Fig. 9c – h).
EM data acquisition
The EM data acquisition and processing has been performed as described21. Detergent solubilized MBP-hTRPA1 particles were monodispersed as assessed by negative-stain EM (Extended Data Fig. 1b). Grids for negative-stain EM were prepared following the established protocol52. Specifically, 2.5 µl of purified hTRPA1 was applied to glow-discharged EM grids covered by a thin layer of continuous carbon film and was stained with 0.75% (w/v) uranyl formate. Negatively stained EM grids were imaged on a Tecnai T12 microscope (FEI Company) operated at 120 kV at nominal magnification of 52,000× using a 4k × 4k CCD camera (UltraScan 4000, Gatan), corresponding to a pixel size of 2.02Å on the specimen.
For cryo-EM, 2.5 µl of purified hTRPA1 sample at a concentration of 0.5 mg/ml was applied to a glow discharged Quantifoil holey carbon grid (1.2 µm hole size, 400 mesh), blotted inside a Vitrobot Mark I (FEI Company) using 7s blotting time with 100% humidity, and then plunge-frozen in liquid ethane cooled by liquid nitrogen. Cryo-EM images were collected at liquid nitrogen temperature on a Tecnai TF20 electron microscope (FEI) operated at 200 kV using a CT3500 side entry holder (Gatan), following the low-dose procedure; images were recorded at a nominal magnification of 80,000× using a phosphor scintillator-based TemF816 8K × 8K CMOS camera (TVIPS GmbH), corresponding to a pixel size of 0.9Å per pixel on the specimen. Images were recorded with a defocus in the range from 1.8 to 3.5 µm.
Subsequently, three datasets were collected on TF30 Polara electron microscope (FEI Company) operated at 300 kV, equipped with a K2 Summit direct electron detector camera (Gatan). Images were recorded using super-resolution counting mode following an established protocol53. Specifically, images from TF30 were recorded at a nominal magnification of 31,000×, corresponding to a calibrated physical pixel size of 1.22Å per pixel on the specimen. The dose rate on the camera was set to be 8.2 counts (corresponding to 9.9 electron) per physical pixel per second. The total exposure time was 6 s, leading to a total accumulated dose of 41 electrons per Å2 on the specimen. Each image was fractionated into 30 subframes, each with an accumulation time of 0.2 s per frame. All dose-fractionated cryo-EM images were recorded using a semi-automated acquisition program UCSFImage4 (written by X. Li). Images were recorded with a defocus in a range from 1.5 to 2.8 µm.
Image processing
SamViewer, an interactive image analysis program written in Python, was used for all 2D image display and particle picking. Negative-stain EM images were 2 × 2 binned for manual particle picking. Defocus was determined using CTFFIND354. Individual particles were cut out and normalized to have a mean of 0 and a standard deviation of 1. For 2D classification, particles were first corrected for contrast transfer function (CTF) by flipping the phase using ‘ctfapply’ (written by X. Li), and subject to 6 cycles of correspondence analysis, k-means classification and multi-reference alignment (MRA), using SPIDER operations ‘CA S’, ‘CL KM’ and ‘AP SH’55.
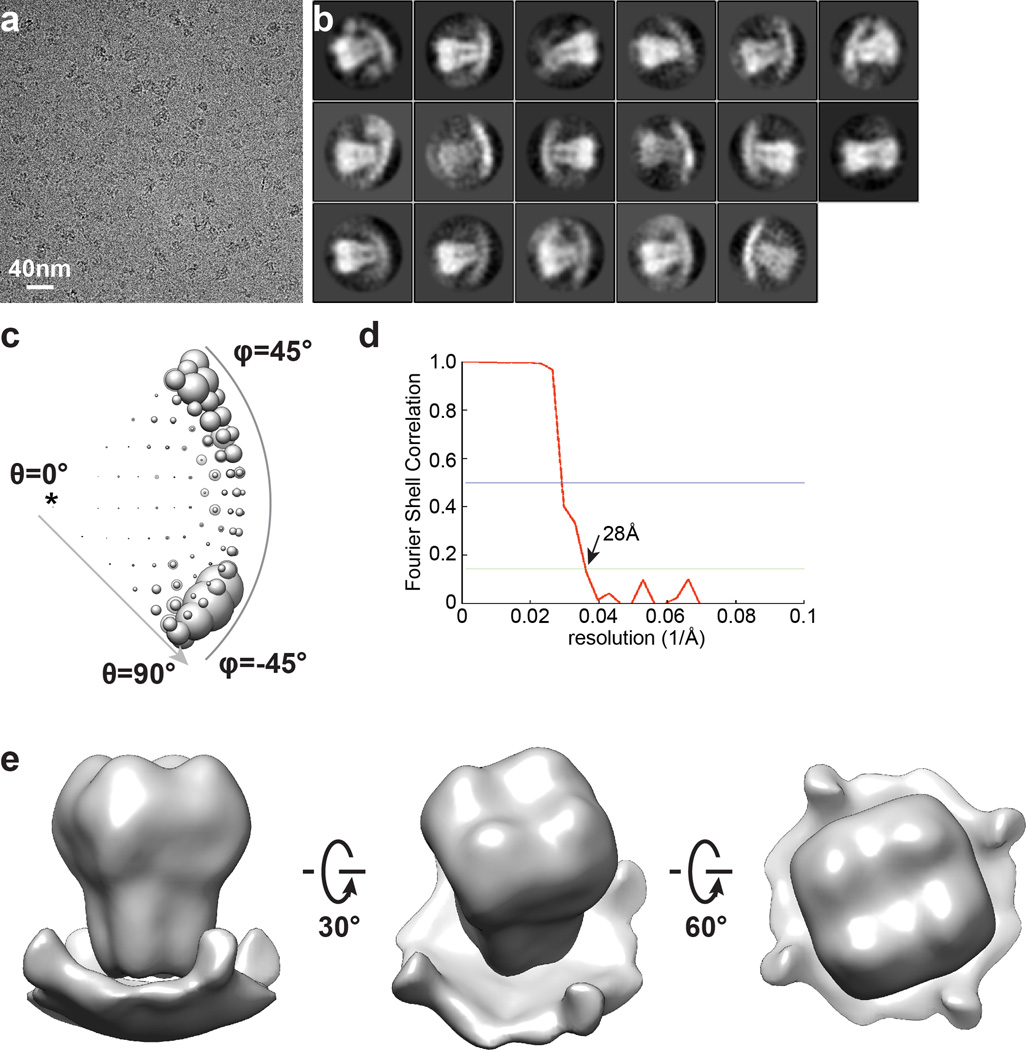
Low-dose images of frozen hydrated MBP-hTRPA1 collected on TF20 were binned 2×2, resulting in a pixel size of 1.89Å for image processing. For particle picking, images were further 2×2 binned to a pixel size of 3.8Å. An ab initio 3D reconstruction was first determined using the TF20 dataset, using a probabilistic initial 3D model generation procedure (PRIME) implemented in Simple package56. This reconstruction served as an initial reference model for subsequent maximum likelihood-based 3D classification and auto-refinement procedure implemented in RELION57. The final 3D reconstruction with C4 symmetry was determined to an overall resolution of 27 Å using gold-standard refinement procedure (Extended Data Fig. 2).
Dose fractionated super-resolution image stacks of frozen, hydrated MBP-hTRPA1 images collected using K2 Summit camera were first binned 2×2 resulting in a pixel size of 1.22Å for motion correction and further image processing. Each image stack was subjected to whole frame motion correction53, and a sum of all subframes in each image stack was used for further processing. Particle picking was performed using a previously described procedure implemented in a Python script 'samautopick.py'. 2D class averages generated from manually picked particles were used as initial reference. All picked particles were then screened visually and bad particles identified in the visual screening were removed interactively. The selected particles were further screened by a reference-free 2D classification. The 28Å resolution 3D reconstruction was low-pass filtered to a resolution of 60Å, and used as the initial reference model for the 3D classification procedure using RELION. Stable classes were then iteratively refined and reclassified to obtain the most homogeneous subset for the final 3D reconstruction. All refinements follow the gold-standard refinement procedure, in which the dataset was divided into two half sets, and refined independently. Once the refinement is converged, the final dataset was subjected to a movie processing and particle polishing procedure implemented in RELION58. A mask is generated to remove unstructured densities, such as those corresponding to the crescent and PMAL-C8, before calculating the final Fourier Shell Correlation (FSC) curve. The final resolutions were estimated using the FSC = 0.143 criterion59 on corrected FSC curves in which the influences of the mask were removed. Local resolution was estimated from unbinned and unsharpened raw density map using ResMap60 within the RELION suite. The initial and final number of particles, as well as resolution for each datasets is reported in Extended Data Table 1.
Model building and refinement
For ab initio model building in COOT61, maps amplified with different negative temperature factors were used. Atomic model building was carried out mostly using the AITC-treated cryo-EM map and cross-validated with the single and double antagonists-treated cryo-EM maps. For the transmembrane domain, a homology model generated with HHPred62 based on TRPV1 (PDB code: 3J5P21) was placed into the cryo-EM density map as a placeholder. For the ankyrin repeat domain, we first generated sequence-based homology models of individual ankyrin repeats using secondary structure predictions63, repeat prediction servers64 and available literature65. These homology models were placed into the density map based on their position in the sequence, starting from the most C-terminal repeat. A total of 5 ankyrin repeats were properly placed into the well-resolved density of the ankyrin repeat domain. Connections between these fitted ankyrin repeats were then built into the densities. For the remaining density, including the coiled-coil domain, linker between the last ankyrin repeat and the S1 helix, a poly-alanine model was first built and amino acid assignment to the poly-alanine model was then achieved based mainly on the clearly defined side chains densities of bulky residues. The entire model was then manually adjusted to fit the densities. Connectivity and side chain rotamer positions were cross-validated using the two other maps. Clear densities were observed for residues 664–679, 748–763 and 786–802, but the resolutions of these domains are insufficient for atomic model building. The connection between the TRP-like domain and the coiled-coil domain is only partially resolved. At low σ isosurface, weak densities were seen to link the TRP-like domain to a short helical-like density in the inner leaflet of the membrane (Extended Data Fig. 7b) and then to the coiled-coil domain. We did not attempt to build a model for this linker region. The ~30 remaining most C-terminal residues were not resolved, probably forming part of the crescent density. The first 444 amino acids could not be modeled into the crescent density. Sequence-based prediction identified at least 11 additional ankyrin repeats. A speculative model was built by positioning a sequence based homology model of 11 ankyrin repeats symmetrically into the crescent density (Extended Data Fig. 8e).
Following the initial model building and local energy minimization, the entire model was subject to reciprocal space refinement. Amplitudes of the final density map were corrected by a frequency-dependent scaling factor determined by comparing the experimental maps with a reference map calculated from the model66, using a program ‘ampcorr’ written by X. Li. A soft-edged mask was generated based on the built atomic model to mask out densities of PMAL-C8, N-terminal crescent density, and other parts where model building was not attempted. The masked maps were put into an artificial unit cell with P1 symmetry and converted to MTZ format using CCP4 program sftools67. The resulting reflection files were used to perform maximum likelihood refinement using PHENIX68 with secondary structure restraints, reference model restraints, and automatic optimization of experimental/stereochemistry weights. The reference model was generated from the built models using the geometry minimization function in PHENIX. The refined atomic model was further visualized in COOT. A few residues with side chain moving out of the density during the refinement were fixed manually, followed by further refinement following the same procedure. The final structure was validated using MolProbity69.
For cross-validation to prevent overfitting, we followed procedures as previously described70. Briefly, the coordinates of the refined atomic structures were displaced randomly by 0.2Å using PHENIX (PDB Tools) to remove potential model bias. The displaced model was then refined against one of the half maps in reciprocal space. FSC curves were calculated between the resulting model and half map 1 (“work”, i.e., used for refinement), the resulting model and half map 2 (“free”, i.e., not used for refinement), and the resulting model and the summed map (Extended Data Figure 6). There is no significant separation between “work” and “free” FSC curves suggesting that the model was not overfitted. The final model exhibits good geometry and all refinement parameters are listed in Extended Data Figure 6.
Figures were prepared using UCSF Chimera71, residue interactions were assigned with a 5Å cutoff, and pore radii were calculated using the HOLE program72.
Extended Data
Extended Data Figure 1. Pre-cryo-EM screening of TRPA1 species orthologues and purification of hTRPA1.
a, FSEC traces from EGFP-TRPA1 fusion proteins. Void volume and peak corresponding to tetrameric channels are indicated. b, Representative section of negative stain micrographs showing typical structure of tetrameric MBP-tagged TRPA1 from various species, as indicated (text color matches traces in panel a). Particles from species orthologes exhibited highly similar shapes, except rattlesnake TRPA1, which were not homogenous and tended to aggregate. The human TRPA1 orthologue was chosen after negative stain screening due to exemplary homogeneity of individual particles. c, Cartoon diagram of MBP-tagged construct used for single-particle cryo-EM studies. d, MBP-tagged hTRPA1 construct is active when transduced in HEK293T cells as assessed by calcium imaging (scale bar indicates relative calcium levels: low, blue to high, red). e, Gel filtration profile (Superose 6) of MBP-tagged human TRPA1 after detergent solubilization, purification on amylose affinity resin, followed by exchange into PMAL-C8. Peaks correspond to void (1), tetrameric MBP-hTRPA1 (2), and excess PMAL-C8 (3). f, Material from peak 2 migrates as a single, homogenous band (173 kDa) on SDS-PAGE (4–12% gradient gel, Coomassie stain). g, PMAL-C8-stabilized MBP-hTRPA1 appears as homogenous particles with a clear crescent density by negative stain imaging.
Extended Data Figure 2. Initial single-particle cryo-EM study of hTRPA1.
a, Raw micrograph of MBP-hTRPA1 recorded using a scintillator-based CMOS camera. b, 2D class averages of MBP-hTRPA1 particles. c, Euler angle distribution of initial 3D reconstruction. d, FSC curve of final 3D reconstruction. e, Final 3D reconstruction of MBP-hTRPA1 at 28Å resolution. This 3D reconstruction was used as the initial model for subsequent cryo-EM studies of hTRPA1 using a direct electron detection camera.
Extended Data Figure 3. Single-particle cryo-EM studies of hTRPA1 with agonist (AITC).
a, Raw micrograph of MBP-hTRPA1 with agonist (AITC) recorded using K2 Summit operated in super-resolution counting mode. b, Gallery of 2D class averages. c, Euler angle distribution of all particles included in calculating the final 3D reconstruction. The size of the ball is proportional to the number of particles in this specific orientation. d, Selected slice views of the unsharpened 3D density map. The views are oriented in parallel with the membrane plane. The numbers of slices are marked. e, Two views of hTRPA1 density map filtered to 6Å resolution and displayed in two different isosurface levels (high in yellow and low in gray). At low isosurface level, density contributed by PMAL-C8 is visible. f, FSC curves between two independently refined half maps (red) and between the final combined density map and the map calculated from atomic model (blue). g, Voxel histogram corresponding to local resolution. There are significant numbers of voxels with higher than 4Å local resolution. h, Final 3D reconstruction colored with local resolution. i, Cryo-EM densities of the S4, S4–S5 linker, pore helices, S6, TRP-like domain, and coiled-coil in longitudinal cross sections are superimposed on an atomic model. Only two diagonally opposed subunits are shown for clarity. Dashed ovals indicate regions highlighted at sides.
Extended Data Figure 4. Single-particle cryo-EM studies of hTRPA1 with antagonist (HC-030031).
a, Raw micrograph of MBP-hTRPA1 with single antagonist HC-030031 recorded using K2 Summit operated in super-resolution counting mode. b, Gallery of 2D class averages. c, Euler angle distribution of all particles included in calculating the final 3D reconstruction. The size of the ball is proportional to the number of particles in this specific orientation. d, FSC curve between two independently refined half maps. e, Three different views of the final density map. f, Voxel histogram corresponding to local resolution. g, Final 3D reconstruction colored with local resolution.
Extended Data Figure 5. Single-particle cryo-EM studies of hTRPA1 with double antagonist (HC-030031 and A-967079).
a, Raw micrograph of MBP-hTRPA1 with double antagonists recorded using K2 Summit operated in super-resolution counting mode. b, Gallery of 2D class averages. c, Euler angle distribution of all particles included in calculating the final 3D reconstruction. The size of the ball is proportional to the number of particles in this specific orientation. d, FSC curve between two independently refined half maps. e, Three different views of the final density map. f, Voxel histogram corresponding to local resolution. g, Final 3D reconstruction colored with local resolution.
Extended Data Figure 6. Refinement of de novo atomic model of hTRPA1 determined from cryo-EM density maps.
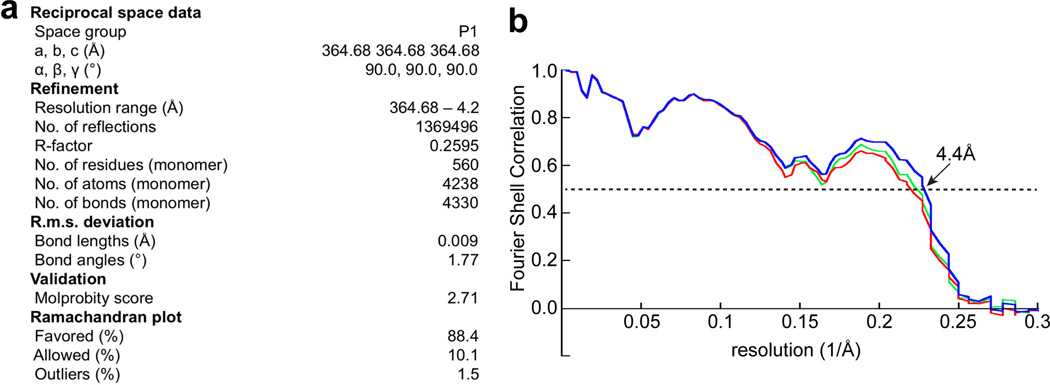
a. Statistics of atomic model refinement. b. FSC curves between the density map calculated from the refined model and half map 1 (work, green curve), half map 2 (free, red curve) and summed map (blue).
Extended Data Figure 7. Detailed views of unique structural features in hTRPA1.
a, Density map showing the location of a poorly-resolved α-helix within the S1–S2 linker that extends into the extracellular space. b, Density map and α-carbon trace for an α-helix in the inner membrane leaflet located within a flexible loop connecting the third β-strand to the C-terminal coiled-coil. c Cross section of the density map corresponding to Fig. 3d. d, Cross section of the density map corresponding to Fig. 3c. IP6 density is depicted in orange. e, Size of the density corresponding to IP6 (yellow) is consistent with an IP6 molecule. f and g, Cryo-EM densities of D915 (f), and I957 and V961 (g) along the pore are superimposed on the atomic model; both panels represent views along the four-fold axis, showing residues from each subunit of the homotetrameric channel. h and i, Density maps and ribbon diagrams of atomic models showing the location of F909 in AITC (h) and double antagonist (i) samples. Density of A-967079 is indicated in the latter. j, Size of the density corresponding to A-967079 (yellow) is consistent with a A-967079 molecule. The resolution of these ligand densities (>6Å) is insufficient to propose a precise model for ligand binding. The positioning of coordinates for ligands represents only the scale-context and does not present any proposed mode of interaction with the channel.
Extended Data Figure 8. Distal N-terminus contains an ankyrin repeat-rich region that forms a crescent-shaped density surrounding the main body of the particle.
a, Sequence alignment indicates that the N-terminus of hTRPA1 contains at least 16 ARs. The last five can be modeled into all hTRPA1 density maps. b, 2D class averages of negatively stained MBP-hTRPA1 in PMAL-C8. c, Three selected 2D class averages indicating dimension of the crescent-shaped density. d, A homology model for the first 11 predicted ARs spanning a dimension of ~100Å, suggesting that the crescent-shaped density can accommodate at least 11 ARs. e and f, Two models for the extended ARs are superimposed on the hTRPA1 core atomic model determined by single-particle cryo-EM. Resolution of the crescent is insufficient to confidently determine extended ARD orientation, but which could assemble as a propeller (e) or independent wings (f). Based on the concerted movement of the crescent density in distinct negative stain particles (b), we favor a propeller orientation.
Extended Data Figure 9. Characterization of F909T hTRPA1 sensitivity to A-967079.
a and b, Ratiometric calcium imaging of HEK293 cells transiently transfected with wild-type (a) or F909T mutant (b) hTRPA1. Cells were stimulated with AITC (250µM) with (right) or without (left) pre-application of A-967079 (10µM). c – h, Representative recordings from oocytes expressing wild-type (c – e) or F909T mutant (f – h) hTRPA1 activated with AITC (200 µM) prior to co-application of A-967079 (10 µM) (c and f), HC-030031 (100 µM) (d and g), or ruthenium red (10 µM) (e and h). i, Chemical structures and molecular weights of compounds used in this study.
Extended Data Table 1. Summary of hTRA1 structure determinations by single particle cryo-EM.
We determined three structures of hTRA1 in complexes with agonist (AITC) and antagonists (HC-030031 ± A-967079). 200kV data was collected on a phosphor scintillator based CMOS camera. All other datasets were collected using a K2 Summit direct electron detection camera.
| hTRPA1 | hTRPA1 – AITC | hTRPA1 – HC03031+A967079 |
hTRPA1 – HC03031 |
|
|---|---|---|---|---|
| Voltage (kV) | 200 | 300 | 300 | 300 |
| Magnification | 80000 | 31000 | 31000 | 31000 |
| Defocus range (µm) | 1.8–3.5 | 1.5–2.8 | 1.5–2.8 | 1.5–2.8 |
| Electron dose (e−/Å2) | 25 | 41 | 41 | 41 |
| Pixel size (Å) | 3.7821 | 1.2156 | 1.2156 | 1.2156 |
| Image size (px) | 2048 × 2048 | 3838 × 3710 | 3838 × 3710 | 3838 × 3710 |
| Number of images | 110 | 1160 | 708 | 810 |
| Number of frames per image | - | 30 | 30 | 30 |
| Particle box (px) | 80 | 300 | 300 | 300 |
| Initial particle number | 28856 | 232500 | 106050 | 122653 |
| Final particle number / % | 4874 / 16.9 % | 43585 / 18.7 % | 20733 / 19.6% | 21930 / 17.9 % |
| Resolution (Å) | 28 | 4.24 | 3.92129 | 4.675 |
| Accuracy rotations | 6.71 | 1.412 | 1.42 | 1.876 |
| Accuracy translations | 1.337 | 0.606 | 0.602 | 0.763 |
Acknowledgements
We thank Maofu Liao for initial EM analysis of vampire bat TRPA1, and Shenping Wu and Minglei Zhao for help with refining the atomic model. This work was supported by grants from the National Institutes of Health (R01NS055299 to D. J. and R01GM098672 to Y.C.) and the UCSF Program for Breakthrough Biomedical Research (Y.C.). C.E.P. was supported by a T32 Postdoctoral Training Grant from the UCSF CVRI, and is currently a HHMI Fellow of the Helen Hay Whitney Foundation.
Footnotes
Author Contributions
C.E.P. expressed and purified protein samples, determined conditions to enhance protein stability, and performed functional studies. Y.G. carried out initial negative stain analysis and characterization of cryo-EM conditions. J-P.A. carried out detailed cryo-EM experiments, including data acquisition and processing. C.E.P. and J-P.A. built the atomic model on the basis of cryo-EM maps. All authors contributed to experimental design, data analysis, and manuscript preparation.
3D cryo-EM density map of TRPA1 complexes without low-pass filter and amplitude modification have been deposited in the Electron Microscopy Data Bank under the accession number EMD-6267 (TRPA1-AITC), EMD-6268 (TRPA1-HC030031/A967079) and EMD-6269 (TRPA1-HC030031). Particle images related to this entry are available for download at http://www.ebi.ac.uk/pdbe/emdb/empiar/ with identification no. EMPIAR-10024. Coordinates for the atomic model of TRPA1 have been deposited in the Protein Data Bank under the accession number 3J9P.
The authors declare no competing financial interests.
References
- 1.Julius D. TRP channels and pain. Annu Rev Cell Dev Biol. 2013;29:355–384. doi: 10.1146/annurev-cellbio-101011-155833. [DOI] [PubMed] [Google Scholar]
- 2.Wang H, Woolf CJ. Pain TRPs. Neuron. 2005;46:9–12. doi: 10.1016/j.neuron.2005.03.011. [DOI] [PubMed] [Google Scholar]
- 3.Bandell M, et al. Noxious cold ion channel TRPA1 is activated by pungent compounds and bradykinin. Neuron. 2004;41:849–857. doi: 10.1016/s0896-6273(04)00150-3. [DOI] [PubMed] [Google Scholar]
- 4.Bautista DM, et al. TRPA1 mediates the inflammatory actions of environmental irritants and proalgesic agents. Cell. 2006;124:1269–1282. doi: 10.1016/j.cell.2006.02.023. [DOI] [PubMed] [Google Scholar]
- 5.Bautista DM, et al. Pungent products from garlic activate the sensory ion channel TRPA1. Proc Natl Acad Sci U S A. 2005;102:12248–12252. doi: 10.1073/pnas.0505356102. [DOI] [PMC free article] [PubMed] [Google Scholar]
- 6.Jordt SE, et al. Mustard oils and cannabinoids excite sensory nerve fibres through the TRP channel ANKTM1. Nature. 2004;427:260–265. doi: 10.1038/nature02282. [DOI] [PubMed] [Google Scholar]
- 7.McNamara CR, et al. TRPA1 mediates formalin-induced pain. Proc Natl Acad Sci U S A. 2007;104:13525–13530. doi: 10.1073/pnas.0705924104. [DOI] [PMC free article] [PubMed] [Google Scholar]
- 8.Taylor-Clark TE, et al. Prostaglandin-induced activation of nociceptive neurons via direct interaction with transient receptor potential A1 (TRPA1) Mol Pharmacol. 2008;73:274–281. doi: 10.1124/mol.107.040832. [DOI] [PubMed] [Google Scholar]
- 9.Trevisani M, et al. 4-Hydroxynonenal, an endogenous aldehyde, causes pain and neurogenic inflammation through activation of the irritant receptor TRPA1. Proc Natl Acad Sci U S A. 2007;104:13519–13524. doi: 10.1073/pnas.0705923104. [DOI] [PMC free article] [PubMed] [Google Scholar]
- 10.Caspani O, Heppenstall PA. TRPA1 and cold transduction: an unresolved issue? J Gen Physiol. 2009;133:245–249. doi: 10.1085/jgp.200810136. [DOI] [PMC free article] [PubMed] [Google Scholar]
- 11.Wilson SR, et al. TRPA1 is required for histamine-independent, Mas-related G protein-coupled receptor-mediated itch. Nat Neurosci. 2011;14:595–602. doi: 10.1038/nn.2789. [DOI] [PMC free article] [PubMed] [Google Scholar]
- 12.Andrade EL, Meotti FC, Calixto JB. TRPA1 antagonists as potential analgesic drugs. Pharmacol Ther. 2012;133:189–204. doi: 10.1016/j.pharmthera.2011.10.008. [DOI] [PubMed] [Google Scholar]
- 13.Kremeyer B, et al. A gain-of-function mutation in TRPA1 causes familial episodic pain syndrome. Neuron. 2010;66:671–680. doi: 10.1016/j.neuron.2010.04.030. [DOI] [PMC free article] [PubMed] [Google Scholar]
- 14.Hinman A, Chuang HH, Bautista DM, Julius D. TRP channel activation by reversible covalent modification. Proc Natl Acad Sci U S A. 2006;103:19564–19568. doi: 10.1073/pnas.0609598103. [DOI] [PMC free article] [PubMed] [Google Scholar]
- 15.Macpherson LJ, et al. Noxious compounds activate TRPA1 ion channels through covalent modification of cysteines. Nature. 2007;445:541–545. doi: 10.1038/nature05544. [DOI] [PubMed] [Google Scholar]
- 16.Kim D, Cavanaugh EJ. Requirement of a soluble intracellular factor for activation of transient receptor potential A1 by pungent chemicals: role of inorganic polyphosphates. J Neurosci. 2007;27:6500–6509. doi: 10.1523/JNEUROSCI.0623-07.2007. [DOI] [PMC free article] [PubMed] [Google Scholar]
- 17.Nilius B, Prenen J, Owsianik G. Irritating channels: the case of TRPA1. J Physiol. 2011;589:1543–1549. doi: 10.1113/jphysiol.2010.200717. [DOI] [PMC free article] [PubMed] [Google Scholar]
- 18.Wang YY, Chang RB, Waters HN, McKemy DD, Liman ER. The nociceptor ion channel TRPA1 is potentiated and inactivated by permeating calcium ions. J Biol Chem. 2008;283:32691–32703. doi: 10.1074/jbc.M803568200. [DOI] [PMC free article] [PubMed] [Google Scholar]
- 19.Cvetkov TL, Huynh KW, Cohen MR, Moiseenkova-Bell VY. Molecular architecture and subunit organization of TRPA1 ion channel revealed by electron microscopy. J Biol Chem. 2011;286:38168–38176. doi: 10.1074/jbc.M111.288993. [DOI] [PMC free article] [PubMed] [Google Scholar]
- 20.Cao E, Liao M, Cheng Y, Julius D. TRPV1 structures in distinct conformations reveal activation mechanisms. Nature. 2013;504:113–118. doi: 10.1038/nature12823. [DOI] [PMC free article] [PubMed] [Google Scholar]
- 21.Liao M, Cao E, Julius D, Cheng Y. Structure of the TRPV1 ion channel determined by electron cryo-microscopy. Nature. 2013;504:107–112. doi: 10.1038/nature12822. [DOI] [PMC free article] [PubMed] [Google Scholar]
- 22.Samad A, et al. The C-terminal basic residues contribute to the chemical- and voltage-dependent activation of TRPA1. Biochem J. 2011;433:197–204. doi: 10.1042/BJ20101256. [DOI] [PMC free article] [PubMed] [Google Scholar]
- 23.Woolfson DN. The design of coiled-coil structures and assemblies. Adv Protein Chem. 2005;70:79–112. doi: 10.1016/S0065-3233(05)70004-8. [DOI] [PubMed] [Google Scholar]
- 24.Macbeth MR, et al. Inositol hexakisphosphate is bound in the ADAR2 core and required for RNA editing. Science. 2005;309:1534–1539. doi: 10.1126/science.1113150. [DOI] [PMC free article] [PubMed] [Google Scholar]
- 25.Gray MJ, et al. Polyphosphate is a primordial chaperone. Mol Cell. 2014;53:689–699. doi: 10.1016/j.molcel.2014.01.012. [DOI] [PMC free article] [PubMed] [Google Scholar]
- 26.Rohacs T. Phosphoinositide regulation of TRP channels. Handb Exp Pharmacol. 2014;223:1143–1176. doi: 10.1007/978-3-319-05161-1_18. [DOI] [PMC free article] [PubMed] [Google Scholar]
- 27.Paulsen CE, Carroll KS. Cysteine-mediated redox signaling: chemistry, biology, and tools for discovery. Chem Rev. 2013;113:4633–4679. doi: 10.1021/cr300163e. [DOI] [PMC free article] [PubMed] [Google Scholar]
- 28.Chen J, et al. Molecular determinants of species-specific activation or blockade of TRPA1 channels. J Neurosci. 2008;28:5063–5071. doi: 10.1523/JNEUROSCI.0047-08.2008. [DOI] [PMC free article] [PubMed] [Google Scholar]
- 29.Moparthi L, et al. Human TRPA1 is intrinsically cold- and chemosensitive with and without its N-terminal ankyrin repeat domain. Proc Natl Acad Sci U S A. 2014;111:16901–16906. doi: 10.1073/pnas.1412689111. [DOI] [PMC free article] [PubMed] [Google Scholar]
- 30.Jaquemar D, Schenker T, Trueb B. An ankyrin-like protein with transmembrane domains is specifically lost after oncogenic transformation of human fibroblasts. J Biol Chem. 1999;274:7325–7333. doi: 10.1074/jbc.274.11.7325. [DOI] [PubMed] [Google Scholar]
- 31.Zayats V, et al. Regulation of the transient receptor potential channel TRPA1 by its N-terminal ankyrin repeat domain. J Mol Model. 2013;19:4689–4700. doi: 10.1007/s00894-012-1505-1. [DOI] [PubMed] [Google Scholar]
- 32.Gracheva EO, et al. Molecular basis of infrared detection by snakes. Nature. 2010;464:1006–1011. doi: 10.1038/nature08943. [DOI] [PMC free article] [PubMed] [Google Scholar]
- 33.Sokabe T, Tsujiuchi S, Kadowaki T, Tominaga M. Drosophila painless is a Ca2+-requiring channel activated by noxious heat. J Neurosci. 2008;28:9929–9938. doi: 10.1523/JNEUROSCI.2757-08.2008. [DOI] [PMC free article] [PubMed] [Google Scholar]
- 34.Viswanath V, et al. Opposite thermosensor in fruitfly and mouse. Nature. 2003;423:822–823. doi: 10.1038/423822a. [DOI] [PubMed] [Google Scholar]
- 35.Zhong L, et al. Thermosensory and nonthermosensory isoforms of Drosophila melanogaster TRPA1 reveal heat-sensor domains of a thermoTRP Channel. Cell Rep. 2012;1:43–55. doi: 10.1016/j.celrep.2011.11.002. [DOI] [PMC free article] [PubMed] [Google Scholar]
- 36.Cordero-Morales JF, Gracheva EO, Julius D. Cytoplasmic ankyrin repeats of transient receptor potential A1 (TRPA1) dictate sensitivity to thermal and chemical stimuli. Proc Natl Acad Sci U S A. 2011;108:E1184–E1191. doi: 10.1073/pnas.1114124108. [DOI] [PMC free article] [PubMed] [Google Scholar]
- 37.Jabba S, et al. Directionality of temperature activation in mouse TRPA1 ion channel can be inverted by single-point mutations in ankyrin repeat six. Neuron. 2014;82:1017–1031. doi: 10.1016/j.neuron.2014.04.016. [DOI] [PMC free article] [PubMed] [Google Scholar]
- 38.Payandeh J, Scheuer T, Zheng N, Catterall WA. The crystal structure of a voltage-gated sodium channel. Nature. 2011;475:353–358. doi: 10.1038/nature10238. [DOI] [PMC free article] [PubMed] [Google Scholar]
- 39.Long SB, Campbell EB, Mackinnon R. Crystal structure of a mammalian voltage-dependent Shaker family K+ channel. Science. 2005;309:897–903. doi: 10.1126/science.1116269. [DOI] [PubMed] [Google Scholar]
- 40.Susankova K, Ettrich R, Vyklicky L, Teisinger J, Vlachova V. Contribution of the putative inner-pore region to the gating of the transient receptor potential vanilloid subtype 1 channel (TRPV1) J Neurosci. 2007;27:7578–7585. doi: 10.1523/JNEUROSCI.1956-07.2007. [DOI] [PMC free article] [PubMed] [Google Scholar]
- 41.Voets T, Janssens A, Droogmans G, Nilius B. Outer pore architecture of a Ca2+-selective TRP channel. J Biol Chem. 2004;279:15223–15230. doi: 10.1074/jbc.M312076200. [DOI] [PubMed] [Google Scholar]
- 42.McGaraughty S, et al. TRPA1 modulation of spontaneous and mechanically evoked firing of spinal neurons in uninjured, osteoarthritic, and inflamed rats. Mol Pain. 2010;6:14. doi: 10.1186/1744-8069-6-14. [DOI] [PMC free article] [PubMed] [Google Scholar]
- 43.Petrus M, et al. A role of TRPA1 in mechanical hyperalgesia is revealed by pharmacological inhibition. Mol Pain. 2007;3:40. doi: 10.1186/1744-8069-3-40. [DOI] [PMC free article] [PubMed] [Google Scholar]
- 44.Banzawa N, et al. Molecular Basis Determining Inhibition/Activation of Nociceptive Receptor TRPA1: A Single Amino Acid Dictates Species-specific Actions of the Most Potent Mammalian TRPA1 Antagonists. J Biol Chem. 2014 doi: 10.1074/jbc.M114.586891. [DOI] [PMC free article] [PubMed] [Google Scholar]
- 45.Klement G, et al. Characterization of a ligand binding site in the human transient receptor potential ankyrin 1 pore. Biophys J. 2013;104:798–806. doi: 10.1016/j.bpj.2013.01.008. [DOI] [PMC free article] [PubMed] [Google Scholar]
- 46.Nakatsuka K, et al. Identification of molecular determinants for a potent mammalian TRPA1 antagonist by utilizing species differences. J Mol Neurosci. 2013;51:754–762. doi: 10.1007/s12031-013-0060-2. [DOI] [PubMed] [Google Scholar]
- 47.Xiao B, et al. Identification of transmembrane domain 5 as a critical molecular determinant of menthol sensitivity in mammalian TRPA1 channels. J Neurosci. 2008;28:9640–9651. doi: 10.1523/JNEUROSCI.2772-08.2008. [DOI] [PMC free article] [PubMed] [Google Scholar]
- 48.Bagneris C, et al. Prokaryotic NavMs channel as a structural and functional model for eukaryotic sodium channel antagonism. Proc Natl Acad Sci U S A. 2014;111:8428–8433. doi: 10.1073/pnas.1406855111. [DOI] [PMC free article] [PubMed] [Google Scholar]
- 49.Catterall WA. Structure and function of voltage-gated sodium channels at atomic resolution. Exp Physiol. 2014;99:35–51. doi: 10.1113/expphysiol.2013.071969. [DOI] [PMC free article] [PubMed] [Google Scholar]
Methods references
- 50.Kawate T, Gouaux E. Fluorescence-detection size-exclusion chromatography for precrystallization screening of integral membrane proteins. Structure. 2006;14:673–681. doi: 10.1016/j.str.2006.01.013. [DOI] [PubMed] [Google Scholar]
- 51.Chae PS, et al. Maltose-neopentyl glycol (MNG) amphiphiles for solubilization, stabilization and crystallization of membrane proteins. Nat Methods. 2010;7:1003–1008. doi: 10.1038/nmeth.1526. [DOI] [PMC free article] [PubMed] [Google Scholar]
- 52.Ohi M, Li Y, Cheng Y, Walz T. Negative Staining and Image Classification - Powerful Tools in Modern Electron Microscopy. Biol Proced Online. 2004;6:23–34. doi: 10.1251/bpo70. [DOI] [PMC free article] [PubMed] [Google Scholar]
- 53.Li X, et al. Electron counting and beam-induced motion correction enable near-atomic-resolution single-particle cryo-EM. Nat Methods. 2013;10:584–590. doi: 10.1038/nmeth.2472. [DOI] [PMC free article] [PubMed] [Google Scholar]
- 54.Mindell JA, Grigorieff N. Accurate determination of local defocus and specimen tilt in electron microscopy. J Struct Biol. 2003;142:334–347. doi: 10.1016/s1047-8477(03)00069-8. [DOI] [PubMed] [Google Scholar]
- 55.Frank J, et al. SPIDER and WEB: processing and visualization of images in 3D electron microscopy and related fields. J Struct Biol. 1996;116:190–199. doi: 10.1006/jsbi.1996.0030. [DOI] [PubMed] [Google Scholar]
- 56.Elmlund H, Elmlund D, Bengio S. PRIME: probabilistic initial 3D model generation for single-particle cryo-electron microscopy. Structure. 2013;21:1299–1306. doi: 10.1016/j.str.2013.07.002. [DOI] [PubMed] [Google Scholar]
- 57.Scheres SH. RELION: implementation of a Bayesian approach to cryo-EM structure determination. J Struct Biol. 2012;180:519–530. doi: 10.1016/j.jsb.2012.09.006. [DOI] [PMC free article] [PubMed] [Google Scholar]
- 58.Scheres SH. Beam-induced motion correction for sub-megadalton cryo-EM particles. Elife. 2014;3:e03665. doi: 10.7554/eLife.03665. [DOI] [PMC free article] [PubMed] [Google Scholar]
- 59.Scheres SH, Chen S. Prevention of overfitting in cryo-EM structure determination. Nat Methods. 2012;9:853–854. doi: 10.1038/nmeth.2115. [DOI] [PMC free article] [PubMed] [Google Scholar]
- 60.Kucukelbir A, Sigworth FJ, Tagare HD. Quantifying the local resolution of cryo-EM density maps. Nat Methods. 2014;11:63–65. doi: 10.1038/nmeth.2727. [DOI] [PMC free article] [PubMed] [Google Scholar]
- 61.Emsley P, Lohkamp B, Scott WG, Cowtan K. Features and development of Coot. Acta Crystallogr D Biol Crystallogr. 2010;66:486–501. doi: 10.1107/S0907444910007493. [DOI] [PMC free article] [PubMed] [Google Scholar]
- 62.Soding J, Biegert A, Lupas AN. The HHpred interactive server for protein homology detection and structure prediction. Nucleic Acids Res. 2005;33:W244–W248. doi: 10.1093/nar/gki408. [DOI] [PMC free article] [PubMed] [Google Scholar]
- 63.Jones DT. Protein secondary structure prediction based on position-specific scoring matrices. J Mol Biol. 1999;292:195–202. doi: 10.1006/jmbi.1999.3091. [DOI] [PubMed] [Google Scholar]
- 64.Gruber M, Soding J, Lupas AN. REPPER--repeats and their periodicities in fibrous proteins. Nucleic Acids Res. 2005;33:W239–W243. doi: 10.1093/nar/gki405. [DOI] [PMC free article] [PubMed] [Google Scholar]
- 65.Gaudet R. A primer on ankyrin repeat function in TRP channels and beyond. Mol Biosyst. 2008;4:372–379. doi: 10.1039/b801481g. [DOI] [PMC free article] [PubMed] [Google Scholar]
- 66.Penczek P, Ban N, Grassucci RA, Agrawal RK, Frank J. Haloarcula marismortui 50S subunit-complementarity of electron microscopy and X-Ray crystallographic information. J Struct Biol. 1999;128:44–50. doi: 10.1006/jsbi.1999.4157. [DOI] [PubMed] [Google Scholar]
- 67.Winn MD, et al. Overview of the CCP4 suite and current developments. Acta Crystallogr D Biol Crystallogr. 2011;67:235–242. doi: 10.1107/S0907444910045749. [DOI] [PMC free article] [PubMed] [Google Scholar]
- 68.Adams PD, et al. PHENIX: a comprehensive Python-based system for macromolecular structure solution. Acta Crystallogr D Biol Crystallogr. 2010;66:213–221. doi: 10.1107/S0907444909052925. [DOI] [PMC free article] [PubMed] [Google Scholar]
- 69.Chen VB, et al. MolProbity: all-atom structure validation for macromolecular crystallography. Acta Crystallogr D Biol Crystallogr. 2010;66:12–21. doi: 10.1107/S0907444909042073. [DOI] [PMC free article] [PubMed] [Google Scholar]
- 70.Amunts A, et al. Structure of the yeast mitochondrial large ribosomal subunit. Science. 2014;343:1485–1489. doi: 10.1126/science.1249410. [DOI] [PMC free article] [PubMed] [Google Scholar]
- 71.Pettersen EF, et al. UCSF Chimera--a visualization system for exploratory research and analysis. J Comput Chem. 2004;25:1605–1612. doi: 10.1002/jcc.20084. [DOI] [PubMed] [Google Scholar]
- 72.Smart OS, Neduvelil JG, Wang X, Wallace BA, Sansom MS. HOLE: a program for the analysis of the pore dimensions of ion channel structural models. J Mol Graph. 1996;14:354–360. 376. doi: 10.1016/s0263-7855(97)00009-x. [DOI] [PubMed] [Google Scholar]


