Abstract
We present a systematic analysis of the accuracy of five different methods for extracting the biomechanical properties of soft samples using optical coherence elastography (OCE). OCE is an emerging noninvasive technique, which allows assessing biomechanical properties of tissues with a micrometer spatial resolution. However, in order to accurately extract biomechanical properties from OCE measurements, application of proper mechanical model is required. In this study, we utilize tissue-mimicking phantoms with controlled elastic properties and investigate the feasibilities of four available methods for reconstructing elasticity (Young’s modulus) based on OCE measurements of an air-pulse induced elastic wave. The approaches are based on the shear wave equation (SWE), the surface wave equation (SuWE), Rayleigh-Lamb frequency equation (RLFE), and finite element method (FEM), Elasticity values were compared with uniaxial mechanical testing. The results show that the RLFE and the FEM are more robust in quantitatively assessing elasticity than the other simplified models. This study provides a foundation and reference for reconstructing the biomechanical properties of tissues from OCE data, which is important for the further development of noninvasive elastography methods.
Keywords: Optical coherence elastography (OCE), phase velocity, elastic wave, Rayleigh-Lamb frequency equation, finite element method, tissue-mimicking phantom
INTRODUCTION
The mechanical properties of tissues can be altered by diseases (Kennedy et al., 2014a). For instance, keratoconus is a structurally degenerative disease, which decreases corneal stiffness and results in significant vision degeneration (Han et al., 2013; Tao et al., 2013; Scarcelli et al., 2014). Tumors generally have elastic features that are distinct from healthy tissues as well (Manapuram et al., 2012; Liang et al., 2008). Hence, assessing the biomechanical properties of tissues can provide important information for detecting the onset and progression of disease.
There have been various approaches for characterizing the tissue biomechanical properties in situ. Among others, the magnetic resonance elastography (MRE) (Mariappan et al., 2010; Papazoglou et al., 2012) and the ultrasound elastography (USE) (Evans et al., 2010; Arda et al., 2011; Schmitt et al., 2010) are popular methods that utilize the imaging techniques in conjunction with mechanical loading to obtain the tissue biomechanical properties noninvasively. However, MRE and USE cannot provide images with spatial resolution in the order of microns. Regarding the corneal biomechanics measurements, commercial instruments such as the Ocular Response Analyzer (ORA) or CorVis can characterize corneal dynamic responses noninvasively (Kotecha et al., 2014; Han et al., 2014). However, the ORA can only provide corneal hysteresis (CH) to reflect the damping ability; it cannot give a quantitative measurement of the elasticity.
Optical coherence elastography (OCE) is an emerging technique for imaging and assessing tissue biomechanical properties (Wang and Larin, 2014b). Benefiting from micro-scale spatial resolving ability (Brezinski and Fujimoto, 1999) and nano-scale displacement sensitivity (Wang et al., 2007) of optical coherence tomography (OCT) due to phase-resolved detection, OCE enables unique measurement scales that could not be achieved with traditional elastography methods (Kennedy et al., 2014a; Kennedy et al., 2014b) and maximizes the preservation of the tissue structural and functional properties during imaging due to minimal tissue mechanical loading (Li et al., 2012a; Wang and Larin, 2014a). Based on different types of mechanical excitation methods, OCE is capable of providing both qualitative and quantitative tissue mechanical information (Kennedy et al., 2011; Crecea et al., 2009; Liang et al., 2010; Kling et al., 2014). Recently, OCE has been applied in various ex vivo applications, such as soft-tissue tumor detection (Kennedy et al., 2013b; Wang et al., 2012), human coronary artery elasticity mapping (Qi et al., 2012; Rogowska et al., 2004), cardiac muscle elasticity characterization (Wang et al., 2014), and in vivo, such as biomechanics of tadpoles and engineered tissue (Ko et al., 2006) and the effects of age on murine corneal stiffness (Li et al., 2014).
The development of OCE has been highly relying on the classic mechanical models, e.g. Hooke’s law and Kelvin-Voigt body, which determine the mechanical properties based on a displacement parameter that is measured. For example, the detection and assessment of elastic wave propagation in a sample can be used for the mechanical models (Bercoff et al., 2004; Nguyen et al., 2014). As there exist several elastic wave models to describe the tissue biomechanical properties, such as the shear wave equation (SWE), the surface wave equation (SuWE) (Manapuram et al., 2012; Wang et al., 2013b; Li et al., 2013; Kennedy et al., 2014a), and the Rayleigh-Lamb frequency equation (RLFE) (Nenadic et al., 2011b; Nenadic et al., 2011a), accurate quantification of sample elasticity greatly depends on the correct selection and utilization of these models. Recently, finite element method (FEM) has been applied in OCE and demonstrated as a powerful approach to further investigate the whole stimulation and measurement process for advanced elastography (Kennedy et al., 2013a; Chin et al., 2014). However, to the best of our knowledge, studies investigating the constraints for these methods to quantify elasticity have not been reported previously, which is important for the further development of OCE techniques.
To meet this demand, in this paper, we present systematic comparisons and detailed evaluations of SWE, SuWE, RLFE, and FEM reconstruction methods by using tissue-mimicking phantoms. Meanwhile, uniaxial mechanical compression testing is also compared. Throughout the description and discussion of the results, we show the advantages and limitations of these quantitative elasticity reconstruction methods for the use in OCE.
METHODS
Tissue-mimicking phantom preparation
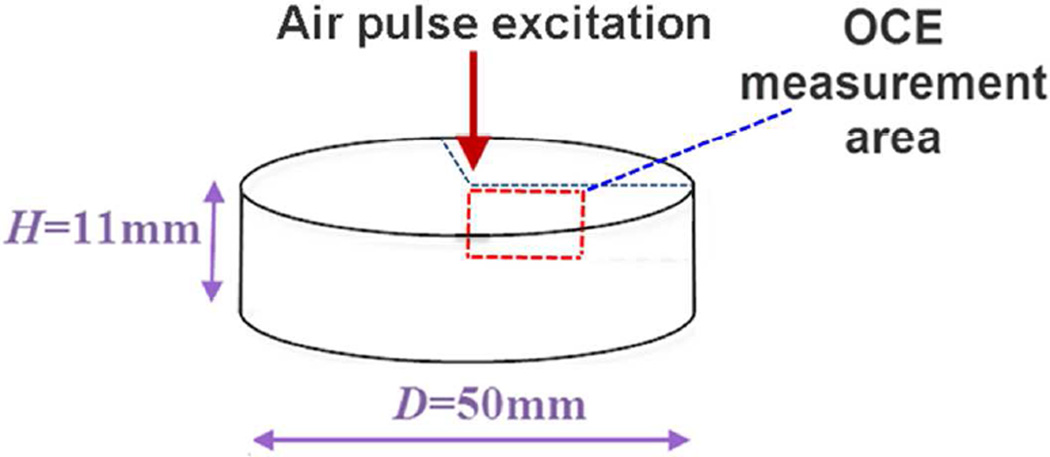
Agar phantoms of various concentrations (1%, 1.5%, and 2%, w/w, n=3 for each concentration) were utilized as tissue-mimicking samples of varying elastic properties (Li et al., 2013; Wang et al., 2013a). During the sample production process, agar powder and distilled water were mixed and heated in a microwave oven until no granules were observed. Circular culture dishes with inner diameter D=50 mm and height H=11 mm were used to mold the phantom samples. Special care was taken to avoid the formation of bubbles in the phantoms which were then cooled in a refrigerator at ~4°C (Li et al., 2013).
PhS-SSOCE measurements
The custom-built phase-stabilized swept source optical coherence elastography (PhS-SSOCE) system is composed of two main parts: a focused air-pulse delivery system and a phase-stabilized swept source optical coherence tomography (PhS-SSOCT) system (Wang et al., 2013b; Li et al., 2013; Manapuram et al., 2012). The PhS-SSOCT system utilized a broadband swept laser source (HSL2000, Santec, Inc., Torrance, California) with a central wavelength of 1310 nm, bandwidth of ~150 nm, and scanning rate of 30 kHz. The experimentally measured axial resolution of the system was ~11 µm in air and phase stability of ~16 milliradians, which corresponded to ~3.3 nm of displacement sensitivity in air. More details regarding the OCT system can be found in our previous work (Manapuram et al., 2008; Manapuram et al., 2009). The air-pulse system produced a short duration (≤ 1 ms) stream of air with a Gaussian profile through a solenoid controlled air gate and out of a cannula port with a flat edge and inner diameter of ~150 µm (Wang et al., 2013b). The air source pressure was monitored and controlled with an air pressure gauge. It should be noted that the air source pressure and the air pressure that acts on the phantom surface are different. In our previous work (Wang et al., 2013b), the relationship of the air source pressure and the air pressure expelled out of the air port was investigated, but the exact temporal profile of the air pressure acting on the surface of the sample could not be obtained accurately. However, based on frequency analysis of the air-pulse induced displacement in the phantoms, we estimate the bandwidth of the excitation source to be predominantly between 200 and 800 Hz.
The phantom samples (n=3 for each concentration) were placed on a circular support during the OCE measurements. The upper and lower surfaces in the central region were kept free of contact in order to satisfy the boundary condition required for Lamb wave propagation (Nenadic et al., 2011b). The distance between the excitation point and the air-pulse port was kept at ~500 µm. The air-pulse delivery system was synchronized with the PhS-SSOCT system using a TTL signal. By synchronizing air pulses with successive M-mode images, a two dimensional depth-resolved map of the measurement area can be generated as shown in Figure 1 (Wang and Larin, 2014c). All OCE measurements were taken in the central region of the phantoms.
Figure 1.
Size of the phantoms, the OCE measurement area within the phantoms, and the air-pulse excitation position.
Elastic wave velocity and phase velocities
The elastic wave propagation time delay was calculated by cross-correlating normalized displacement profiles from successive lateral measurement positions at each imaged layer in the phantoms for a depth up to ~0.4 mm. The velocity of the elastic wave was quantified as the ratio of propagation distance to the time delay.
The phase velocity of the elastic wave at a certain angular frequency was calculated by a similar approach as presented in (Li et al., 2011). For each measurement position at each depth layer, a fast Fourier transform (FFT) was performed on the temporal displacement profile. The phase shifts, Δθ, for each angular frequency at each position were then calculated. The phase velocity at the angular frequency, ω, was expressed as: cp= ωΔx/Δθ, where Δx was the distance that the wave propagates during the phase shift. The phase velocity for each frequency was obtained by linearly fitting the phase shifts to their corresponding lateral measurement positions. The phase velocities for each depth were then averaged to obtain a single phase velocity for each frequency.
Elasticity reconstruction
The air puff induced displacement on the phantom surface was on the order of a few µm and the phantom dimensions are on the order of mm, hence, a small deformation assumption was used. The governing equation of motion for homogeneous medium is (Nenadic et al., 2011b; Nenadic et al., 2011a; Doyle, 1997):
| (1) |
where ρ is the material density, u is the displacement vector, t is the time, and λ and μ are the Lamé constants with λ=Eν/((1+ν)(1−2ν)) and μ=E/(2(1+ν)). Here, E is the Young’s modulus and ν is the Poisson ratio.
By introducing a scalar potential φu and a vector potential Hu with
| (2) |
where the first term is the gradient of the scalar potential φu, while the second term is the curl of Hu. Therefore, the formula (1) can be decoupled into the two following wave equations:
| (3) |
| (4) |
Here, c1 is the compressional wave (P-wave) velocity and c2 is the shear wave (S-wave) velocity. As the tissue-mimicking phantoms are assumed to be nearly incompressible, the Poisson ratio was set as 0.49 (Manapuram et al., 2012; Doyle, 1997).
It should be noted that the measured elastic wave velocity, cg, is not identical to the shear wave velocity, c2, although in some previous work (Razani et al., 2014; Kennedy et al., 2014a; Razani et al., 2012) it was used to calculate the Young’s modulus as
| (5) |
In other previous studies (Li et al., 2012b; Wang et al., 2013b; Manapuram et al., 2012; Li et al., 2013; Kennedy et al., 2014a), the measured elastic wave velocity of the surface wave was employed to obtain the Young’s modulus by (Doyle, 1997):
| (6) |
Here, formula 5 is termed as the shear wave equation (SWE), and formula 6 is called the surface wave equation (SuWE). Both formulae are examined in the present work.
Rayleigh–Lamb frequency equation (RLFE)
A third method for estimating the Young’s modulus is based on the Rayleigh-Lamb frequency equation (RLFE). As there was no surface stress on the top and bottom boundaries of the phantoms, the anti-symmetric Lamb wave mode is adopted. An analytical solution for equations 1–4 with zero surface stress boundary conditions is the anti-symmetric RLFE equation (Nenadic et al., 2011b; Nenadic et al., 2011a)
| (7) |
In equation 7, h is half the thickness of the phantom (h=0.5 H=5.5 mm), k=ω/cp is the wave number at angular frequency ω. The additional parameters α2 and β2 are defined as:
| (8) |
By solving equation 7, the numerical relation between the angular frequency ω and the phase velocity cp was obtained and compared with the experimental data from the PhS-SSOCE measurements to determine the Young’s modulus.
Finite element method (FEM)
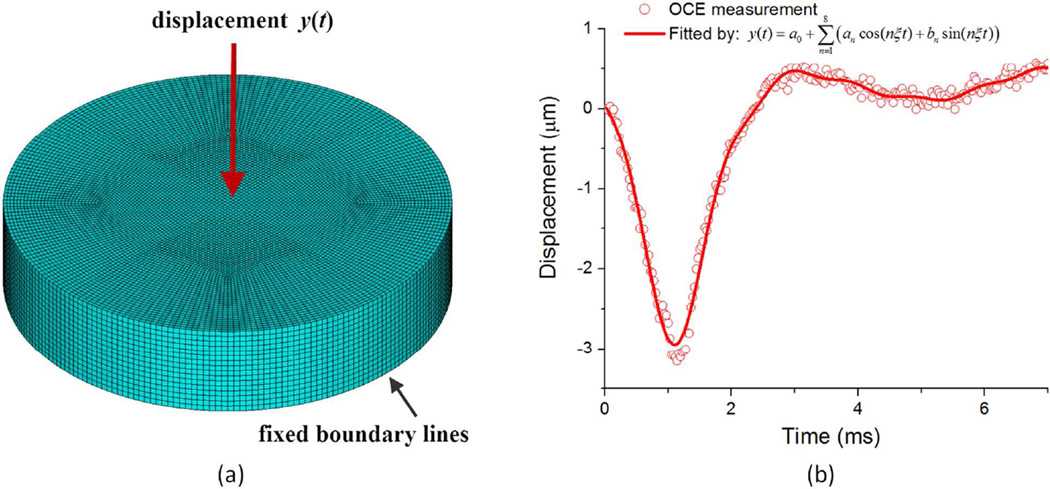
Finite element (FE) simulations were also conducted to assess the Young’s modulus. Since the exact pressure temporal profile applied by the air-pulse on the surface of the phantoms could not be accurately obtained, the OCE-measured temporal profile was prescribed at the center point of the top surface of the phantoms as the external displacement excitation during the FE simulations, as shown in Figure 2(a). The temporal profile was fitted by
| (9) |
where a0, an, and bn (n=1, 2, …,8), and ξ were parameters to be determined (Figure 2(b)). Figure 2(a) also shows the finite element model constructed in the ANSYS 14.0 platform (ANSYS Inc., PA, USA). This model was based on the identical dimensions of the phantoms (diameter D=50 mm, height H=11 mm). The 8-node Solid 185 element was employed to mesh the whole volume body. After meshing, this model had 173553 nodes and 161472 elements. This number of elements was found to be sufficiently accurate with less than 2% error when compared with the results from a ~300000-element case after testing different numbers of elements (~6000, ~160000, and ~300000). The displacement profile, y(t), was prescribed at the excitation point, and the fixed boundary condition was applied to the bottom edge to match the OCE experimental conditions. The density of the phantom was assumed to be ~1000kg/m3, and the Poisson ratio was assumed to be 0.49 for all samples to account for the nearly incompressible nature of the phantoms. The maximum calculation time was Tmax=8 ms with the time step Δt=0.1 ms. The elastic wave velocities obtained from the FEM simulations were compared to those obtained from the OCE experimental data.
Figure 2.
(a) The finite element model for the OCE measurements on the phantoms; (b) Temporal displacement profile for the center point on the phantom and its curve fitting.
Uniaxial mechanical compressional tests
To minimize the effects of the dehydration, temperature, humidity, and inter-sample variability, uniaxial mechanical compressional tests (Model 5943, Instron Corp., MA) were performed on the same phantoms (n=3 for each concentration) immediately after the OCE experiments. The OCE experiment duration was approximately 30 seconds for each sample. Before compression, a pre-load force of 0.004N was applied (Wollensak et al., 2003). The uniaxial compression was performed at 2 mm/minute and was stopped at strain of ε=0.2. The stress was calculated by σ=4F/πD2, where F was the compressional force, and the strain was obtained by ε=L/H, where L was the displacement. The stress-strain relationship was fitted by σ=Aε2+Bε, where A and B were unknowns to be determined. The Young’s modulus at a certain strain was calculated by the derivative E=dσ/dε=2Aε+B.
RESULTS
The accuracy of each of the five methods for Young’s modulus estimation was quantitatively compared. The elastic wave velocity distributions as a function of depth for a typical agar phantom of each concentration are shown in Figure 3(a). Within a depth of 0.4 mm, the elastic wave velocity for each phantom was almost constant as a function of depth, demonstrating the homogeneity of the phantoms. The group velocities of the elastic wave for the 1%, 1.5%, and 2% agar phantoms (n=3) as measured by PhS-SSOCE were cg=2.3±0.1 m/s, 3.7±0.1 m/s, and 6.1±0.2 m/s, respectively (Figure 3(b)). These values were utilized by the SWE and SuWE for estimating the Young’s modulus. Based on formula (5), the Young’s moduli obtained by SWE were E=15.2±1.8 kPa, 40.3±3.1 kPa, and 112.5±5.6 kPa for the 1%, 1.5%, and 2% agar phantoms, respectively. Using formula (6), the Young’s moduli of the 1%, 1.5%, and 2% agar phantoms were E= 16.6±2.0 kPa, 44.2±3.4 kPa, and 123.3±6.2 kPa, respectively. Comparison between the results from SWE and SuWE is made in Figure 3(c).
Figure 3.
(a) Elastic wave velocity distributions as a function of depth obtained from PhS-SSOCE for a single typical agar phantom of each concentration (1%, 1.5%, and 2%); (b) The means of the elastic wave group velocities for the agar phantoms of different concentrations (1%, 1.5%, and 2%, n=3 for each concentration) obtained from PhS-SSOCE; (c) Results of the Young’s modulus by SWE and SuWE in formulae (5) and (6). Standard deviations were calculated from the inter-sample means (n=3).
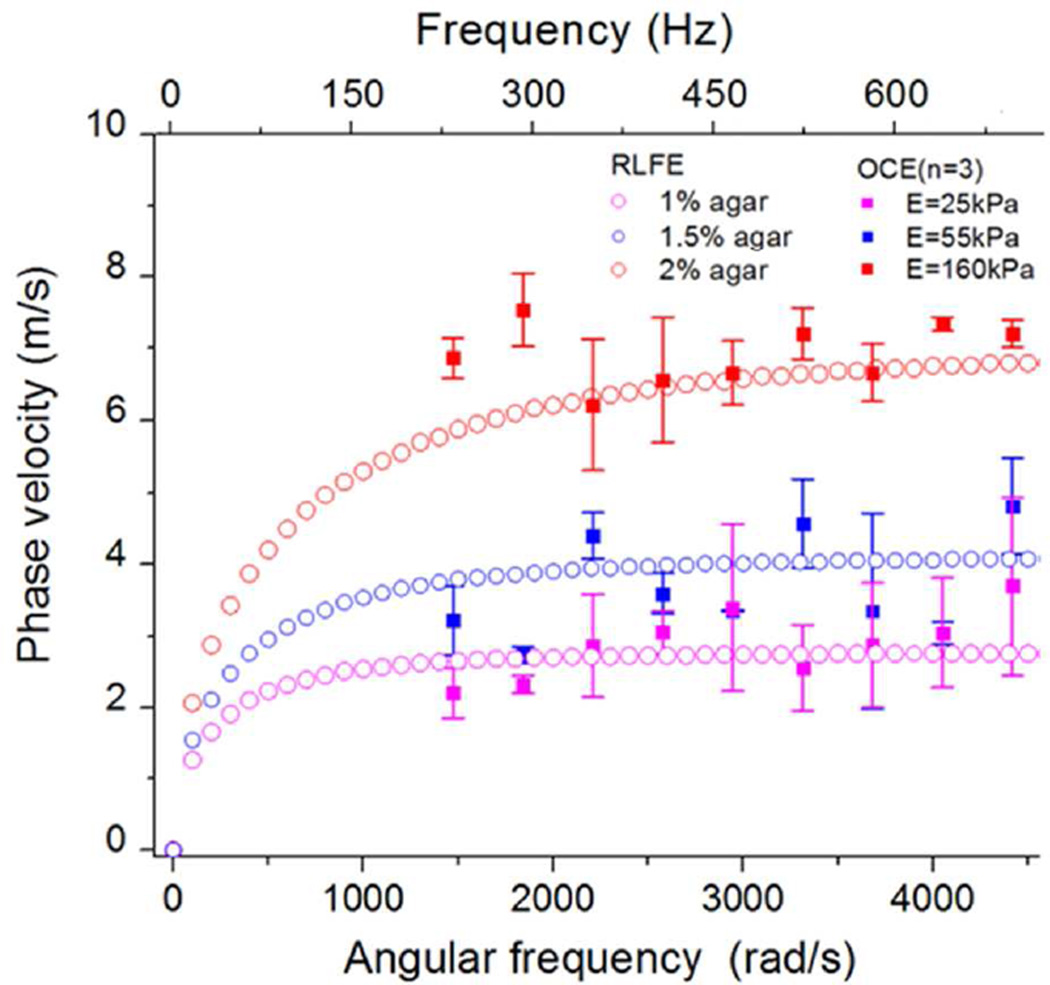
Comparisons were also made on the relationships between phase velocities obtained from the OCE experimental data and computational results obtained using RLFE (Figure 4). The usable angular frequencies, as determined by spectral analysis of the elastic wave, were greater than 1000 rad/s and less than 6000 rad/s, while the phase velocities were greater than 2 m/s and less than 8 m/s. The characteristic curve is calculated based on the anti-symmetric ‘A0’ mode of the Lamb wave. From the comparison between the RLFE and OCE data, the Young’s modulus was estimated to be 25 kPa for 1% agar phantom group, 55 kPa for 1.5%, and 160 kPa for 2% group, respectively.
Figure 4.
Comparison of the phase velocities at different angular frequencies between OCE measurements (1%, 1.5%, and 2%, n=3 for each concentration) and numerical results of the Rayleigh-Lamb frequency equation.
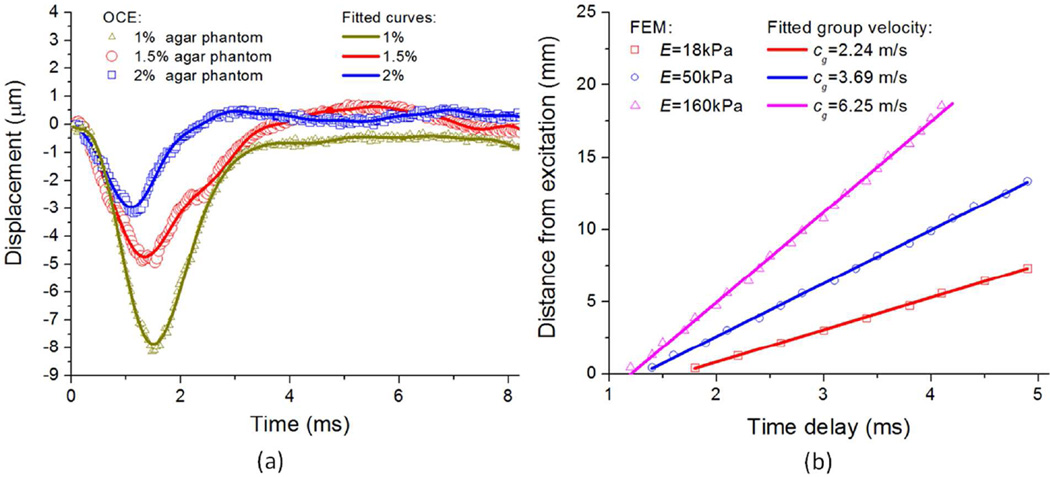
Figure 5(a) displays typical temporal displacement profiles for agar phantoms of each concentration as measured by PhS-SSOCE and fitted profiles provided by formula (9). The corresponding parameters for these fitted curves are shown in Table 1, which were required in the central citation for FE simulations.
Figure 5.
(a) Typical temporal displacement profiles of the central excitation position and fitted curves used in FEM simulations for agar phantoms of different concentrations (1%, 1.5%, and 2%); (b) The relationships of the distance from excitation and time delays of the maximum displacement for different Young’s modulus by FE simulations and linear fits used to determine elastic wave velocity.
Table 1.
Fitted Parameters for the displacement profiles of the agar phantoms of different concentrations
| Concentration | n | 1 | 2 | 3 | 4 | 5 | 6 | 7 | 8 | ||
|---|---|---|---|---|---|---|---|---|---|---|---|
| 1% | a0 | 11.89 | an | 12.21 | −9.109 | −14.9 | −5.547 | 2.25 | 2.515 | 0.6347 | 0 |
| ξ | 0.504 | bn | −22.51 | −20.46 | −2.393 | 8.169 | 5.888 | 1.178 | −0.1758 | 0 | |
| 1.5 | a0 | −0.8655 | an | −0.7092 | 0.719 | 0.5199 | 0.2309 | 0.06156 | −0.0571 | 0.00214 | 0 |
| ξ | 0.773 | bn | −1.888 | −0.5789 | 0.1104 | 0.1749 | 0.1885 | 0.06593 | −0.0341 | 0 | |
| 2% | a0 | −0.171 | an | −0.55 | 0.02785 | 0.3792 | 0.298 | 0.1349 | 0.01196 | −0.0486 | −0.045 |
| ξ | 0.737 | bn | −0.649 | −0.8035 | −0.2425 | 0.045 | 0.1156 | 0.09786 | 0.03282 | −0.023 |
In Figure 5(b), the elastic wave velocities obtained by the FE simulations are presented. Three different values of Young’s modulus, E=18 kPa, 50 kPa, and 160 kPa, for each of the three agar phantom concentrations were incorporated into the FE simulation. These values were determined by iterative trial and error by minimizing the difference between OCE-measured and FEM-simulated elastic wave group velocities. The Young’s moduli were adjusted until the FE elastic wave velocity matched the elastic wave velocity measured by PhS-SSOCE. The relationships between the position and the time delay of the maximal displacement point were linearly fitted to obtain elastic wave velocity. According to the simulation results, the fitted group velocities were found to be very similar to the results from the PhSSSOCE measurements. For E=18 kPa (1% agar phantom), FEM resulted in an elastic wave velocity cg=2.2 m/s as compared to the PhS-SSOCE measured elastic wave velocity of 2.3±0.1 m/s. At E=50 kPa (1.5% agar phantom), the FEM elastic wave velocity was 3.7 m/s, as compared to 3.7±0.1 m/s obtained from PhS-SSOCE. With E=160 kPa (2% agar phantom), the FEM elastic wave velocity was calculated as cg=6.3 m/s, which was similar to the PhS-SSOCE measured elastic wave velocity of 6.1±0.2 m/s. These results demonstrated that the FE simulation could provide a suitable value of Young’s modulus by utilizing the elastic wave velocity. Meanwhile, these values were close to those obtained by RLFE, which confirmed the accuracy of the FEM.
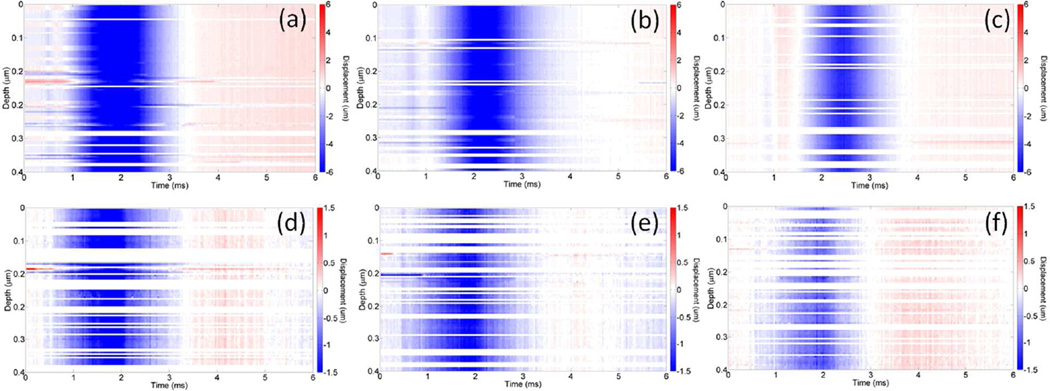
Stationary temporal displacement maps at various OCE measurement positions from a 1% and 2% agar phantom are presented in Figure 6. Displacement maps for positions (a) 1.2 mm, (b) 1.7 mm, and (c) 2.2 mm away from the excitation for the 1% agar phantom and (d) 0.5 mm, (e) 1.0 mm, and (f) 1.5 mm away from the excitation for the 2% agar phantom, respectively, demonstrate propagation and attenuation of the elastic waves. As expected for a homogeneous sample, the group velocities do not change as a function of depth. It should be noted that the color scales and initial measurement positions are not identical for the different concentrations due to the elastic wave amplitude attenuation (but the spacing between the points is the same). From these displacement maps, it can be seen that the elastic wave in the 1% agar phantom takes approximately 3 times longer to propagate the same distance as compared to the 2% agar phantom, which was corroborated by the elastic wave velocity calculations obtained by cross-correlation analysis.
Figure 6.
Stationary displacement maps of elastic waves propagating in 1% agar phantom at (a) 1.2, (b) 1.7, and (c) 2.2 mm away from the excitation position and 2% agar phantom at (d) 0.5, (e) 1.0, and (f) 1.5 mm away from the excitation position, respectively.
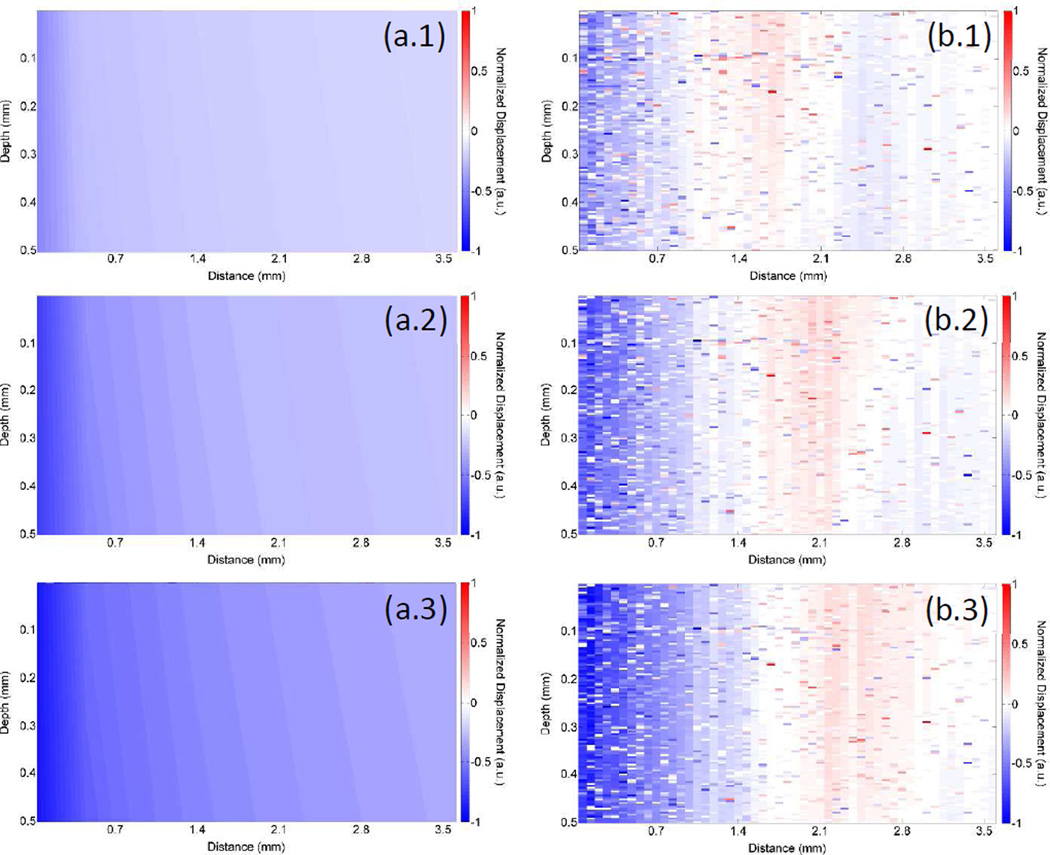
The elastic wave propagation for different depths was also modeled by the FEM simulation. As shown in Figure 7, the normalized vertical displacements calculated by FEM for E=18 kPa (1% agar phantom) at three different time points are compared with the corresponding displacements measured by OCE. At t=1 ms, the wave was still localized near the excitation position in the phantom and proceeds to propagate outwards from the excitation position, which corroborates with previous OCE results (Wang et al., 2013b; Li et al., 2013; Wang and Larin, 2014c).
Figure 7.
Elastic wave propagation in a 1% agar phantom calculated by (a) FEM (with E=18 kPa) and measured by OCE (b) at (1) 1 ms, (2) 1.2 ms, and (3) 1.4 ms after excitation.
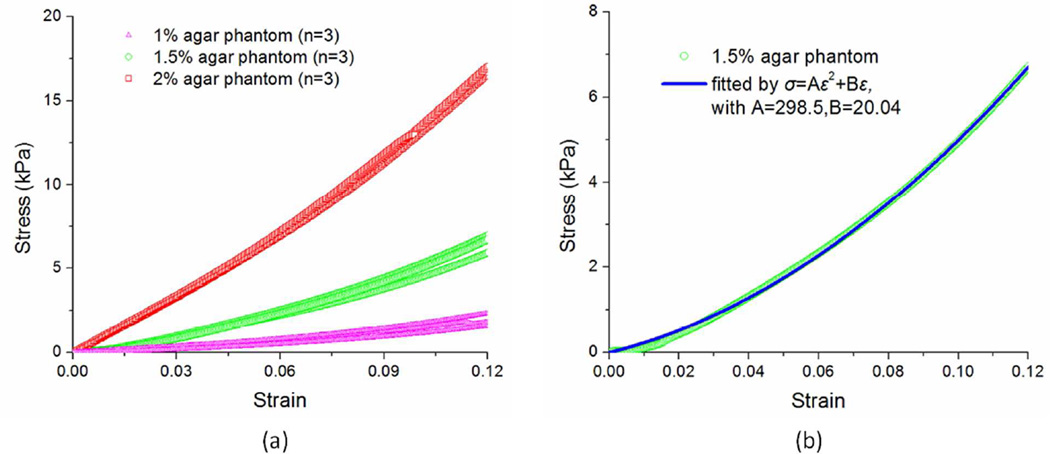
The stress-strain curves obtained through uniaxial mechanical compression tests are shown in Figure 8(a). Each stress-strain curve was found to be well fitted by the formula σ=Aε2+Bε (R2 > 0.95 for all samples). Figure 8(b) shows the stress-strain curve obtained from uniaxial mechanical testing and the fitted stress-strain curve from a typical 1.5% agar phantom. The parameters A and B obtained from fitting for the 1%, 2%, and 3% phantoms were A=93.0±56.8 and B=5.3±5.2, A=280.3±16.3 and B=21.2±3.3, and A=316.2±39.9 and B=99.6±1.9, respectively. The Young’s modulus was then be calculated by E=2Aε+B at strain ε=0.1. It is worth noting that this was not an accurate strain for the estimation of the true Young’s modulus that occurred in the PhS-SSOCE experiments as the strain was not exactly 0.1. According to previous work and our understanding, the true strains induced in the OCE experiments were ε≤0.1 (Kennedy et al., 2014a). However, using the true strain from OCE measurements is impractical. Here, the Young’s modulus at ε=0.1, E0.1, was calculated from uniaxial mechanical compression testing as 23.9±4.1kPa, 77.2±4.5kPa and 162.8±7.7kPa for the 1%, 1.5%, and 2% agar phantoms, respectively.
Figure 8.
(a) The stress-strain relationships for agar phantoms (1%, 1.5%, and 2%, n=3 for each concentration) obtained by uniaxial mechanical compression testing; (b) A typical example of a stress-strain curve of a 1.5% agar phantom obtained from uniaxial mechanical testing and fitted by σ=Aε2+Bε.
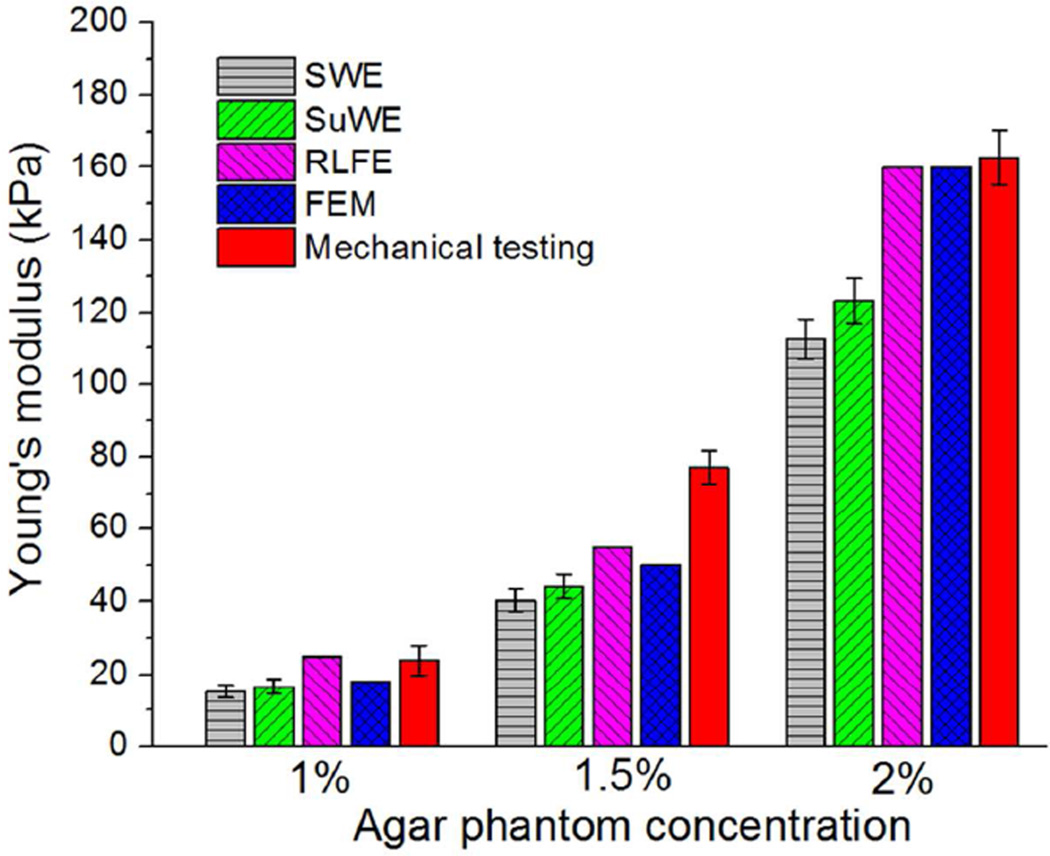
The estimated values of the Young’s modulus for each of the agar phantom concentrations by the five methods are compared in Figure 9. The values of the Young’s modulus are also shown in Table 2. Compared with the results of FEM, the SWE and SuWE underestimated the Young’s modulus, but the SuWE was more accurate than the SWE. The RLFE overestimated the elasticity when compared with FEM. At 2% concentration, the mechanical testing results at strain=0.1 are the closest with FEM, while at 1% and 1.5% they are overestimated.
Figure 9.
Comparison of the Young’s modulus of agar phantoms of different concentrations (1%, 1.5%, and 2%, n=3 for each concentration) obtained by five methods: shear wave equation (SWE), surface wave equation (SuWE), Rayleigh-Lamb frequency equation (RLFE), finite element method (FEM) and uniaxial mechanical testing (mechanical testing).
Table 2.
Young’s moduli of agar phantoms of different concentrations (1%, 1.5%, and 2%, n=3) calculated using different analytical models.
| Concentration | Young's modulus (kPa) | ||||
|---|---|---|---|---|---|
| SWE | SuWE | RLFE | FEM | Mechanical testing | |
| 1.0% | 15.2±1.8 | 16.6±2.0 | 25 | 18 | 23.9±4.1 |
| 1.5% | 40.3±3.1 | 44.2±3.4 | 55 | 50 | 77.2±4.4 |
| 2.0% | 112.5±5.6 | 123.3±6.2 | 160 | 160 | 162.8±7.7 |
Furthermore, a one-way repeated measures ANOVA was performed on the results from the SWE, SuWE, and Mechanical testing results as these were the methods which provided Young’s modulus for all three samples of each concentration. The results of the multivariate analysis showed that p<0.05 for all three concentrations with p=0.022, 0.031, and 0.0056 for the 1%, 1.5%, and 2% agar phantoms, respectively.
DISCUSSIONS AND CONCLUSIONS
Since a fundamental goal of OCE is to obtain the local biomechanical properties of biological tissues (Kennedy et al., 2014a), it is critical to accurately extract the Young’s modulus. In this study, a PhSSSOCE system was employed to estimate the Young’s modulus of tissue-mimicking agar phantoms via different models: SWE, SuWE, RLFE, and FEM. Based on the PhS-SSOCE measured data from agar phantoms of different concentrations (1%, 1.5%, and 2%, n=3 for each concentration), FEM is suitable to quantify the elasticity, because the FEM model permits to consider appropriate boundary conditions of the mechanical problem. The SWE and SuWE underestimated the elasticity, while the RLFE overestimated the Young’s modulus. Furthermore, each of these methods has assumptions and limitations which must be taken into consideration when determining which method to use for elasticity quantification.
The SWE could be used when the measured elastic wave is treated as a shear wave, i.e. propagates in unlimited medium, far enough from the boundaries of the medium. In our OCE experiments this condition was not satisfied and using SWE model results to the underestimation of the Young’s modulus.
The SuWE formula has been adopted to estimate the Young’s modulus in a number of previous studies (Li et al., 2012b; Wang et al., 2013b; Manapuram et al., 2012; Li et al., 2013; Kennedy et al., 2014a). However, this formula is based on half-infinite depth assumption (Potel and Debelleval, 1995; Graff, 1975). The surface wave equation should produce some underestimation in elasticity estimation, as the wave speed in half-space is greater than in a thin layer. In our study, the thickness of the phantom is 11 mm, which does not satisfy the infinite depth assumption. Therefore, the SuWE formula is not strictly applicable to the OCE experiments. Nevertheless, the SuWE could still be used for initial estimates of Young’s modulus as a simplified model with satisfactory results.
Compared to the SWE and SuWE models, FEM permits to take into account a finite thickness of the phantom and can provide a reliable assessment of the Young’s modulus. Unlike the previous methods which require assumptions governing dimensions and measurement locations, FEM can incorporate experimental conditions and does not require specific measurement position restrictions. This provides a better accuracy when quantifying elasticity. Moreover, for soft materials, the FEM results are closer to the results obtained using surface wave equation because the relation between elastic wave wavelength and the thickness of the phantom is smaller for soft materials. For stiff materials, the elastic wave wavelength increases, and becomes comparable to the sample thickness. Here, the infinite thickness assumption carries greater weight and therefore, the FEM model is more closely matched to the Lamb wave model. In addition, the FEM is adaptable to complex sample geometries. However, one disadvantage of the FEM is computational complexity and long reconstruction time due to the large amount of calculations. For instance, the SWE and SuWE can provide the Young’s modulus almost instantly, and the RLFE solution can be acquired in a few minutes for a sample. However the FEM solution may take over 20 hours due to the iterative processes and large element numbers. In general, the sequence of the time cost is: FEM>RLFE>SuWE=SWE.
The RLFE assumes that the experimental sample is thin plate, in which the top and bottom surfaces are free of contact (Graff, 1975). This thin plate assumption, where the elastic wave velocity is smaller, may be why the RLFE overestimates the Young’s modulus. In addition, the size of the phantom sample is D=50 mm and H=11 mm, while the wavelength of the elastic wave is several mm. This relationship between sample dimensions and wavelength is insufficient to perfectly adhere to the thin plate assumption required by the RLFE. The results have shown that the RLFE provided slightly higher estimations of Young’s modulus for the phantoms when compared to the FEM data.
Uniaxial mechanical testing has been accepted as the gold standard for measuring the elasticity by a direct experimental approach. Mechanical testing works especially well for elastic materials whose stress-strain curves are linear. The Young’s modulus can easily be obtained by linear fitting the measured stress-strain curves. However, when dealing with the phantoms whose stress-strain curve is nonlinear, it was difficult to determine which strain should have been selected to calculate the elasticity. On the other hand, FEM is a widely used method in modeling mechanical properties of a sample and has even been utilized to verify other numerical models (Nenadic et al., 2011b; Nenadic et al., 2011a). Here, FEM directly utilized the OCE measured displacement profiles and the elasticity (Young’s modulus) was estimated by comparing the FEM-simulated and OCE-measured group velocities of the elastic waves.
As shown in Figure 8, the Young’s moduli measured by mechanical testing are greater than those obtained by FEM for the 1% and 1.5% agar phantoms. This deviation may be due to the fact that a strain of 0.1 was selected for quantifying Young’s modulus by mechanical testing. The initial strain, i.e. strain=0, was not used to calculate the Young’s modulus because the strain induced during the OCE experiments is not the initial strain. Due to the nonlinear stress-strain relationship of the agar phantoms, selection of different strains will result in different values of Young’s modulus. Therefore, the uniaxial mechanical test can only show the overall range of the elasticity for a tissue-like material. The ambiguity in selecting a strain may be a possible source of deviation between the Young’s modulus as measured by mechanical testing and the other methods investigated in this study.
The effect of compressional rate in the uniaxial compressional test was also examined (data are not shown). The elasticity was measured with a compressional rate of 2 mm/min, 6 mm/min, and 12 mm/min. The corresponding stress-strain curves showed no significant variation with respect to compression speed. This is also confirmed the assumption that the agar phantoms had negligible viscosity.
It should be noted that since the temporal displacement profiles only contain information within a certain band of frequencies, the OCE data at angular frequencies that were too low or too high to contain valuable information were removed. For example, in the 2% agar phantoms in Figure 4, the PhS-SSOCE-measured phase velocities lower than 1500 rad/s were not used. This was the limit imposed by the shape of the temporal displacement profile of the induced elastic waves, as shown in Figure 5(a). The data at angular frequencies greater than 6000 rad/s were also not adopted in the RLFE reconstruction because this data was primarily high frequency noise and did not contribute to the elastic wave displacement, which was confirmed by spectral analysis of the elastic wave. The restriction on usable frequencies for elasticity reconstruction is a limitation of the RLFE method for OCE biomechanical property reconstruction as a greater band of frequencies would provide a more accurate quantification of elasticity.
In summary, combining PhS-SSOCE with numerical analysis is a promising method to quantitatively reconstruct elasticity. Although each model has advantages and limitations, experiments on tissue-mimicking agar phantoms of various concentrations have shown that the FEM, which provides the direct solution for the governing mechanical equation, can extract the Young’s modulus with higher accuracy than other simplified models such as SWE and SuWE. Meanwhile, the RLFE can be accurate when applied to samples with thin-plate geometry. Future work will entail applying these reconstruction methods on tissues for noninvasive assessments of elasticity.
ACKNOWLEDGEMENTS
This work was supported, in part, by grants 1R01EY022362, 1R01HL120140, and U54HG006348 from the NIH and PRJ71TN from DOD/NAVSEA.
REFERENCES
- Arda K, Ciledag N, Aktas E, Aribas BK, Kose K. Quantitative Assessment of Normal Soft-Tissue Elasticity Using Shear-Wave Ultrasound Elastography. Am J Roentgenol. 2011;197:532–536. doi: 10.2214/AJR.10.5449. [DOI] [PubMed] [Google Scholar]
- Bercoff J, Tanter M, Fink M. Supersonic shear imaging: a new technique for soft tissue elasticity mapping. IEEE Trans Ultrason Ferroelectr Freq Control. 2004;51:396–409. doi: 10.1109/tuffc.2004.1295425. [DOI] [PubMed] [Google Scholar]
- Brezinski ME, Fujimoto JG. Optical coherence tomography: high-resolution imaging in nontransparent tissue. Selected Topics in Quantum Electronics, IEEE Journal of. 1999;5:1185–1192. [Google Scholar]
- Chin L, Curatolo A, Kennedy BF, Doyle BJ, Munro PRT, McLaughlin RA, Sampson DD. Analysis of image formation in optical coherence elastography using a multiphysics approach. Biomedical Optics Express. 2014;5:2913–2930. doi: 10.1364/BOE.5.002913. [DOI] [PMC free article] [PubMed] [Google Scholar]
- Crecea V, Oldenburg AL, Liang X, Ralston TS, Boppart SA. Magnetomotive nanoparticle transducers for optical rheology of viscoelastic materials. Opt. Express. 2009;17:23114–23122. doi: 10.1364/OE.17.023114. [DOI] [PMC free article] [PubMed] [Google Scholar]
- Doyle JF. Wave propagation in structures. New York: Springer-Verlag; 1997. [Google Scholar]
- Evans A, Whelehan P, Thomson K, McLean D, Brauer K, Purdie C, Jordan L, Baker L, Thompson A. Quantitative shear wave ultrasound elastography: initial experience in solid breast masses. Breast Cancer Res. 2010;12 doi: 10.1186/bcr2787. [DOI] [PMC free article] [PubMed] [Google Scholar]
- Graff KF. Wave motion in elastic solids. Courier Dover Publications; 1975. [Google Scholar]
- Han ZL, Sui XH, Zhou D, Zhou CQ, Ren QS. Biomechanical and Refractive Behaviors of Keratoconic Cornea Based on Three-Dimensional Anisotropic Hyperelastic Models. J Refract Surg. 2013;29:282–290. doi: 10.3928/1081597X-20130318-08. [DOI] [PubMed] [Google Scholar]
- Han ZL, Tao C, Zhou D, Sun Y, Zhou CQ, Ren QS, Roberts CJ. Air Puff Induced Corneal Vibrations: Theoretical Simulations and Clinical Observations. J Refract Surg. 2014;30:208–213. doi: 10.3928/1081597X-20140212-02. [DOI] [PubMed] [Google Scholar]
- Kennedy BF, Kennedy KM, Sampson DD. A Review of Optical Coherence Elastography: Fundamentals, Techniques and Prospects. Ieee J Sel Top Quant. 2014a;20 [Google Scholar]
- Kennedy BF, Liang X, Adie SG, Gerstmann DK, Quirk BC, Boppart SA, Sampson DD. In vivo three-dimensional optical coherence elastography. Opt. Express. 2011;19:6623–6634. doi: 10.1364/OE.19.006623. [DOI] [PMC free article] [PubMed] [Google Scholar]
- Kennedy BF, McLaughlin RA, Kennedy KM, Chin L, Curatolo A, Tien A, Latham B, Saunders CM, Sampson DD. Optical coherence micro-elastography: mechanical-contrast imaging of tissue microstructure. Biomedical Optics Express. 2014b;5:2113–2124. doi: 10.1364/BOE.5.002113. [DOI] [PMC free article] [PubMed] [Google Scholar]
- Kennedy KM, Ford C, Kennedy BF, Bush MB, Sampson DD. Analysis of mechanical contrast in optical coherence elastography. J Biomed Opt. 2013a;18:121508. doi: 10.1117/1.JBO.18.12.121508. [DOI] [PubMed] [Google Scholar]
- Kennedy KM, McLaughlin RA, Kennedy BF, Tien A, Latham B, Saunders CM, Sampson DD. Needle optical coherence elastography for the measurement of microscale mechanical contrast deep within human breast tissues. J Biomed Opt. 2013b;18:121510. doi: 10.1117/1.JBO.18.12.121510. [DOI] [PubMed] [Google Scholar]
- Kling S, Akca IB, Chang EW, Scarcelli G, Bekesi N, Yun S-H, Marcos S. Numerical model of optical coherence tomographic vibrography imaging to estimate corneal biomechanical properties. Journal of The Royal Society Interface. 2014;11 doi: 10.1098/rsif.2014.0920. [DOI] [PMC free article] [PubMed] [Google Scholar]
- Ko HJ, Tan W, Stack R, Boppart SA. Optical coherence elastography of engineered and developing tissue. Tissue engineering. 2006;12:63–73. doi: 10.1089/ten.2006.12.63. [DOI] [PubMed] [Google Scholar]
- Kotecha A, Russell RA, Sinapis A, Pourjavan S, Sinapis D, Garway-Heath DF. Biomechanical parameters of the cornea measured with the Ocular Response Analyzer in normal eyes. Bmc Ophthalmol. 2014;14 doi: 10.1186/1471-2415-14-11. [DOI] [PMC free article] [PubMed] [Google Scholar]
- Li C, Guan G, Huang Z, Johnstone M, Wang RK. Noncontact all-optical measurement of corneal elasticity. Opt. Lett. 2012a;37:1625–1627. doi: 10.1364/OL.37.001625. [DOI] [PubMed] [Google Scholar]
- Li CH, Guan GY, Cheng X, Huang ZH, Wang RKK. Quantitative elastography provided by surface acoustic waves measured by phase-sensitive optical coherence tomography. Opt Lett. 2012b;37:722–724. doi: 10.1364/OL.37.000722. [DOI] [PubMed] [Google Scholar]
- Li CH, Huang ZH, Wang RKK. Elastic properties of soft tissue-mimicking phantoms assessed by combined use of laser ultrasonics and low coherence interferometry. Opt Express. 2011;19:10153–10163. doi: 10.1364/OE.19.010153. [DOI] [PubMed] [Google Scholar]
- Li J, Wang S, Singh M, Aglyamov S, Emelianov S, Twa MD, Larin KV. Air-pulse OCE for assessment of age-related changes in mouse cornea in vivo. Laser Physics Letters. 2014;11 1612-202X. [Google Scholar]
- Li JS, Wang S, Manapuram RK, Singh M, Menodiado FM, Aglyamov S, Emelianov S, Twa MD, Larin KV. Dynamic optical coherence tomography measurements of elastic wave propagation in tissue-mimicking phantoms and mouse cornea in vivo. J Biomed Opt. 2013;18 doi: 10.1117/1.JBO.18.12.121503. [DOI] [PMC free article] [PubMed] [Google Scholar]
- Liang X, Adie SG, John R, Boppart SA. Dynamic spectral-domain optical coherence elastography for tissue characterization. Opt. Express. 2010;18:14183–14190. doi: 10.1364/OE.18.014183. [DOI] [PMC free article] [PubMed] [Google Scholar]
- Liang X, Oldenburg AL, Crecea V, Chaney EJ, Boppart SA. Optical micro-scale mapping of dynamic biomechanical tissue properties. Optics express. 2008;16:11052–11065. doi: 10.1364/oe.16.011052. [DOI] [PMC free article] [PubMed] [Google Scholar]
- Manapuram RK, Aglyamov S, Menodiado FM, Mashiatulla M, Wang S, Baranov SA, Li J, Emelianov S, Larin KV. Estimation of shear wave velocityin gelatin phantoms utilizing PhS-SSOCT. Laser Phys. 2012;22:1–6. [Google Scholar]
- Manapuram RK, Manne VGR, Larin KV. Development of phase-stabilized swept-source OCT for the ultrasensitive quantification of microbubbles. Laser Phys. 2008;18:1080–1086. [Google Scholar]
- Manapuram RK, Manne VGR, Larin KV. Phase-sensitive swept source optical coherence tomography for imaging and quantifying of microbubbles in clear and scattering media. Journal of Applied Physics. 2009;105 [Google Scholar]
- Mariappan YK, Glaser KJ, Ehman RL. Magnetic Resonance Elastography: A Review. Clin Anat. 2010;23:497–511. doi: 10.1002/ca.21006. [DOI] [PMC free article] [PubMed] [Google Scholar]
- Nenadic IZ, Urban MW, Aristizabal S, Mitchell SA, Humphrey TC, Greenleaf JF. On Lamb and Rayleigh wave convergence in viscoelastic tissues. Phys Med Biol. 2011a;56:6723–6738. doi: 10.1088/0031-9155/56/20/014. [DOI] [PMC free article] [PubMed] [Google Scholar]
- Nenadic IZ, Urban MW, Mitchell SA, Greenleaf JF. Lamb wave dispersion ultrasound vibrometry (LDUV) method for quantifying mechanical properties of viscoelastic solids. Phys Med Biol. 2011b;56:2245–2264. doi: 10.1088/0031-9155/56/7/021. [DOI] [PMC free article] [PubMed] [Google Scholar]
- Nguyen T-M, Song S, Arnal B, Huang Z, O’Donnell M, Wang RK. Visualizing ultrasonically induced shear wave propagation using phase-sensitive optical coherence tomography for dynamic elastography. Optics Letters. 2014;39:838–841. doi: 10.1364/OL.39.000838. [DOI] [PMC free article] [PubMed] [Google Scholar]
- Papazoglou S, Hirsch S, Braun J, Sack I. Multifrequency inversion in magnetic resonance elastography. Phys Med Biol. 2012;57:2329–2346. doi: 10.1088/0031-9155/57/8/2329. [DOI] [PubMed] [Google Scholar]
- Potel C, Debelleval JF. Surface-Waves in an Anisotropic Periodically Multilayered Medium - Influence of the Absorption. Journal of Applied Physics. 1995;77:6152–6161. [Google Scholar]
- Qi W, Chen R, Chou L, Liu G, Zhang J, Zhou Q, Chen Z. Phase-resolved acoustic radiation force optical coherence elastography. Journal of Biomedical Optics. 2012;17:110505. doi: 10.1117/1.JBO.17.11.110505. [DOI] [PMC free article] [PubMed] [Google Scholar]
- Razani M, Luk TWH, Mariampillai A, Siegler P, Kiehl TR, Kolios MC, Yang VXD. Optical coherence tomography detection of shear wave propagation in inhomogeneous tissue equivalent phantoms and ex-vivo carotid artery samples. Biomedical Optics Express. 2014;5:895–906. doi: 10.1364/BOE.5.000895. [DOI] [PMC free article] [PubMed] [Google Scholar]
- Razani M, Mariampillai A, Sun CR, Luk TWH, Yang VXD, Kolios MC. Feasibility of optical coherence elastography measurements of shear wave propagation in homogeneous tissue equivalent phantoms. Biomedical Optics Express. 2012;3:972–980. doi: 10.1364/BOE.3.000972. [DOI] [PMC free article] [PubMed] [Google Scholar]
- Rogowska J, Patel NA, Fujimoto JG, Brezinski ME. Optical coherence tomographic elastography technique for measuring deformation and strain of atherosclerotic tissues. Heart. 2004;90:556–562. doi: 10.1136/hrt.2003.016956. [DOI] [PMC free article] [PubMed] [Google Scholar]
- Scarcelli G, Besner S, Pineda R, Yun SH. Biomechanical Characterization of Keratoconus Corneas Ex Vivo With Brillouin Microscopy. Invest Ophth Vis Sci. 2014;55:4490–4495. doi: 10.1167/iovs.14-14450. [DOI] [PMC free article] [PubMed] [Google Scholar]
- Schmitt C, Henni AH, Cloutier G. Ultrasound Dynamic Micro-Elastography Applied to the Viscoelastic Characterization of Soft Tissues and Arterial Walls. Ultrasound Med Biol. 2010;36:1492–1503. doi: 10.1016/j.ultrasmedbio.2010.06.007. [DOI] [PubMed] [Google Scholar]
- Tao C, Sun Y, Zhou CQ, Han ZL, Ren QS. Effects of Collagen Cross-Linking on the Interlamellar Cohesive Strength of Porcine Cornea. Cornea. 2013;32:169–173. doi: 10.1097/ICO.0b013e318264ee6a.. [DOI] [PubMed] [Google Scholar]
- Wang RK, Kirkpatrick S, Hinds M. Phase-sensitive optical coherence elastography for mapping tissue microstrains in real time. Applied Physics Letters. 2007;90:164105–164103. [Google Scholar]
- Wang S, Aglyamov S, Karpiouk A, Li JS, Emelianov S, Manns F, Larin KV. Assessing the mechanical properties of tissue-mimicking phantoms at different depths as an approach to measure biomechanical gradient of crystalline lens. Biomedical Optics Express. 2013a;4:2769–2780. doi: 10.1364/BOE.4.002769. [DOI] [PMC free article] [PubMed] [Google Scholar]
- Wang S, Larin KV. Noncontact depth-resolved micro-scale optical coherence elastography of the cornea. Biomedical Optics Express. 2014a;5:3807–3821. doi: 10.1364/BOE.5.003807. [DOI] [PMC free article] [PubMed] [Google Scholar]
- Wang S, Larin KV. Optical coherence elastography for tissue characterization: a review. Journal of Biophotonics. 2014b doi: 10.1002/jbio.201400108. LID - 10.1002/jbio.201400108 [doi] [DOI] [PMC free article] [PubMed] [Google Scholar]
- Wang S, Larin KV. Shear wave imaging optical coherence tomography (SWI-OCT) for ocular tissue biomechanics. Optics Letters. 2014c;39:41–44. doi: 10.1364/OL.39.000041. [DOI] [PMC free article] [PubMed] [Google Scholar]
- Wang S, Larin KV, Li JS, Vantipalli S, Manapuram RK, Aglyamov S, Emelianov S, Twa MD. A focused air-pulse system for optical-coherence-tomography-based measurements of tissue elasticity. Laser Phys Lett. 2013b;10 doi: 10.1088/1612-2011/10/7/075605. [DOI] [PMC free article] [PubMed] [Google Scholar]
- Wang S, Li J, Manapuram RK, Menodiado FM, Ingram DR, Twa MD, Lazar AJ, Lev DC, Pollock RE, Larin KV. Noncontact measurement of elasticity for the detection of soft-tissue tumors using phase-sensitive optical coherence tomography combined with a focused air-puff system. Opt. Lett. 2012;37:5184–5186. doi: 10.1364/OL.37.005184. [DOI] [PMC free article] [PubMed] [Google Scholar]
- Wang S, Lopez AL, Morikawa Y, Tao G, Li JS, Larina IV, Martin JF, Larin KV. Noncontact quantitative biomechanical characterization of cardiac muscle using shear wave imaging optical coherence tomography. Biomed Opt Express. 2014;5:1980–1992. doi: 10.1364/BOE.5.001980. [DOI] [PMC free article] [PubMed] [Google Scholar]
- Wollensak G, Spoerl E, Seiler T. Stress-strain measurements of human and porcine corneas after riboflavin-ultraviolet-A-induced cross-linking. J Cataract Refr Surg. 2003;29:1780–1785. doi: 10.1016/s0886-3350(03)00407-3. [DOI] [PubMed] [Google Scholar]


