

Abstract
Classical histology or immunohistochemistry combined with fluorescence or confocal laser scanning microscopy are common techniques in arthropod neuroanatomy, and these methods often require time-consuming and difficult dissections and sample preparations. Moreover, these methods are prone to artifacts due to compression and distortion of tissues, which often result in information loss and especially affect the spatial relationships of the examined parts of the nervous system in their natural anatomical context. Noninvasive approaches such as X-ray micro-computed tomography (micro-CT) can overcome such limitations and have been shown to be a valuable tool for understanding and visualizing internal anatomy and structural complexity. Nevertheless, knowledge about the potential of this method for analyzing the anatomy and organization of nervous systems, especially of taxa with smaller body size (e.g., many arthropods), is limited. This study set out to analyze the brains of selected arthropods with micro-CT, and to compare these results with available histological and immunohistochemical data. Specifically, we explored the influence of different sample preparation procedures. Our study shows that micro-CT is highly suitable for analyzing arthropod neuroarchitecture in situ and allows specific neuropils to be distinguished within the brain to extract quantitative data such as neuropil volumes. Moreover, data acquisition is considerably faster compared with many classical histological techniques. Thus, we conclude that micro-CT is highly suitable for targeting neuroanatomy, as it reduces the risk of artifacts and is faster than classical techniques. J. Comp. Neurol. 523:1281–1295, 2015. © 2015 Wiley Periodicals, Inc.
Keywords: nervous system, Drosophila, Myriapoda, antennal lobe, noninvasive imaging, 3D visualization, critical point drying, micro-CT, Leica EM CPD300, Xradia MicroXCT-200
Morphological analysis of an organism's nervous system complements the analysis of physiological, functional, and evolutionary characteristics and can also provide new insights into phylogenetic relationships (Harzsch, 2006; Strausfeld and Andrews, 2011). Comparative, functional, or developmental analyses of neuroanatomy require calibrated data of structures (e.g., neuropils) within an anatomical context as close to the natural state as possible. Current techniques include light and electron microscopic analyses of serial sections, but systematic compression, distortion, and sectioning deformations can cause substantial artifacts, resulting in inaccurate visualizations. Immunohistochemistry combined with confocal laser scanning microscopy (cLSM) is another common approach to obtain detailed neuroanatomical information. With cLSM it is possible to investigate whole-mount preparations (Ott and Elphick, 2003; Huetteroth and Schachtner, 2005; Wu and Luo, 2006; Zube et al., 2008) to depict specific neuropils and subsets of neurons in detail. Recently, histological clearing techniques have allowed cLSM through the arthropod cuticle (Smolla et al., 2014). At present, cLSM studies are the basis for establishing representative standard brains (e.g., standardized references of brain neuropils) for insects (whole-mounts or sectioned brains), e.g., the fruit fly Drosophila melanogaster (Rein et al., 2002), the sphinx moth Manduca sexta (Huetteroth and Schachtner, 2005; El Jundi et al., 2009; Huetteroth et al., 2010), the desert locust Schistocerca gregaria (Kurylas et al., 2008), the honey bee Apis mellifera (Galizia et al., 1999; Brandt et al., 2005), and the flour beetle Tribolium castaneum (Dreyer et al., 2010). However, penetration of antibodies and the depth of laser penetration into tissue thicker than 500 µm are limiting factors, and artifacts due to high z-errors and constraints of the objective (e.g., numerical aperture, immersion media, operation distance) cause heavy signal reductions (Wanninger, 2007; Smolla et al., 2014). Furthermore, this method entails extensive tissue preparation steps, which are very time-consuming. Consequently, most neuroanatomical studies are based on a small sample size, and studies on a population level are rare.
Noninvasive imaging such as X-ray micro-computed tomography (micro-CT) can overcome the aforementioned limitations and is widely used for clinical imaging (Hsieh, 2003; Kalender, 2005; reviewed in Metscher, 2009a, 2009bb), for example. CT is based on a computational procedure called tomographic reconstruction, as tomograms (image data sets) are generated from tomographic projections obtained with penetrating radiation (such as visible light, electrons, X-rays). X-ray tomography, with a resolution in the micro- or nanometer range is usually combined in the term X-ray micro-CT. In micro-CT in general, the sample is placed in the path of an X-ray beam that generates a projection image on a scintillator of a detector array (reviewed in Mizutani et al., 2008b; Metscher, 2009a). It is then rotated and imaged at multiple angles so that the X-ray absorption sequence of projections can be reconstructed within the scanned volume and the data sets obtained can be analyzed by reconstruction software. Nowadays, laboratory-scale, polychromatic micro-CTs are frequently used to analyze biological samples. In contrast to conventional laboratory-scale systems using solely geometric magnification, optical laboratory-scaled micro-CTs use a two-stage magnification technique based on synchrotron-caliber optics. In this approach, projection images of samples (or portions thereof) are first enlarged through geometric magnification and consecutively enlarged using a scintillator that converts X-rays into visible light, which can then be optically magnified using different objectives mounted on a microscope turret (Technical Note on Resolution of a 3D X-Ray Microscope, Carl Zeiss Microscopy GmbH, Jena, Germany, 2013). This two-stage architecture allows high-resolution analyses of small areas of interest within a large sample without the need of dissection.
Micro-CT has been used for more than 10 years to study arthropod anatomy (Fanenbruck et al., 2001; Hörnschemeyer et al., 2002) and has become an integral part of studies on the arrangement of various organ systems such as the musculature, the alimentary system, and rarely the nervous system of arthropods (Tanisako et al., 2005; Betz et al., 2007; Mizutani et al., 2007,2008a, Beutel et al., 2008; Friedrich and Beutel, 2008; Metscher, 2009a; Friedrich et al., 2013). In combination with corrosion casts, the arthropod circulatory system has been successfully studied (Wirkner and Richter, 2004; Wirkner and Prendini, 2007). A limiting factor for biological samples is often the low contrast of nonmineralized tissues in the X-ray (Metscher, 2009a). To enhance the contrast, organically bound iodine or osmium tetroxide staining has been successfully applied to soft tissues of vertebrates (Johnson et al., 2006; Dorr et al., 2007; de Crespigny et al., 2008; Aggarwal et al., 2009; Metscher, 2009a, 2009bb; Dobrivojević et al., 2013;), as well as invertebrates such as honeybees (Ribi et al., 2008; Greco et al., 2012) and fruit fly larvae (Mizutani et al., 2007).
Here we explore whether micro-CT allows sufficient visualization of brains and specific neuropils in arthropods even though specific labeling of cells or neurotransmitters is not possible. We tested to what extent this technique is suited 1) to analyze the neuroarchitecture in situ; 2) to distinguish specific neuropils; and 3) to obtain quantitative data such as neuropil volumes to facilitate quantitative analyses. To explore limits of resolution, we analyzed the neuroarchitecture of insects of variable sizes ranging from the fruit fly Drosophila hydei to the European hornet Vespa crabro. In addition, we compared effects of different fixatives, media in which samples can be scanned, and drying methods to identify optimal sample preparation protocols. Furthermore, we analyzed the neuroarchitecture of the centipede Scutigera coleoptrata by using micro-CT and compared our results with previous histological and immunohistochemical data from this species.
MATERIALS AND METHODS
Species studied
Drosophila hydei Sturtevant, 1921 (Hexapoda: Diptera)
Specimens of D. hydei (ratite; obtained from Heuschreckenzucht Brunau, Germany) were reared at the department of General and Systematic Zoology (Zoological Institute and Museum, University of Greifswald, Germany). Specimens were anesthetized by using CO2 followed by decapitation, to allow for sufficient penetration of the fixative. Specimens were fixed in Bouin's solution (saturated aqueous picric acid, pure acetic acid, and 10% formaldehyde solution) overnight and subsequently washed in sodium hydrogen phosphate buffer (0.1 M, pH 7.2, 1.8% sucrose). Samples were dehydrated by using a graded ethanol series and incubated in a 1% iodine solution (iodine, resublimated [Carl Roth GmbH + Co. KG, Karlsruhe, Germany; cat. #X864.1] in ≥99.8% ethanol) overnight. After several washing steps in ≥99.8% ethanol, specimens were critical point dried by using the automated dryer Leica EM CPD300 (Leica Microsystems GmbH, Wetzlar, Germany). The drying protocol included slow CO2 admittance with a delay of 120 seconds, 18 exchange cycles (CO2: ≥ 99.8% ethanol), followed by a slow heating process and slow gas discharge. Finally, samples were fixed on an insect pin with glue from a hot glue gun.
Lucilia sp. and Sarcophaga carnaria (Linnaeus, 1758) (Hexapoda: Diptera)
Specimens of Lucilia sp. and S. carnaria were reared at the department of General and Systematic Zoology (Zoological Institute and Museum, University of Greifswald) and used to compare different fixatives as well as the quality of tomography images for samples scanned in ethanol and after subsequent drying. Specimens were anesthetized by using CO2 followed by decapitation. Specimens were fixed in either 70% ethanol, 2.5% buffered glutardialdehyde solution, or Bouin's solution (see above). All samples, except those fixed in ethanol, were washed several times in sodium hydrogen phosphate buffer (0.1 M, pH 7.2, 1.8% sucrose), followed by subsequent dehydration in a graded ethanol series. Finally, samples were stained using a 1% iodine solution (see above).
After incubation overnight, samples were washed several times using ≥99.8% ethanol and transferred into a small vial. The vial was prepared from the narrow part of a 1-ml pipette tip that was fixed on an insect pin with hot glue. The sample was transferred into the vial containing ≥99.8% ethanol. After scanning in ethanol, samples were critical point dried by using a Leica EM CPD300 critical point dryer (see above). In addition, a further specimen of S. carnaria was fixed in Bouin's solution, washed, dehydrated in a graded ethanol series, stained, and processed as described above. Then, the sample was transferred into a vial containing ≥99.8% ethanol to prepare for subsequent transitional series of graded ethanol:hexamethyldisilazane (HMDS; Carl Roth GmbH + Co. KG, cat. #3840) mixtures (2:1; 1:1, 1:2, each for 30 minutes), and finally to pure HMDS (100%). The final transitional step was followed by two additional changes of pure HMDS (30 minutes each), before the vial was uncapped to allow for evaporation and thus sample drying.
Vespa crabro Linnaeus, 1758 (Hexapoda: Hymenoptera)
Specimens of the European hornet were provided by Christoph Kornmilch (Department of Applied Zoology and Nature Conservation, Zoological Institute and Museum, University of Greifswald). Specimens were anesthetized by using CO2 before they were decapitated, fixed in Duboscq–Brazil solution (saturated alcoholic picric acid, 80% ethanol, pure acetic acid, and 10% formaldehyde solution), and dehydrated in a graded ethanol series. After incubation in a 1% iodine solution (see above) overnight and several washing steps in ≥99.8% ethanol, specimens were critical point dried (Leica EM CPD300) and fixed with superglue (Pattex Ultra Gel, Henkel, Duesseldorf, Germany) on an insect pin.
Scutigera coleoptrata (Linnaeus, 1758) (Myriapoda: Chilopoda)
Specimens of S. coleoptrata, which were reared at the department of Cytology and Evolutionary Biology (Zoological Institute and Museum, University of Greifswald), were decapitated, fixed in Bouin's solution (see above), and subsequently dehydrated in a graded ethanol series and incubated in a 1% iodine solution (see above) overnight. After several washing steps in ≥99.8% ethanol, specimens were critical point dried (Leica EM CPD300) and fixed with superglue (Pattex Ultra Gel) on an insect pin.
Optical, laboratory-scale micro-CT
Scans were performed with an Xradia MicroXCT-200 X-ray imaging system (Carl Zeiss Microscopy GmbH). Settings for each specimen and individual scan, including pixel size and scanning times, are summarized in Table 1. Settings were optimized for each specimen, and objectives were chosen according to sample size and region of interest. Samples were scanned in either ≥99.8% ethanol or after drying to detect potential artifacts resulting from the drying procedure. Tomography projections were reconstructed by using the XMReconstructor software (Carl Zeiss Microscopy GmbH), resulting in images stacks (TIFF format). All scans were performed by using Binning 2 (summarizing 4 pixels, resulting in noise reduction) and subsequently reconstructed by using Binning 1 (full resolution) to avoid information loss.
TABLE 1.
Detailed Overview of Species Investigated, Different Fixations and Media Including Scanning Parameters1
| Scan no. | species | Fixative | Medium | Voltage (kV)/power (W) | Current (µA) | Objective lens unit | Pixel size (µm) | Exposure time (sec) |
|---|---|---|---|---|---|---|---|---|
| 1 | Scutigera coleoptrata | Bouin's solution | Air | 20/4 | 200 | 10× | 2.23 | 4.0 |
| 2 | Scutigera coleoptrata | Bouin's solution | Air | 20/4 | 200 | 20× | 1.05 | 1.0 |
| 3 | Vespa crabro | Duboscq–Brasil | Air | 30/6 | 200 | 4× | 6.38 | 10.0 |
| 4 | Vespa crabro | Duboscq–Brasil | Air | 30/6 | 200 | 10× | 2.08 | 3.0 |
| 5 | Lucilia sp. | 70% Ethanol | Ethanol | 30/6 | 200 | 4× | 4.97 | 1.0 |
| 6 | Lucilia sp. | 70% Ethanol | Air | 30/6 | 200 | 4× | 5.29 | 1.0 |
| 7 | Lucilia sp. | 2.5% Glutardialdehyde | Ethanol | 30/6 | 200 | 4× | 5.35 | 1.5 |
| 8 | Lucilia sp. | 2.5% Glutardialdehyde | Air | 30/6 | 200 | 4× | 5.49 | 1.0 |
| 9 | Lucilia sp. | Bouin's solution | Ethanol | 30/6 | 200 | 4× | 5.35 | 1.5 |
| 10 | Lucilia sp. | Bouin's solution | Air | 30/6 | 200 | 4× | 5.49 | 1.0 |
| 11 | Lucilia sp. | Bouin's solution | Air | 30/6 | 200 | 10× | 2.15 | 2.0 |
| 12 | Sarcophaga carnaria | Bouin's solution | Ethanol | 30/6 | 200 | 4× | 5.13 | 1.5 |
| 13 | Sarcophaga carnaria | Bouin's solution | Air | 30/6 | 200 | 4× | 5.49 | 1.0 |
| 14 | Drosophila hydei | Bouin's solution | Air | 30/6 | 200 | 20× | 1.03 | 3.0 |
| 15 | Drosophila hydei | Bouin's solution | Air | 30/6 | 200 | 40× | 0.50 | 9.0 |
All samples were stained using 1% iodine solution. A specific filter was not applied.
3D visualization and quantification
Volume rendering of image stacks was performed by using Amira 5.4.5 and Amira 5.6.0 (FEI Visualization Science Group, Burlington, USA) using the “Volren” or "Voltex" function. Color maps were set to "Gray," and the histograms were adjusted to individual image stacks properties. Additionally, the function "FilteredObliqueSlices" was applied for visualization of specific aspects of the internal organization of brains and neuropil structures. We implemented 3D surface renderings of all major neuropils of V. crabro, Luclia sp., and D. hydei into pdf files using Fiji software (http://fiji.sc/Fiji). To that end, we converted corresponding Virtual Reality Modeling Language files (.wrl) of corresponding neuropils and the entire brain using the “VRML Export” module of Amira 5.6.0 and subsequently imported these files into Deep Exploration 5.5 (SAP VEA distributed by SAP, Walldorf, Germany). Finally, we exported a.u3d file for each brain atlas with a given hierarchy, which can be imported into pdf files using the 3D tool of Adobe Acrobat (Adobe Systems Inc., San José, CA, USA. (Please, click on the pdf file in Figures 2C and E and 3A to activate the virtual content and then use the mouse to rotate the objects. Use the menu in the activated figure for further functions.) Exemplary quantitative data were obtained after segmentation of the antennal lobes of D. hydei using the “MaterialStatistic” tool in Amira 5.6.0. Here, the total numbers of voxels of the left and right antennal lobe were measured, followed by calculation of the total volume based on pixel to µm ratio.
Figure 2.

Volume rendering (voltex rendering) and virtual cross sections of the head and brain of the fruit fly Drosophila hydei. A: Frontal and lateral view of the head. Lateral view with virtual oblique section through the compound eye and optic neuropils. Please click in the pdf file on this figure to activate the virtual content and then use the mouse to rotate the objects. Use the menu in the activated figure for further functions. B: Virtual cross section of the brain illustrating the central complex and optic neuropils. C: Higher magnification showing the antennal lobes and the vertical lobes of the mushroom bodies (40× objective; virtual cross section). The asterisk marks a concentration of somata. D: Higher magnification showing the central complex (40× objective; virtual cross section). Vertical subdivisions of the fan-shaped body are visible. E: Virtual horizontal section showing the innervation of antennal afferents into the deutocerebrum. Abbreviations: AL, antennal lobe; An, antenna; Ar, arista; CE, compound eye; EB, ellipsoid body; Es, esophagus; FB, fan-shaped body; Gl, glomeruli; Gng, gnathal ganglia; La, lamina; Lo, lobula; LoP, lobula plate; Me, medulla; MxP, maxillary palp; Oc, ocellus; Re, retina; VL, vertical lobe; *, accumulation of somata. Scale bar = 200 µm in A; 100 µm in B; 50 µm in C–E.
Figure 3.
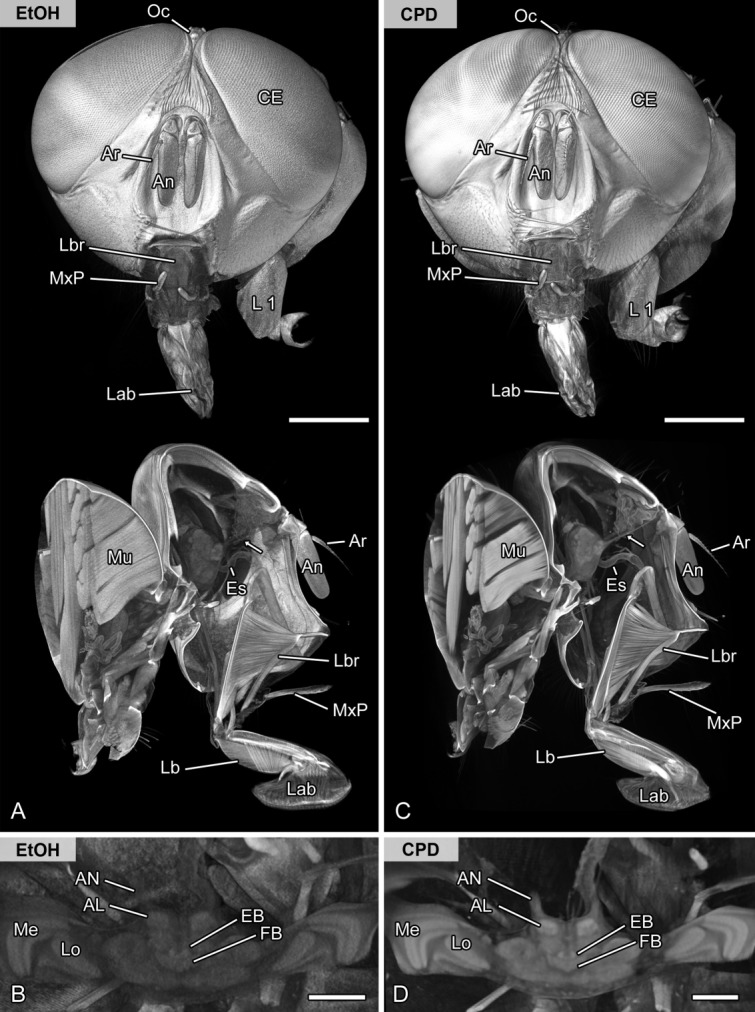
Methodological evaluation of different media (ethanol vs. air). Volume rendering (voltex rendering) and virtual sections of the head and brain of the same specimen of the blow fly Lucilia sp. scanned in ethanol (A,B) and after critical point drying (C,D). A,C: Frontal and sagittal representation of the blow fly head. Externally, the critical point dried sample results in less noise and consequently more details. Internally, structures such as the antennal nerve (arrow) and the antennal lobe are better resolved. B,D: Virtual horizontal sections of the brain illustrating the central complex and optic neuropils. The signal to noise ratio is also higher in the critical point dried sample. Abbreviations: AL, antennal lobe; An, antenna; AN, antennal nerve; Ar, arista; CE, compound eye; CPD, scanned after critical point drying; EB, ellipsoid body; Es, esophagus; EtOH, scanned in pure ethanol; FB, fan-shaped body; L1, thoracic leg 1; Lab, labellum; Lb, labium; Lbr, labrum; Lo, lobula; Me, medulla; Mu, musculature of the thorax; MxP, maxillary palp; Oc, ocellus. Scale bar = 1 mm in A,C; 200 µm in B,D.
Terminology
For the hexapod brain, the neuroanatomical terminology proposed by Ito et al. (2014) is used. However, it cannot be applied completely for the centipede S. coleoptrata, as the neuroanatomical terminology for Chelicerata, Myriapoda, and Crustacea differs from that of Hexapoda (compare Richter et al., 2010; Loesel et al., 2013). For example, the hexapod antennal lobe is called the “olfactory lobe” in Crustacea and Myriapoda, and the homologous neuropil of the myriapod medulla is still a matter of debate (Strausfeld, 2005; Loesel et al., 2013). Bilaterally paired deutocerebral neuropils processing mechanosensory input from the first antennae are called the antennal mechanosensory and motor center (AMMC) in Hexapoda, lateral antenna 1 neuropil (LAN) in Crustacea, and corpus lamellosum in Myriapoda (Sombke et al., 2012; Loesel et al., 2013).
RESULTS
Micro-CT to investigate arthropod neuroanatomy
We analyzed the brain architecture in representatives of three insect species (Fig. 1A) whose brain sizes ranged from several millimeters (Lucilia sp., V. crabro) down to a few hundred micrometers (D. hydei). Volume reconstructions of the head of V. crabro allowed identification and differentiation of brain neuropils, e.g., the optic neuropils, neuropils of the central complex, and the mushroom bodies (Figs. 1B,C). Likewise, the numerous, spherical glomeruli of the antennal lobes were evident (Figs. 1C,D). The same level of information was achieved for the blow fly, Lucilia sp. (Figs. 1E,F). The brain of D. hydei (brain width of ∼600 µm) is tiny in comparison with the hornet and the blow fly (Figs. 1A, 2A). However, virtual sections of volume reconstructions of D. hydei allowed us to distinguish and identify synapse-rich neuropils (such as, for example, the optic neuropils or glomeruli of the antennal lobes) and provided detailed information on their neuroarchitecture (Figs. 2A–C). Imaging at the maximum resolution (Table1, pixel size ∼500 nm, Binning 2) elucidated further details on the organization of the fan-shaped body, which is composed of several vertical subunits (Fig. 2D), as well as individual glomeruli that form the antennal lobe (Fig. 2E).
Figure 1.

Volume rendering (voltex rendering) and virtual cross sections of three selected insect taxa. A: Volume reconstruction of the heads of the European hornet Vespa crabro (1), the blow fly Lucilia sp. (2), and the fruit fly Drosophila hydei (3). B: Virtual cross section of the head of V. crabro illustrating of the nervous system within the head capsule. C,D: Higher magnification of the brain of V. crabro (10× objective; virtual cross section) showing the calyces of the mushroom bodies, the central complex, and glomeruli within the antennal lobe. Please click in the pdf file on C to activate the virtual content and then use the mouse to rotate the objects. Use the menu in the activated figure for further functions. E,F: Virtual cross sections of the head of Lucilia sp. focusing on the neuroarchitecture. Please click in the pdf file on E to activate the virtual content and then use the mouse to rotate the objects. Use the menu in the activated figure for further functions. F: Higher magnification of the antennal lobes showing single glomeruli. Abbreviations: AL, antennal lobe; An, antenna; CC, central complex; CE, compound eye; Clp, clypeus; Es, esophagus; Fr, frons; Gl, glomeruli; Lo, lobula; Md, mandible; MB, mushroom body; Me, medulla; Oc, ocellus; Re, retina. Scale bar = 1 mm in A,B; 300 µm in C; 200 µm in D,F; 500 µm in E.
Although individual neurons, the somata of which are located in the periphery of the brain, could not be traced, it was possible to identify clusters of somata (Figs. 2C–E; asterisks). We further quantified the volume of the overall brain, as well as certain neuropils such as the antennal lobe, or the optic neuropils, which was calculated based on micro-CT data (a summary of these volumes is given in Table 2). The optic neuropils that include lamina, medulla, lobula, and lobula plate, represented a prominent portion of the brain in all three species investigated (∼20% in V. crabro and D. hydei), and those of Lucilia sp. occupied almost half of the entire brain volume (∼46%). In contrast, the antennal lobes of all three species investigated were rather small. Here, the volume of each antennal lobe was about 150,000 µm3 in D. hydei (0.9% of the overall brain volume), 3,400,000 µm3 in Lucilia sp. (0.4% of overall brain volume), and 27,600,000 µm3 (0.6% of the overall brain volume).
TABLE 2.
Volume Measurements of the Brain and Selected Neuropils Calculated on the Basis of Micro-CT Data1
| Volume | |||
|---|---|---|---|
| Brain2 | Antennal lobe | Optic neuropils3 | |
| Vespa crabro | ∼4.230 mm3 | ∼0.02760 mm3 | ∼0.4370 mm3 |
| Lucilia sp. | ∼0.820 mm3 | ∼0.00340 mm3 | ∼0.1950 mm3 |
| Drosophila hydei | ∼0.016 mm3 | ∼0.00015 mm3 | ∼0.0015 mm3 |
Volumes of neuropils correspond to one antennal lobe, and optic neuropils of one hemisphere of the brain.
Including optic neuropils.
Comprising lamina, medulla, lobula, and lobula plate.
Optimal sample preparation
We used different fixatives that are commonly used for histological analysis (70% ethanol, 2.5% glutardialdehyde, and Bouin's solution) to determine the optimal sample preparation (Table3). Fixation in ethanol resulted in good signal-to-noise ratio, as well as sufficient soft-tissue contrast, whereas samples treated with buffered glutardialdehyde solution provided inferior results (Table3). In the latter medium, neither fixation nor contrast was sufficient to extract meaningful neuroanatomical information (data not shown). We obtained the best soft-tissue contrast using Bouin's solution (Table3, Figs. 3, 4). Volume reconstructions of the head, as well as virtual sections, allow detailed descriptions of 1) in situ coherence of the musculature, alimentary system, and nervous system and 2) distinct neuropils, such as the optic neuropils and glomeruli of the antennal lobe.
TABLE 3.
Comparison of Different Sample Fixations and Preparations1
| Preliminaries | 1. Scan (in pure ethanol) | 2. Scan (dried) | |||||
|---|---|---|---|---|---|---|---|
| Fixative | Fixation quality | Exp. time (sec) | Contrast (nervous tissue) | Drying method | Exp. time (sec) | Contrast (nervous tissue) | Comments (artifacts affected by drying procedure) |
| 2.5% Glutardialdehyde | − | 1.5 | Low | CPD | 1.0 | High | Disruption of retinal and parts of the central nervous system |
| 70% Ethanol | + | 1.0 | Low | CPD | 1.0 | High | Slight shrinkage of nervous tissue and musculature |
| Bouin's solution | ++ | 1.5 | Medium | CPD | 1.0 | High | No obvious shrinkage or disruption |
| Bouin's solution | ++ | 1.5 | Medium | HMDS | 1.0 | High | Central nervous system disrupted and shrunken |
All samples were stained using 1% iodine solution. −, overall appearance of nervous tissue is poor; +, overall appearance of nervous tissue is sufficient; ++, overall appearance of nervous system is suitable.
Abbreviations: CPD, critical point drying; HMDS, hexamethyldisilazane.
Figure 4.
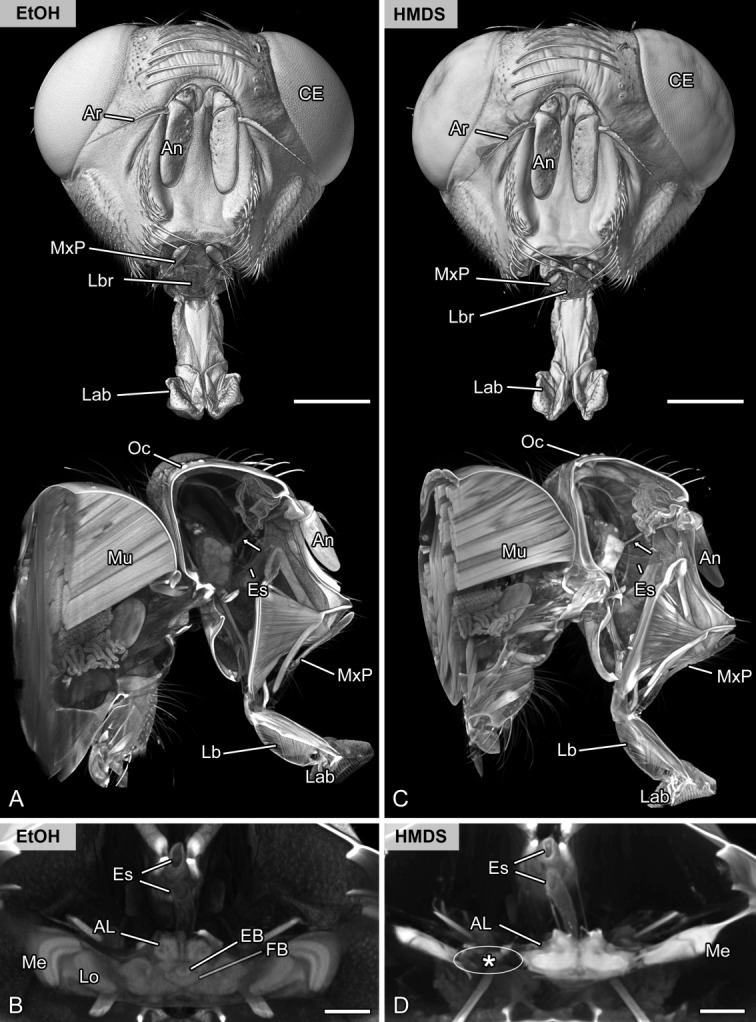
Methodological evaluation of chemical drying. Volume rendering (voltex rendering) and virtual sections of the head and brain of the same specimen of the flesh fly Sarcophaga carnaria scanned in ethanol (A,B) and after chemical drying using HMDS (C,D). A,C: Frontal and oblique sagittal representation. Externally, both volume renderings show nearly equal quality. Internally, the signal to noise ratio is higher after chemical drying using HMDS (compare antennal nerve marked by arrow). However, the brain was highly affected, as indicated by enormous shrinkage artifacts. B,D: Virtual horizontal sections of the brain showing the central complex and optic neuropils. Although the signal to noise ratio is higher in the HMDS sample, internal features of the brain are not accessible. Note the high amount of shrinkage and disruption of the optic neuropils (asterisk) after HMDS treatment. Abbreviations: AL, antennal lobe; An, antenna; Ar, arista; CE, compound eye; EB, ellipsoid body; Es, esophagus; EtOH, scanned in pure ethanol; HMDS, scanned after chemically drying using hexamethyldisilazane; FB, fan-shaped body; Lab, labellum; Lb, labium; Lbr, labrum; Lo, lobula; Me, medulla; Mu, musculature of the thorax; MxP, maxillary palp; Oc, ocellus. Scale bar = 1 mm in A,C; 200 µm in B,D.
Soft-tissue contrast and thus the level of neuroanatomical details strongly increased after critical point drying of the samples (Fig. 3; compare A,B with C,D), which allowed us to clearly identify small nerves and distinguish certain neuropils. However, we detected minor shrinkage artifacts in muscle tissue (compare virtual sections in Figs. 3A with C). In contrast, chemical drying using HMDS caused a dented cuticle and had negative effects on tissue representation and the fine structure of the nervous system (compare Figs. 4A,B with C,D). After HMDS treatment, the nervous system was not only subject to extensive shrinkage, but was also disrupted during the drying process (compare Fig. 4B with D).
DISCUSSION
General remarks
Our data demonstrate that micro-CT facilitates investigating the nervous system of even small arthropods in great detail and thus provides a promising extension of the methodological spectrum used in studies on arthropod neuroanatomy. Virtual sections of the head of a wasp and honey bee that depicted neuroanatomical information have already been published by Metscher (2013) and Ribi et al. (2008). Our study of the European hornet and the blow fly corroborates that detailed information on the architecture of the brain can be achieved by micro-CT analyses. In addition, we showed that micro-CT analyses are even suitable for analysis of neuropils within the tiny brain of Drosophila. A comprehensive understanding of the arthropod neuroanatomy depends on broad reference systems such as 3D brain atlases. Detailed descriptions of brain neuropils and even individual neurons are available for Drosophila, as are virtual standard brain atlases (Vosshall et al., 2000; Rein et al., 2002; Cardona et al., 2010; Peng et al., 2011; Ito et al., 2014) and specific databases (e.g., http://www.virtualflybrain.org).
The generation of such atlases is traditionally based on serial sectioning or whole-mounts of dissected brains. However, this is a time-consuming procedure prone to artifacts (e.g., section loss, distortion, staining, or labeling artifacts). The sectioning process itself disrupts the tissue continuity, resulting in local tissue deformations that have to be removed in subsequent, complex alignment procedures (Saalfeld et al., 2012). Nevertheless, systematic compression and distortion, which are typically induced while cutting (Hayat, 2000), as well as z-axis compression, can cause serious problems in subsequent extraction of 3D information (Gardella et al., 2003; Kubota et al., 2009). We were able to show that noninvasive approaches such as micro-CT are suitable for establishing a broad reference system for arthropod brains and thus for generating 3D virtual brain atlases (see virtual content of Figs. 1B,C, 2A). Moreover, we suggest that noninvasive approaches such as micro-CT are likely to more accurately reflect the spatial arrangement of certain neuropils compared with invasive techniques and should therefore be favored for establishing brain atlases.
Volumetric analysis
Quantification (i.e., volume measurements) in general aims at achieving objectivity and comparability, but the accuracy of quantified data is certainly influenced by multiple factors including intra- and interoperator precision variability, as well as manual segmentation errors. Moreover, in histology, precise quantification is often limited by sample preparation that involves, for example, tissue shrinkage and deformation. Possible shrinkage artifacts are caused by fixation and dehydration procedures (Gusnard and Kirschner, 1977; Hayat, 1981; Fox et al., 1985; Bucher et al., 2000; Ott, 2008). The effect of sample preparation on volume shrinkage of rabbit bone, brain, and muscle was recently investigated by Buytaert et al. (2014) and revealed remarkable volume losses (up to ∼66% for isolated vertebrate brain tissue). Likewise, Grabe et al. (2015) revealed notable volume decreases of about 43% of the antennal lobe of D. melanogaster caused by dissection and fixation.
We quantified the volume of the antennal lobe of D. hydei to compare for volumetric data obtained in our approach (fixed, dehydrated, and critical point dried) and to test whether this technique is suitable for extracting volumetric data even from the brain of the smallest insect investigated here. We calculated a volume of approximately 150,000 µm3 for each antennal lobe of D. hydei, which corresponds to 0.9% of the entire brain volume (including optic neuropils). This is somewhat larger than the calculated volumetric range of 120,000–140,000 µm3 of dissected and fixed D. melanogaster brains provided by Grabe et al. (2015). However, Grabe et al. (2015) further calculated the volume of the antennal lobe of living D. melanogaster (mean of in vivo approach ∼210,000 µm3) to compare for volumetric differences caused by sample preparation. Thus, our data further confirm a considerable volume decrease. However, in vivo imaging is highly challenging and often restricted to genetically modified model organisms. Thus, sample preparations that involve chemical fixation of soft tissue are so far the only feasible application for a broad, comparative approach that involve nonmodel species. In this respect, noninvasive approaches such as micro-CT that maintain the overall natural coherence of organ systems should be favored over destructive approaches, at least to minimize subsequent artifacts. Furthermore, if possible, we advise the provision of relative and absolute measurements that correct for size-dependent misinterpretations and thus allow for a meaningful inter- and intraspecific comparison.
Optimal sample preparation
Metscher (2009a) suggested that sample preparation should follow the protocol that provides the best histological result for a given species. We obtained the best tissue fixation by using Bouin's solution and the best soft tissue contrast after drying. To evaluate the degree of tissue transformations caused by the drying process, all samples were scanned twice, first in ≥99.8% ethanol and then after drying. In our approach, critical point drying prevented unfavorable effects on surface appearance, internal tissue formation, and fine structure of the nervous system, in contrast to the previous ethanol scan of the same sample. However, in addition to critical point drying, we tested chemical drying by using HMDS. Drying by evaporation of HMDS is generally considered to be comparable to critical point drying (Bray et al., 1993; Hazrin-Chong and Manefield, 2012), which is considered appropriate to treat delicate and soft tissue such as, for example, hepatic endothelial cells for scanning electron microscopy and even transmission electron microscopy (Braet et al., 1996). Our comparison of both methods demonstrated that critical point drying of samples is the most appropriate method when the arthropod nervous system is investigated with micro-CT.
Micro-CT in comparison with classical approaches in arthropod neuroanatomy
To compare the suitability of micro-CT with conventional approaches in arthropod neuroanatomy, we analyzed neuroanatomical features of the common house centipede, S. coleoptrata, by using classical (invasive) neuroanatomical (Sombke et al., 2011,2012), as well as synchrotron-based approaches (Fanenbruck et al., 2001). However, in comparison with the early synchrotron-based data shown by Fanenbruck et al. (2001), technical enhancements of our micro-CT approach are evident at the level of resolution and sensitivity. In virtual and inverted sections through the head of S. coleoptrata, the nervous system stands out in brighter tonalities, whereas musculature and cuticular elements appear darker based on the different density of the structures (Figs. 5A,C). Images from single orthogonal virtual sections are equally detailed compared with images taken from histological sections or from specimens labeled using immunohistochemical techniques at comparable magnifications (Figs. 5A–D). At this level of magnification, micro-CT, for example, visualizes the two optic neuropils within the lateral protocerebrum nearly as clearly as fluorescence microscopy after labeling against synaptic proteins (compare Fig. 5A with B; yellow channel). Within the centipede deutocerebrum, micro-CT and classical histology likewise lead to identification of the olfactory lobes (= antennal lobes in hexapods) composed of elongated olfactory glomeruli (Sombke et al., 2011,2012), because these dense synaptic regions are highly contrasted by both methods (compare Fig. 5C with D; asterisks). Moreover, single larger somata in between the deuto- and tritocerebrum are clearly visible (Figs. 5C,D, arrowheads). The corpus lamellosum, the presumptive deutocerebral mechanosensory neuropil in Myriapoda (Sombke et al., 2012), is well resolved in virtual cross sections. It is characterized by its arrangement of eight parallel lamellae, with outer lamellae forming a loop and inner lamellae projecting contralaterally. Figure 6 compares visualizations of the corpus lamellosum obtained by micro-CT (Fig. 6A) with different histological and immunohistochemical methods, demonstrating that the level of contrast, resolution, and detail of micro-CT is comparable to that of light microscopic methods. However, the lamellae show a slightly finer texture in semithin sections (1 µm) of a plastic-embedded specimen visualized by brightfield microscopy (Fig. 6B). Labeling with fluorescent phalloidin, a probe for filamentous actin, also visualizes these lamellae (Fig. 6D). The combination of visualizations (Figs. 5, 6) clearly shows that micro-CT results in detailed and accurate visualization of arthropod brain neuropils and gives profound insights into spatial arrangements and dimensions.
Figure 5.

Comparison of methods in arthropod neuroanatomy as exemplified for the house centipede Scutigera coleoptrata I. A,B: Horizontal sections of the head in approximately the same orientation. A: Inverted virtual section illustrating the protocerebrum with optic neuropils and head musculature. B: Vibratome section (structured illumination fluorescence microscopy). Green, synapsin immunoreactivity; red, labeling against f-actin; blue, labeling against nuclei. C,D: Cross sections of the right deutocerebral hemisphere with olfactory glomeruli (dense synaptic profiles) both magnified from a 4× overview (inset in D from light microscopy) Single larger somata between deuto- and tritocerebrum are clearly visible (arrowheads). B and D modified after Sombke et al. (2011). Abbreviations: AN, antennal nerve; CE, compound eye; diMu, dilator muscles of the pharynx; Es, esophagus; FC, frontal connective; fLM, fluorescence microscopy; La, lamina; LM, light microscopy; Me, medulla; micro-CT, micro-computed tomography; Mu, musculature; OL, olfactory lobe; PC, protocerebrum; TC, tritocerebrum. Scale bar = 500 µm in A,B; 100 µm in C.D.
Figure 6.
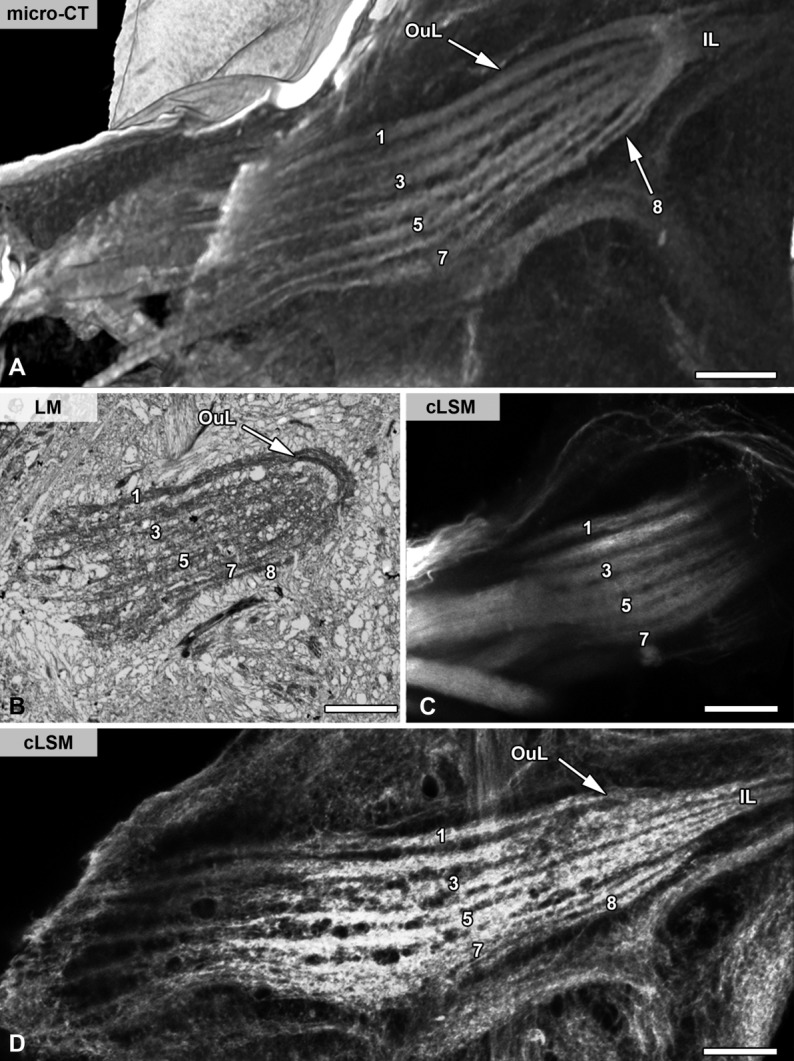
Comparison of methods in arthropod neuroanatomy as exemplified for the house centipede Scutigera coleoptrata II. The corpus lamellosum, which is composed of eight lamellae, visualized according to different methods. A: Virtual volume reconstruction from micro-CT. B: Histological cross section (1.5 µm) stained with 1% toluidine blue. C: Anterograde backfill with dextran-biotin. D: Phalloidin labeling (80-µm Vibratome section). B–D modified after Sombke et al. (2011). Note that neuropil sizes may vary as adult centipedes molt and grow throughout their perennial adult life. Abbreviations: cLSM, confocal laser scanning microscopy; Il, inner lamellae; LM, light microscopy; micro-CT, micro-computed tomography; Oul, outer lamellae. Scale bar = 50 µm in A–D.
CONCLUSIONS AND FUTURE DIRECTIONS
We demonstrate that micro-CT is very well suited for analysis of overall arthropod neuroanatomy. Due to fast processing time, we also consider this technique to be extremely potent when it comes to large-scale analyses of general neuroarchitecture including phenotypic variation within and between populations and species. Moreover, quantitative volume data of the antennal lobe of D. hydei correspond with volumetric data obtained with other noninvasive approaches in D. melanogaster such as cLSM. Thus, we conclude that micro-CT allows comparative quantitative analyses with little size-dependent limitations. However, the resolution and image quality obtained depend not only on the tomographic system and settings (e.g., high or low voltage) and specimen size, but also on the preparation methods. Our study suggests a preferable treatment of samples for micro-CT studies of arthropod neuroanatomy. We would like to note that sample preparations are validated for the species used in this study, as well as other representatives of centipedes, xiphosurans, decapod crustaceans, and a variety of spider taxa (A.S., E.L., and P.M., unpublished data).
Micro-CT will not replace, but will supplement selective staining methods such as immunohistochemistry for neurotransmitters, intracellular injections, and backfills. Micro-CT will be especially useful for obtaining volumetric data from arthropod brains. Furthermore, this noninvasive technique allows subsequent histological analyses of the same specimen as well as investigation of the internal anatomy of precious type material from museum collections. This method also has the potential for rapid analysis of the brains of diverse and rare nonmodel arthropods, thus promoting comparative neuroanatomical approaches in an evolutionary framework (Harzsch, 2006; Strausfeld and Andrew, 2011).
Acknowledgments
The authors thank Christoph Kornmilch and Gerald Kerth (both from the Zoological Institute and Museum, University of Greifswald, Germany) for providing specimens of the European hornet, Ewald Grosse-Wilde (Max Planck Institute for Chemical Ecology, Jena, Germany) for helpful support, and Jörg U. Hammel (Helmholtz Zentrum Geestacht, Hamburg, Germany) for valuable discussions. We also thank two anonymous reviewers for their helpful comments on the manuscript.
CONFLICT OF INTEREST STATEMENT
The authors have no conflicts of interests.
ROLE OF AUTHORS
All authors had full access to all the data in the study and take responsibility for the integrity of the data and the accuracy of the data analysis. Study concept and design: AS, EL, SH. Acquisition of data: AS, EL. Analysis and interpretation of data: AS, EL, SH. Wrote the manuscript: AS, EL. Contributed to the writing of the manuscript: GU, PM, SH. Obtained funding: GU, PM, SH.
LITERATURE CITED
- Aggarwal M, Zhang J, Miller MI, Sidman RL, Mori S. Magnetic resonance imaging and micro-computed tomography combined atlas of developing and adult mouse brains for stereotaxic surgery. Neuroscience. 2009;162:1339–1350. doi: 10.1016/j.neuroscience.2009.05.070. [DOI] [PMC free article] [PubMed] [Google Scholar]
- Betz O, Wegst U, Weide D, Heethoff M, Helfen L, Lee W-K, Cloetens P. Imaging applications of synchrotron X-ray phase contrast microtomography and biomaterials science. I. General aspects of the technique and its advantages in the analysis of millimetre-sized arthropod structures. J Microsc. 2007;227:51–71. doi: 10.1111/j.1365-2818.2007.01785.x. [DOI] [PubMed] [Google Scholar]
- Beutel RG, Friedrich F, Whiting MF. Head morphology of Caurinus (Boreidae, Mecoptera) and its phylogenetic implications. Arthropod Struct Dev. 2008;37:418–433. doi: 10.1016/j.asd.2008.02.002. [DOI] [PubMed] [Google Scholar]
- Braet F, de Zanger R, Wisse E. Drying cells for SEM, AFM and TEM by hexamethyldisilazane: a study on hepatic endothelial cells. J Microsc. 1996;186:84–87. doi: 10.1046/j.1365-2818.1997.1940755.x. [DOI] [PubMed] [Google Scholar]
- Brandt R, Rohlfing T, Rybak J, Krofczik S, Maye A, Westerhoff M, Hege HC, Menzel R. Three-dimensional average-shape atlas of the honeybee brain and its applications. J Comp Neurol. 2005;492:1–19. doi: 10.1002/cne.20644. [DOI] [PubMed] [Google Scholar]
- Bray DF, Bagu J, Koegler P. Comparison of hexamethyldisilazane (HMDS), Peldri II, and critical-point drying methods for scanning electron microscopy of biological specimens. Microsc Res Techniq. 1993;26:489–495. doi: 10.1002/jemt.1070260603. [DOI] [PubMed] [Google Scholar]
- Bucher D, Scholz M, Stetter M, Obermayer K, Pflüger H-J. Correction methods for three-dimensional reconstructions from confocal images: I. Tissue shrinking and axial scaling. J Neurosci Methods. 2000;100:135–143. doi: 10.1016/s0165-0270(00)00245-4. [DOI] [PubMed] [Google Scholar]
- Buytaert J, Goyens J, De Greef D, Aerts P, Dirckx J. Volume shrinkage of bone, brain and muscle tissue in sample preparation for micro-CT and light sheet fluorescence microscopy (LSFM) Microsc Microanal. 2014;20:1208–1217. doi: 10.1017/S1431927614001329. [DOI] [PubMed] [Google Scholar]
- Cardona A, Saalfeld S, Preibisch S, Schmid B, Cheng A, Pulokas J, Tomancak P, Hartenstein V. An integrated micro- and macroarchitectural analysis of the Drosophila brain by computer-assisted serial section electron microscopy. PLoS Biol. 2010;8:e100502. doi: 10.1371/journal.pbio.1000502. [DOI] [PMC free article] [PubMed] [Google Scholar]
- de Crespigny A, Bou-Reslan H, Nishimura MC, Phillips H, Carano RA, D'Arceuil HE. 3D micro-CT imaging of the postmortem brain. J Neurosci Methods. 2008;171:207–213. doi: 10.1016/j.jneumeth.2008.03.006. [DOI] [PMC free article] [PubMed] [Google Scholar]
- Dobrivojević M, Bohaček I, Erjavec I, Gorup D, Gajović S. Computed microtomography visualization and quantification of mouse ischemic brain lesion by nonionic radio contrast agents. Croat Med J. 2013;54:3–11. doi: 10.3325/cmj.2013.54.3. [DOI] [PMC free article] [PubMed] [Google Scholar]
- Dorr A, Sled JG, Kabani N. Three-dimensional cerebral vasculature of the CBA mouse brain: a magnetic resonance imaging and micro computed tomography study. Neuroimage. 2007;35:1409–1423. doi: 10.1016/j.neuroimage.2006.12.040. [DOI] [PubMed] [Google Scholar]
- Dreyer D, Vitt H, Dippel S, Goetz B, El Jundi B, Kollmann M, Huetteroth W, Schachtner J. 3D standard brain of the red flour beetle Tribolium castaneum: a tool to study metamorphic development and adult plasticity. Front Syst Neurosci. 2010;4:3. doi: 10.3389/neuro.06.003.2010. [DOI] [PMC free article] [PubMed] [Google Scholar]
- El Jundi B, Huetteroth W, Kurylas AE, Schachtner J. Anisometric brain dimorphism revisited: implementation of a volumetric 3D standard brain in Manduca sexta. J Comp Neurol. 2009;517:210–225. doi: 10.1002/cne.22150. [DOI] [PubMed] [Google Scholar]
- Fanenbruck M, de Carlo F, Mancini DC. Evaluating the advantage of X-ray microtomography in microanatomical studies of small arthropods. APS Activity Reports. Argonne, IL: Argonne National Laboratory; 2001. [Google Scholar]
- Fox CH, Johnson FB, Whiting J, Roller PP. Formaldehyde fixation. J Histochem Cytochem. 1985;33:845–853. doi: 10.1177/33.8.3894502. [DOI] [PubMed] [Google Scholar]
- Friedrich F, Beutel RG. Micro-computer tomography and a renaissance of insect morphology. Proc SPIE. 2008;7078:70781U1–70781U6. [Google Scholar]
- Friedrich F, Pohl H, Beckmann F, Beutel RG. The head of Merope tuber (Meropeidae) and the phylogeny of Mecoptera (Hexapoda) Arthropod Struct Dev. 2013;42:69–88. doi: 10.1016/j.asd.2012.09.006. [DOI] [PubMed] [Google Scholar]
- Galizia CG, McIlwrath SL, Menzel R. A digital three-dimensional atlas of the honeybee antennal lobe based on optical sections acquired by confocal microscopy. Cell Tissue Res. 1999;295:383–394. doi: 10.1007/s004410051245. [DOI] [PubMed] [Google Scholar]
- Gardella D, Hatton WJ, Rind HB, Rosen GD, von Bartheld CS. Differential tissue shrinkage and compression in the z-axis: implications for optical disector counting in vibratome-, plastic- and cryosections. J Neurosci Methods. 2003;124:45–59. doi: 10.1016/s0165-0270(02)00363-1. [DOI] [PubMed] [Google Scholar]
- Grabe V, Strutz A, Baschwitz A, Hansson BS, Sachse S. A digital in vivo 3D atlas of the antennal lobe of Drosophila melanogaster. J Comp Neurol. 2015;523:530–544. doi: 10.1002/cne.23697. [DOI] [PubMed] [Google Scholar]
- Greco MK, Tong J, Soleimani M, Bell D, Schafer MO. Imaging live bee brains using minimally-invasive diagnostic radioentomology. J Insect Sci. 2012;12:89. doi: 10.1673/031.012.8901. [DOI] [PMC free article] [PubMed] [Google Scholar]
- Gusnard D, Kirschner RH. Cell and organelle shrinkage during preparation for scanning electron microscopy: effects of fixation, dehydration and critical point drying. J Microsc. 1977;110:51–57. doi: 10.1111/j.1365-2818.1977.tb00012.x. [DOI] [PubMed] [Google Scholar]
- Harzsch S. Neurophylogeny: architecture of the nervous system and a fresh view on arthropod phylogeny. Integr Comp Biol. 2006;46:162–194. doi: 10.1093/icb/icj011. [DOI] [PubMed] [Google Scholar]
- Hayat MA. Fixation for electron microscopy. New York: Academic Press; 1981. [Google Scholar]
- Hayat MA. Sectioning. In: Hayat MA, editor. Principles and techniques of electron microscopy: biological applications. 4th ed. Cambridge, UK: Cambridge University Press; 2000. pp. 139–210. [Google Scholar]
- Hazrin-Chong NH, Manefield M. An alternative SEM drying method using hexamethyldisilazane (HMDS) for microbial cell attachment studies on sub-bituminous coal. J Microbiol Methods. 2012;90:96–99. doi: 10.1016/j.mimet.2012.04.014. [DOI] [PubMed] [Google Scholar]
- Hörnschemeyer T, Beutel RG, Pasop F. Head structures of Priacma serrata Leconte (Coleptera, Archostemata) inferred from X-ray tomography. J Morphol. 2002;252:298–314. doi: 10.1002/jmor.1107. [DOI] [PubMed] [Google Scholar]
- Hsieh JH. Computed tomography principles, design, artifacts, and recent advances. Bellingham, WA: SPIE Press; 2003. p. 510. [Google Scholar]
- Huetteroth W, Schachtner J. Standard three-dimensional glomeruli of the Manduca sexta antennal lobe: a tool to study both developmental and adult neuronal plasticity. Cell Tissue Res. 2005;319:513–524. doi: 10.1007/s00441-004-1016-1. [DOI] [PubMed] [Google Scholar]
- Huetteroth W, El Jundi B, El Jundi S, Schachtner J. 3D-reconstructions and virtual 4D-visualization to study metamorphic brain development in the sphinx moth Manduca Sexta. Front Syst Neurosci. 2010;4:7. doi: 10.3389/fnsys.2010.00007. [DOI] [PMC free article] [PubMed] [Google Scholar]
- Ito K, Shinomiya K, Ito M, Armstrong JD, Boyan G, Hartenstein V, Harzsch S, Heisenberg M, Homberg U, Jenett A, Keshishian H, Restifo LL, Rossler W, Simpson JH, Strausfeld NJ, Strauss R, Vosshall LB. A systematic nomenclature for the insect brain. Neuron. 2014;81:755–765. doi: 10.1016/j.neuron.2013.12.017. [DOI] [PubMed] [Google Scholar]
- Johnson JT, Hansen MS, Wu I, Healy LJ, Johnson CR, Jones GM, Capecchi MR, Keller C. Virtual histology of transgenic mouse embryos for high-throughput phenotyping. PLoS Genet. 2006;2:e61. doi: 10.1371/journal.pgen.0020061. [DOI] [PMC free article] [PubMed] [Google Scholar]
- Kalender WA. Computed tomography: fundamentals, system technology, image quality, applications. Munich. Germany: Publicis; 2005. [Google Scholar]
- Kubota Y, Hatada SN, Kawaguchi Y. Important factors for the three-dimensional reconstruction of neuronal structures from serial ultrathin sections. Front Neural Circuits. 2009;3:4. doi: 10.3389/neuro.04.004.2009. [DOI] [PMC free article] [PubMed] [Google Scholar]
- Kurylas AE, Rohlfing T, Krofczik S, Jenett A, Homberg U. Standardized atlas of the brain of the desert locust, Schistocerca gregaria. Cell Tissue Res. 2008;333:125–145. doi: 10.1007/s00441-008-0620-x. [DOI] [PubMed] [Google Scholar]
- Loesel R, Wolf H, Kenning M, Harzsch S, Sombke A. Architectural principles and evolution of the arthropod nervous system. In: Minelli A, Boxshall G, Fusco G, editors. Arthropod biology and evolution—molecules, development, morphology. Berlin: Springer; 2013. pp. 299–342. [Google Scholar]
- Metscher BD. MicroCT for comparative morphology: simple staining methods allow high-contrast 3D imaging of diverse non-mineralized animal tissues. BMC Physiol. 2009a;9:11. doi: 10.1186/1472-6793-9-11. [DOI] [PMC free article] [PubMed] [Google Scholar]
- Metscher BD. MicroCT for developmental biology: a versatile tool for high-contrast 3D imaging at histological resolutions. Dev Dyn. 2009b;238:632–640. doi: 10.1002/dvdy.21857. [DOI] [PubMed] [Google Scholar]
- Metscher BD. Biological applications of X-ray microtomography: imaging microanatomy, molecular expression and organismal diversity. Microsc Anal. 2013;27:13–16. [Google Scholar]
- Mizutani R, Takeuchi A, Hara T, Uesugi K, Suzuki Y. Computed tomography imaging of the neuronal structure of Drosophila brain. J Synchrotron Radiat. 2007;14:282–287. doi: 10.1107/S0909049507009004. [DOI] [PubMed] [Google Scholar]
- Mizutani R, Takeuchi A, Akamatsu G, Uesugi K, Suzuki Y. Element-specific microtomographic imaging of Drosophila brain stained with high-Z probes. J Synchrotron Radiat. 2008a;15:374–377. doi: 10.1107/S0909049508003725. [DOI] [PubMed] [Google Scholar]
- Mizutani R, Takeuchi A, Uesugi K, Takekoshi S, Osamuara RY, Suzuki Y. X-Ray microtomographic imaging of three-dimensional structure of soft tissues. Tissue Eng C Methods. 2008b;14:359–363. doi: 10.1089/ten.tec.2008.0274. [DOI] [PubMed] [Google Scholar]
- Mizutani R, Suzuki Y. X-ray microtomography in biology. Micron. 2012;43:104–115. doi: 10.1016/j.micron.2011.10.002. [DOI] [PubMed] [Google Scholar]
- Mizutani R, Saiga R, Takeuchi A, Uesugi K, Suzuki Y. Three-dimensional network of Drosophila brain hemisphere. J Struct Biol. 2013;174:271–279. doi: 10.1016/j.jsb.2013.08.012. [DOI] [PubMed] [Google Scholar]
- Ott SR. Confocal microscopy in large insect brains: zinc-formaldehyde fixation improves synapsin immunostaining and preservation of morphology in whole-mounts. J Neurosci Methods. 2008;172:220–230. doi: 10.1016/j.jneumeth.2008.04.031. [DOI] [PubMed] [Google Scholar]
- Ott SR, Elphick MR. New techniques for whole-mount NADPH-diaphorase histochemistry demonstrated in insect ganglia. J Histochem Cytochem. 2003;51:523–532. doi: 10.1177/002215540305100414. [DOI] [PubMed] [Google Scholar]
- Peng H, Chung P, Long F, Qu L, Jenett A, Seeds AM, Myers EW, Simpson JH. BrainAligner: 3D registration atlases of Drosophila brains. Nat Methods. 2011;8:493–500. doi: 10.1038/nmeth.1602. [DOI] [PMC free article] [PubMed] [Google Scholar]
- Rein K, Zöckler M, Mader MT, Grübel C, Heisenberg M. The Drosophila standard brain. Curr Biol. 2002;12:227–231. doi: 10.1016/s0960-9822(02)00656-5. [DOI] [PubMed] [Google Scholar]
- Ribi W, Senden TJ, Sakellariou A, Limaye A, Zhang S. Imaging honey bee brain anatomy with micro-X-ray-computed tomography. J Neurosci Methods. 2008;171:93–97. doi: 10.1016/j.jneumeth.2008.02.010. [DOI] [PubMed] [Google Scholar]
- Richter S, Loesel R, Purschke G, Schmidt-Rhaesa A, Scholtz G, Stach T, Vogt L, Wanninger A, Brenneis G, Doring C, Faller S, Fritsch M, Grobe P, Heuer CM, Kaul S, Moller OS, Muller CH, Rieger V, Rothe BH, Stegner ME, Harzsch S. Invertebrate neurophylogeny: suggested terms and definitions for a neuroanatomical glossary. Front Zool. 2010;7:29. doi: 10.1186/1742-9994-7-29. [DOI] [PMC free article] [PubMed] [Google Scholar]
- Saalfeld S, Fetter R, Cardona A, Tomancak P. Elastic volume reconstruction from series of ultra-thin microscopy sections. Nat Methods. 2012;9:717–720. doi: 10.1038/nmeth.2072. [DOI] [PubMed] [Google Scholar]
- Smolla M, Ruchty M, Nagel M, Kleineidam CJ. Clearing pigmented insect cuticle to investigate small insects' organs in situ using confocal laser-scanning microscopy (CLSM) Arthropod Struct Dev. 2014;43:175–181. doi: 10.1016/j.asd.2013.12.006. [DOI] [PubMed] [Google Scholar]
- Sombke A, Harzsch S, Hansson BS. Organization of deutocerebral neuropils and olfactory behavior in the centipede Scutigera coleoptrata (Linnaeus, 1758) (Myriapoda: Chilopoda) Chem Senses. 2011;36:43–61. doi: 10.1093/chemse/bjq096. [DOI] [PubMed] [Google Scholar]
- Sombke A, Lipke E, Kenning M, Müller CHG, Hansson BS, Harzsch S. Comparative analysis of deutocerebral neuropils in Chilopoda (Myriapoda): implications for the evolution of the arthropod olfactory system and support for the Mandibulata concept. BMC Neurosci. 2012;13:1–17. doi: 10.1186/1471-2202-13-1. [DOI] [PMC free article] [PubMed] [Google Scholar]
- Strausfeld NJ. The evolution of crustacean and insect optic lobes and the origin of chiasmata. Arthropod Struct Dev. 2005;34:235–256. [Google Scholar]
- Strausfeld NJ, Andrew DR. A new view of insect-crustacean relationships I. Inferences from neural cladistics and comparative neuroanatomy. Arthropod Struct Dev. 2011;40:276–288. doi: 10.1016/j.asd.2011.02.002. [DOI] [PubMed] [Google Scholar]
- Tanisako A, Hori A, Okumura A, Miyata C, Kuzuryu C, Obi T, Yoshimura H. Micro-CT of Pseudocneorhinus bifasciatus by projection X-ray microscopy. J Electron Microsc (Tokyo) 2005;54:379–383. doi: 10.1093/jmicro/dfi047. [DOI] [PubMed] [Google Scholar]
- Vosshall LB, Wong AM, Axel R. An olfactory sensory map in the fly brain. Cell. 2000;102:147–159. doi: 10.1016/s0092-8674(00)00021-0. [DOI] [PubMed] [Google Scholar]
- Wanninger A. The application of confocal microscopy and 3D imaging software in functional, evolutionary, and developmental zoology: reconstructing myo- and neurogenesis in space and time. In: Méndez-Vilas A, Días J, editors. Modern research and educational topics in microscopy. Badajoz, Spain: Formatex Research Center; 2007. pp. 353–361. [Google Scholar]
- Wirkner CS, Prendini L. Comparative morphology of the hemolymph vascular system in scorpions—a survey using corrosion casting, microCT, and 3D-Reconstruction. J Morphol. 2007;268:401–418. doi: 10.1002/jmor.10512. [DOI] [PubMed] [Google Scholar]
- Wirkner CS, Richter S. Improvement of microanatomical research by combining corrosion casts with MicroCT and 3D reconstruction, exemplified in the circulatory organs of the woodlouse. Microsc Res Tech. 2004;64:250–254. doi: 10.1002/jemt.20076. [DOI] [PubMed] [Google Scholar]
- Wu JS, Luo L. A protocol for dissecting Drosophila melanogaster brains for live imaging or immunostaining. Nat Protoc. 2006;1:2110–2115. doi: 10.1038/nprot.2006.336. [DOI] [PubMed] [Google Scholar]
- Zube C, Kleineindam CJ, Kitrschner S, Neef J, Rössler W. Organization of the olfactory pathway and odor processing in the antennal of the ant Camponotus floridanus. J Comp Neurol. 2008;506:425–441. doi: 10.1002/cne.21548. [DOI] [PubMed] [Google Scholar]