

Abstract
Nicotinamide adenine dinucleotide (NAD+) is synthesized via two major pathways in prokaryotic and eukaryotic systems: the de novo biosynthesis pathway from tryptophan precursors, or by the salvage biosynthesis pathway from either extracellular nicotinic acid or various intracellular NAD+ decomposition products. NAD+ biosynthesis via the salvage pathway has been linked to an increase in yeast replicative lifespan under calorie restriction (CR). However, the relative contribution of each pathway to NAD+ biosynthesis under both normal and CR conditions is not known. Here, we have performed lifespan, NAD+ and NADH (the reduced form of NAD+) analyses on BY4742 wild type, NAD+ salvage pathway knockout (npt1Δ), and NAD+ de novo pathway knockout (qpt1Δ) yeast strains cultured in media containing either 2% glucose (normal growth) or 0.5 % glucose (CR). We have utilized 14C labeled nicotinic acid in the culture media combined with HPLC speciation and both UV and 14C detection to quantitate the total amounts of NAD+ and NADH and the amounts derived from the salvage pathway. We observe that wild type and qpt1Δ yeast exclusively utilize extracellular nicotinic acid for NAD+ and NADH biosynthesis under both the 2% and 0.5% glucose growth conditions suggesting that the de novo pathway plays little role if a functional salvage pathway is present. We also observe that NAD+ concentrations decrease in all three strains under CR. However, unlike the wild type strain, NADH concentrations do not decrease and NAD+:NADH ratios do not increase under CR for either knockout strain. Lifespan analyses reveal that CR results in a lifespan increase of approximately 25% for the wild type and qpt1Δ strains, while no increase in lifespan is observed for the npt1Δ strain. In combination these data suggest that having a functional salvage pathway is more important than the absolute levels of NAD+ or NADH for lifespan extension under CR.
Keywords: Calorie restriction, NAD, NADH, yeast, NPT1, QPT1, salvage, de novo, AMS
Introduction
Nicotinamide adenine dinucleotide (NAD+) is synthesized via two major pathways in both prokaryotic and eukaryotic systems (Anderson et al., [2002]; Grubmeyer et al., [1999]; Panozzo et al., [2002]; Sandmeier et al., [2002]; Smith and Boeke, [1997]) (Figure 1). In one pathway, NAD+ is synthesized from tryptophan (the de novo pathway). In the other, NAD+ is generated by recycling NAD+ degradation products such as nicotinamide (the salvage pathway). In the salvage pathway nicotinic acid can be taken up by the yeast from the extracellular environment via the nicotinic acid permease transporter (Llorente and Dujon, [2000]). Other points of entry into the salvage pathway are by de novo synthesis of NAD+ from tryptophan (Kucharcyzk et al., [1998]).
Figure 1.
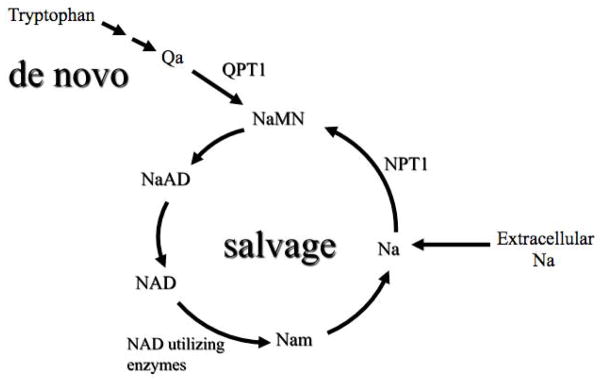
Summary of the NAD+ synthetic pathways in yeast. Key: NaMN: nicotinic acid mononucleotide; NaAD:deamido-NAD; Nam: nicotinamide; Na: nicotinic acid; Qa: quinolinic acid; NPT1:nicotinate phosphoribosyl transferase;; QPT1: quinolinate phosphoribosyl transferase.
Calorie restriction (CR) extends life span in a wide spectrum of organisms although the mechanism by which this regimen slows aging is unknown. CR can be imposed in yeast by reducing the glucose concentration in the media from 2% to 0.5% (Lin et al., [2000]). As cells continue to feed on other culture materials, which are rich in amino acids, nucleotides, and vitamins, the growth rate remains strong with the lower glucose levels, but imposes a state of partial energy (ATP) limitation. Under these CR conditions, mother cells divide ~30% more. This increase in replicative life span does not occur in strains in which NAD+ synthesis is reduced by removal of salvage pathway function linking an increase in yeast replicative lifespan with the salvage pathway for NAD+ biosynthesis (Lin et al., [2000]). Deletion of NPT1, the gene responsible for the conversion of nicotinic acid into nicotinic acid mononucleotide, a precursor to NAD+ in the salvage pathway, prevented an increase in yeast life extension under calorie-restricted conditions. Deletion of QPT1, the gene responsible for conversion of tryptophan products into NAD+ through the de novo biosynthesis pathway, failed to affect lifespan increases under CR. Over-expression of Npt1, a salvage pathway protein responsible for the conversion of nicotinic acid into nicotinic acid mononucleotide, has also been shown to extend lifespan in a manner similar to calorie restriction (Anderson et al., [2002]). Increases in life span have also been observed when Pnc1, Nma1, and Nma2, all proteins involved in the NAD+ salvage pathway, were over-expressed, further supporting a role for salvage pathway activity in life span extension (Anderson et al., [2002]). However, the relative contribution of each pathway to NAD+ biosynthesis under both normal and CR conditions is not known. Here we report on the relative contribution of the salvage pathway to NAD+ biosynthesis under both normal and CR conditions.
Materials and Methods
Yeast culture
Yeast Saccharomyces cerevisiae BY4742 strain MATα his3Δ1 leu2Δ1 lys2Δ0 ura3Δ0 was acquired from Open Biosystems. The salvage and de novo knockout strains, npt1Δ and qpt1Δ, respectively, were generated by replacing the WT genes with the Kanr marker as described (Lin et al., [2004]). Both wild type and knockout strains were cultured in synthetic complete media with 20 g/L glucose (to simulate normal growth conditions) or 5g/L glucose (to simulate CR conditions) (Sigma-Aldrich, St Louis, Mo) as previously described (Sporty et al., [2008]). The nicotinic acid content of the synthetic complete media was determined using the protocol of Hengen et al. [1978] to be 570 μg/L. The unlabeled media was supplemented with (54 mCi/mmol) [carboxy-14C]-nicotinic acid (Moravek Biochemicals, Brea, CA) so that the final activity of the media was 45 pCi per 25-mL culture corresponding to a total additional nicotinic acid supplement of 103 pg. and 6.34 μmol of 14C labeled nicotinic acid per mol of unlabelled nicotinic acid in the growth media. Cultures were maintained until they contained ~ 7 x 10⁶ cells/mL corresponding to mid-log phase growth.
NAD+ and NADH Extraction and Quantitation
NAD+ and NADH were extracted using a single sample extraction and HPLC processing procedure that enables the isolation and quantitation of total cellular NAD+ and NADH from pools of yeast (Sporty et al., [2008]). UV absorbance was monitored at 260 nm for NAD+ and NADH and at 340 nm for NADH only and pertinent peak areas were integrated using area under the curve algorithms. Peak identification and calibration of NAD+ and NADH areas for quantitation were determined using standard solutions of authentic NAD+ and NADH (Sigma-Aldrich, St Louis, MO).
14C Quantitation
HPLC fractions were collected, dried and converted to graphite as previously described (Buchholz et al., [2000]; Getachew et al., [2006]; Miyashita et al., [2001]). 14C contents in the graphite samples were quantified by AMS (Ognibene et al., [2002]). 14C contents (units of attomol 14C) for fractions that contributed to either the NAD+ or NADH peaks were integrated, corrected for recovery efficiency (Sporty et al., [2008]) and converted to salvage pathway NAD+ or NADH contents assuming that 14C-labeled NAD+ and NADH were derived from the 14C-labeled nicotinic acid and using the ratio of mol of 14C labeled nicotinic acid: mol of unlabeled nicotinic acid in the growth media of 6.34 x 10⁻⁶:1.
Life-span analyses
Life span analyses for wild type yeast, qpt1Δ and npt1Δ mutants grown on 2% and 0.5 % glucose were carried out as previously described (Lin et al., [2000]). All life-span analyses in this study were carried out independently at least twice with >45 cells per strain per experiment.
Conversions and statistics
Metabolite contents in units of attomol/cell were calculated from both the measured UV absorbance or measured 14C content, using the number of cells in the extraction. Metabolite contents (attomol/cell) were converted to concentrations (mM) using a derived cell volume for each yeast strain. Mean yeast diameters were determined for all three strains by measuring diameters of at least thirty individual yeast cells using a high magnification optical Zeiss microscope (Carl Zeiss Maple Grove, MN) and assuming yeast were spherical. Differences in metabolite contents were assessed by unpaired two-tailed Student’s t-tests. A significance level of less than 0.05 was considered meaningful. A significance level between 0.05 and 0.10 was considered evidence of a possible trend, while a significance level of greater than 0.10 was considered to indicate no significant difference.
Results and Discussion
Total yeast cellular NAD+ and NADH contents (attomol/cell) measured by UV detection, and 14C-NAD+ and 14C-NADH yeast contents measured by AMS, under normal and calorie-restricted conditions are presented in Table 1. Optical microscopy yielded a mean diameter of 5.1 +/− 0.3 μm for wild type yeast. Assuming yeast to be spherical with a volume of 4/3*π*R3, where R is the radius of 2.5 μm yields a mean volume of approximately 70 μm3. Both knockout strains were slightly smaller than the wild type strain. Optical microscopy of the de novo pathway knockout (qpt1Δ) and salvage pathway knockout (npt1Δ) yeast strains respectively revealed mean diameters of 4.3 +/− 0.3 μm3 and 4.2 +/− 0.4 μm3 and a mean volume of 40 μm3 per cell was derived for each strain. Thus the attomol/cell data in Table 1 were converted to mM concentrations shown in Table 2 using a volume of 70 μm3 for the wild type yeast and 40 μm3 for the two knockout strains. Total NAD+ and NADH concentrations (mM) and NAD+:NADH ratios for the BY4742 wild type, NAD+ salvage pathway knockout, and NAD+ de novo pathway knockout yeast strains are shown in Table 2 together with previously published data on NAD+ and NADH concentrations in wild type yeast. Life span analyses for wild type yeast, qpt1Δ and npt1Δ mutants grown on 2% and 0.5 % glucose are shown in Figure 2.
Table 1.
Quantitation of NAD+ and NADH contents (amol/cell) via HPLC with UV detection (UV) and HPLC with 14C detection (AMS) for wild type, qpt1Δ and npt1Δ knockout yeast under both normal and CR growth conditions. The ratio of AMS to UV-quantitated values under the two growth conditions is also shown (AMS:UV). Each value is the mean and standard deviation of at least three replicate experiments (n = 3–6).
| Normal (2% Glucose) | Calorie-Restricted (0.5% Glucose) | |||||||||||
|---|---|---|---|---|---|---|---|---|---|---|---|---|
| NAD+ | NADH | NAD+ | NADH | |||||||||
| UV | AMS | AMS:UV | UV | AMS | AMS:UV | UV | AMS | AMS:UV | UV | AMS | AMS:UV | |
| Wild Type | 82 (10) | 86 (12) | 1.1 (0.2) | 85 (8) | 88 (15) | 1.0 (0.1) | 54 (4) | 56 (5) | 1.0 (0.1) | 20 (7) | 21 (8) | 1.0 (0.1) |
| qpt1Δ knockout | 53 (10) | 58 (9) | 1.1 (0.1) | 9 (2) | 9 (1) | 1.1 (0.2) | 31 (4) | 35 (3) | 1.1 (0.1) | 15 (3) | 15 (3) | 1.0 (0.1) |
| npt1Δ knockout | 37 (5) | 0.1 (0.1) | 0.00 (0.01) | 5 (2) | 0.04 (0.02) | 0.01 (0.01) | 22 (2) | 0.00 (0.02) | 0.00 (0.01) | 3 (2) | 0.01 (0.03) | 0.00 (0.01) |
Table 2.
Previously reported total cellular NAD+ and NADH concentrations (mM) and ratios together with those from this study for wild type yeast, npt1Δ and qpt1Δ knockout strains under normal (2% glucose) and calorie-restricted (0.5% glucose) growth conditions.
| NAD+ (mM) | NADH (mM) | NAD+:NADH | ||||
|---|---|---|---|---|---|---|
| Normal | Calorie-Restricted | Normal | Calorie-Restricted | Normal | Calorie-Restricted | |
| Present study Wildtype | 1.2 (0.1) | 0.8 (0.1) e) | 1.2 (0.1) | 0.3 (0.1) f) | 1.0 (0.2) | 2.7 (1.3) i) |
| Sporty et al. [2008] | 1.4 (0.2) | 1.7 (0.3) | 1.4 (0.2) | 0.9 (0.2) | 1.0 (0.1) | 1.9 (0.30) |
| Lin et al. [2004] | 1.3 (0.1) | 1.2 (0.1) | 0.9 (0.1) | 0.4 (0.1) | 1.5 | 3.1 |
| Anderson et al. [2002] a) | 2 | - | 0.8 | - | 2.6 | - |
| Present study qpt1Δ knockout | 1.3 (0.3) c) | 0.8 (0.1) c) e) | 0.2 (0.1) b) | 0.4 (0.1) c) g) | 6.2 (2.4) b) | 2.1 (0.7) c) i) |
| Present study npt1Δ knockout | 0.9 (0.1) b) | 0.5 (0.1) b) e) | 0.13 (0.05) b) | 0.08 (0.05) b) h) | 8.1 (3.1) b) | 6.6 (3.3) d) j) |
Reported values were converted to concentrations (mM) as previously described (11),
P < 0.05 compared to present study wild type,
P > 0.1 compared to present study wild type,
0.05 < P< 0.10 compared to present study wild type,
P < 0.05 compared to NAD+ under normal growth,
P < 0.05 compared to NADH under normal growth,
0.05 < P< 0.10 compared to qpt1Δ NADH levels under normal growth,
P > 0.10 compared to npt1Δ NADH levels under normal growth,
P < 0.05 compared to NAD+:NADH ratio under normal growth conditions,
P > 0.1 compared to NAD+:NADH ratio under normal growth.
Figure 2.

Calorie restriction extends life span in a wild type yeast and qpt1Δ but does not extend lifespan in npt1Δ. Average life spans on 2% glucose: wild type 22.86, qpt1Δ 23.14, npt1Δ 16.08. Average life spans on 0.5% glucose: wild type 28.88, qpt1Δ 28.06, npt1Δ 14.5.
Here, we have used 14C-nicotinic acid to specifically label NAD+ and NADH through the salvage pathway. The sensitivity provided by AMS allows for low levels of nicotinic acid, about 103 pg, to be added to 25-mL of media that has an endogenous content of 14.25 μg yielding a molar ratio of 14C labeled nicotinic acid: to total nicotinic acid in the growth media of 6.34x 10⁻⁶:1. Consequently, addition of the labeled nicotinic acid does not significantly perturb media conditions and the growth media remains physiologically relevant. UV quantitation provides total NAD+ and NADH concentrations in cells while AMS quantitates 14C-labeled NAD+ and NADH contents. Only NAD+ and NADH derived from the importation of 14C-nicotonic acid into the salvage pathway should contain a 14C label. The AMS:UV ratios for NAD+ and NADH in Table 1 indicate the fraction of total NAD+ or NADH that is synthesized from the salvage pathway.
Table 1 reveals that UV-quantified NAD+ and NADH levels were statistically similar to AMS-quantified 14C-NAD+ and 14C-NADH levels for both normal and CR conditions in the qpt1Δ knockout strain. Furthermore, the AMS:UV ratios in Table 1 for the qpt1Δ knockout strain indicates all cellular NAD+ and NADH is derived from extracellular nicotinic acid via the salvage pathway, under both normal growth and CR conditions. This is not surprising since deletion of QPT1, should prevent conversion of tryptophan products into NAD+ through the de novo biosynthesis pathway. Under such a scenario all cellular NAD+ and NADH must come from the salvage pathway.
Conversely, the UV and AMS data and AMS:UV ratios in Table 1 for npt1Δ knockout cells indicate that 14C-labeled NAD+ and NADH are completely absent under both normal growth and CR conditions. 14C-labeled NAD+ and NADH contents quantified by AMS were not statistically significant from zero for all npt1Δ knockout samples grown under either normal or CR conditions. Again, such a finding is not surprising since deletion of NPT1 should disrupt the salvage pathway and prevent conversion of recycled and imported nicotinic acid into NAD+ through the salvage biosynthesis pathway. All cellular NAD+ and NADH must come from the de novo pathway in that situation. The AMS data and AMS:UV ratios for NAD+ and NADH in Table 1 from the qpt1Δ and npt1Δ knockout strains indicate that both our experimental design and extraction/purification/labeling strategies appear robust.
The AMS:UV ratio data in Table 1 indicate that UV-quantified NAD+ and NADH levels were statistically similar to AMS-quantified 14C-NAD+ and 14C-NADH levels in wild type yeast. The AMS:UV ratios in Table 1 for the wild type yeast indicate that, like the qpt1Δ knockout strain, all cellular NAD+ and NADH is derived from extracellular nicotinic acid under both normal growth and CR conditions. Because disruption of the salvage pathway in the npt1Δ knockout strain prevents incorporation of 14C from extracellular labeled nicotinic acid into NAD+ and NADH, it is clear that NAD+ and NADH in the wild type strain are derived solely from the salvage pathway. These findings are consistent with the absence of salvage pathway activity in npt1Δ yeast grown under CR (Anderson et al., [2002]). Furthermore, the salvage pathway is exclusively used under both normal and CR conditions. Under normal growth conditions in which extracellular nicotinic acid concentrations are not growth-limiting, yeast preferentially use the salvage pathway over the de novo synthesis pathway, likely conserving tryptophan, the NAD+ precursor for de novo biosynthesis, for protein building ultimately resulting in exponential cell growth.
Table 1 also reveals that both knockout strains have lower NAD+ and NADH contents (units of attomol/cell) than the wild type strain. Such a finding is not surprising since the knockout strains had smaller sizes and smaller volumes (40 μm3) than the wild type strain (70 μm3). The calculated volume of 70 μm3 per cell for the wild type yeast strain is identical to that assumed previously (based on the work of Sherman, [2002]) in calculating yeast metabolite concentrations (Lin et al., [2004]; Sporty et al., [2008]) and indicates that our methodology for calculating yeast cell volumes is appropriate. Other investigators have also noted that yeast knockout strains can have significantly smaller volumes than wild type yeast (Jorgensen et al., [2002]). Converting NAD+ and NADH contents (attomol/cell) from Table 1 to NAD+ and NADH concentrations (mM) shown in Table 2 allows us to make more meaningful comparisons between the three strains and also to compare our data with that from previously reported studies.
Table 2 reveals that NAD+ concentrations from wild type yeast grown under normal or CR conditions are comparable to those found in previously published reports (Anderson et al., [2002]; Lin et al., [2004]; Sporty et al., [2008]). Table 2 also reveals that NAD+ concentrations from the qpt1Δ knockout strain are statistically similar to NAD+ concentrations from wild type yeast for both normal and CR growth conditions. However, the npt1Δ knockout strain possesses a NAD+ concentration that is only three-quarters of that found in the wild type strain during normal growth conditions and possesses an NAD+ concentration that is only two thirds of that found in the wild type strain during CR. These differences in NAD+ concentration are both significant (p < 0.5). This finding is consistent with previous studies that found that deleting the NPT1 gene decreases the NAD+ level, whereas deleting the QPT1 gene had no effect on NAD+ level (Sandmeier et al., [2002]; Smith and Boeke, [1997]).
Lin et al., [2004] have suggested that CR extends yeast life span by lowering the level of NADH resulting in increased NAD+:NADH ratios. However, they have only reported NAD+ and NADH measurements in wild type yeast. Our NAD+ and NADH concentrations and NAD+:NADH ratios (Table 2) for wild type yeast under normal and CR conditions are comparable to those of Lin et al., [2004] and our previously data (Sporty et al., [2008]). However, under normal growth conditions total NAD+:NADH ratios for the knockout strains were significantly higher than those observed in wild type cells and NADH levels were significantly depressed. Low NADH levels for the knockout strains under normal growth could be associated with smaller cell sizes for the npt1Δ and qpt1Δ knockout strains. The citric acid cycle, which reduces NAD+ to generate NADH, is coupled to oxidative phosphorylation by the oxidation of NADH yielding ATP that is required for cell growth, reproduction and survival. Such low levels of NADH may inhibit cellular anabolic processes and plausibly cell growth.
Our metabolite data for CR reveals that, similar to the work of Lin et al., [2004] and Sporty et al., [2008], NAD+:NADH ratios are observed to increase for the wild type strain (Table 2). However, NAD+:NADH ratios do not increase under CR conditions for either of the knockout strains. Furthermore, unlike wild type yeast where NADH concentrations decrease, NADH levels show evidence of a possible increase in the qpt1Δ mutant and do not decrease in the npt1Δ mutant during CR. In contrast to previous studies (Lin et al., [2004]; Sporty et al., [2008]) we also find that NAD+ concentrations decrease in all three strains under CR.
Our life span data (Figure 2) for wild type yeast, qpt1Δ and npt1Δ mutants grown on 2% glucose and 0.5 % glucose are consistent with those previous reports (Lin et al., [2000]). CR results in an average increase in lifespan of approximately 25% in the wild type yeast and qpt1Δ mutant, while no increase in lifespan is observed for the npt1Δ mutant.
Our data togther with that of others show that rDNA silencing and lifespan extension under CR are lost in the npt1Δ mutant (Lin et al., [2000]; Smith and Boeke, [1997]). For the npt1Δ mutant, it is possible that although our data indicate that the NAD+:NADH ratio is high, the NAD+ level is too low to activate selected NAD+-dependent enzymes. For the qpt1Δ mutant, our data and that of others show deleting QPT1 has no effect on total NAD+ levels or rDNA silencing or life span (Lin et al., [2000]; Sandmeier et al., [2002]; Smith and Boeke, [1997]). Since lifespan extension for both wild type and qpt1Δ yeast occurs under CR while the NAD+:NADH ratio significantly decreases for the mutant but increases for the wild type strain our data suggest that a high NAD+:NADH ratio under CR alone is not sufficient to extend life span. This suggests that perhaps a threshold level of NAD and/or NADH is required for CR-induced beneficial effects and increased metabolic activity may also play an important role in CR.
In summary we have shown that, both wild type BY4742 and qpt1Δ yeast exclusively utilize extracellular nicotinic acid for NAD+ biosynthesis during exponential growth under both normal and CR conditions, suggesting that the de novo pathway plays little role if a functional salvage pathway is present. Under CR conditions, cells do not alter biosynthesis pathway activity and continue to synthesize NAD+ from extracellular nicotinic acid. We also observe that NAD+ concentrations decrease in all three strains under CR. However, unlike the wild type strain, NADH concentrations do not decrease and NAD+:NADH ratios do not increase under CR for either knockout strain. Since lifespan analyses reveal that CR results in an average increase in lifespan of approximately 25% in the wild type yeast and qpt1Δ mutant, while no increase in lifespan is observed for the npt1Δ mutant, these data suggest that having a functional salvage pathway is more important than the absolute levels of NAD+ or NADH for lifespan extension under CR.
Acknowledgments
This work was performed under the auspices of the U.S. Department of Energy by Lawrence Livermore National Laboratory under Contract DE-AC52-07NA27344 and was supported by the National Institutes of Health, National Center for Research Resources, Biomedical Technology Program (P41 RR013461).
References
- Anderson RM, Bitterman KJ, Wood JG, Medvedik O, Cohen H, Lin S, Manchester J, Gordon JI, Sinclair DA. Manipulation of a nuclear NAD+ salvage pathway delays aging without altering steady-state NAD+ levels. J Biol Chem. 2002;277:18881–18890. doi: 10.1074/jbc.M111773200. [DOI] [PubMed] [Google Scholar]
- Buchholz BA, Freeman SPHT, Haack KW, Vogel JS. Tips and Traps in the Biological 14C AMS Prep Lab. Nuclear Instruments and Methods B. 2000;172:404–408. [Google Scholar]
- Getachew G, Kim SH, Burri BJ, Kelly PB, Haack KW, Ognibene TJ, Buchholz BA, Vogel JS, Modrow J, Clifford AJ. How to convert biological carbon into graphite for AMS. Radiocarbon. 2006;4:325–336. [Google Scholar]
- Grubmeyer CT, Gross JW, Rajavel M. Energy coupling through molecular discrimination: nicotinate phosphoribosyltransferase. Methods Enzymol. 1999;308:28–48. doi: 10.1016/s0076-6879(99)08004-0. [DOI] [PubMed] [Google Scholar]
- Hengen N, Selberth V, Hengen M. High performance liquid-chromatographic determination of free nicotinic acid and its metabolite, nicotinuric acid, in plasma and urine. Clinical Chem. 1978;24:1740–1743. [PubMed] [Google Scholar]
- Jorgensen P, Nishikawa JL, Breitkreutz BJ, Tyers M. Systematic Identification of Pathways That Couple Cell Growth and Division in Yeast. Science. 2002;297:395–400. doi: 10.1126/science.1070850. [DOI] [PubMed] [Google Scholar]
- Kucharczyk R, Zagulski M, Rytka J, Herbert CJ. The yeast gene YJR025c encodes a 3-hydroxyanthranilic acid dioxygenase and is involved in nicotinic acid biosynthesis. FEBS Lett. 1998;424:127–130. doi: 10.1016/s0014-5793(98)00153-7. [DOI] [PubMed] [Google Scholar]
- Lin SJ, Defossez PA, Guarente L. Requirement of NAD and SIR2 for Life-Span Extension by Calorie Restriction by Saccharomyces cerevisiae. Science. 2000;289:2126–2128. doi: 10.1126/science.289.5487.2126. [DOI] [PubMed] [Google Scholar]
- Lin SJ, Ford E, Haigis M, Liszt G, Guarente L. Calorie restriction extends yeast life span by lowering the level of NADH. Genes Dev. 2004;18:12–16. doi: 10.1101/gad.1164804. [DOI] [PMC free article] [PubMed] [Google Scholar]
- Llorente B, Dujon B. Transcriptional regulation of the Saccharomyces cerevisiae DAL5 gene family and identification of the high affinity nicotinic acid permease TNA1 (YGR260w) FEBS Lett. 2000;475:237–241. doi: 10.1016/s0014-5793(00)01698-7. [DOI] [PubMed] [Google Scholar]
- Miyashita M, Presley JM, Buchholz BA, Lam KS, Lee YM, Vogel JS, Hammock BD. Attomole level protein sequencing by Edman degradation coupled with accelerator mass spectrometry. Proc Nat Acad Sci. 2001;98:4403–4408. doi: 10.1073/pnas.071047998. [DOI] [PMC free article] [PubMed] [Google Scholar]
- Ognibene TJ, Bench G, Brown TA, Peaslee GF, Vogel JS. A New Accelerator Mass Spectrometry system for 14C quantification of biochemical samples. International Journal of Mass Spectrometry. 2002;218:255–264. [Google Scholar]
- Panozzo C, Nawara M, Suski C, Kucharczyka R, Skoneczny M, Becam AM, Rytka J, Herbert CJ. Aerobic and anaerobic NAD+ metabolism in Saccharomyces cerevisiae. FEBS Lett. 2002;517:97–102. doi: 10.1016/s0014-5793(02)02585-1. [DOI] [PubMed] [Google Scholar]
- Sandmeier JJ, Celic I, Boeke JD, Smith JS. Telomeric and rDNA silencing in Saccharomyces cerevisiae are dependent on a nuclear NAD(?) salvage pathway. Genetics. 2002;160:877–889. doi: 10.1093/genetics/160.3.877. [DOI] [PMC free article] [PubMed] [Google Scholar]
- Sherman F. Getting started with yeast. Methods Enzymol. 2002;350:3–41. doi: 10.1016/s0076-6879(02)50954-x. [DOI] [PubMed] [Google Scholar]
- Smith JS, Boeke JD. An unusual form of transcriptional silencing in yeast ribosomal DNA. Genes Dev. 1997;11:241–254. doi: 10.1101/gad.11.2.241. [DOI] [PubMed] [Google Scholar]
- Sporty JL, Kabir MdM, Turteltaub KW, Ognibene T, Lin SJ, Bench G. Single Sample Extraction and HPLC Processing for Quantification of NAD and NADH levels in Saccharomyces Cerevisiae. Journal of Separation Science. 2008;31:3202–3211. doi: 10.1002/jssc.200800238. [DOI] [PMC free article] [PubMed] [Google Scholar]