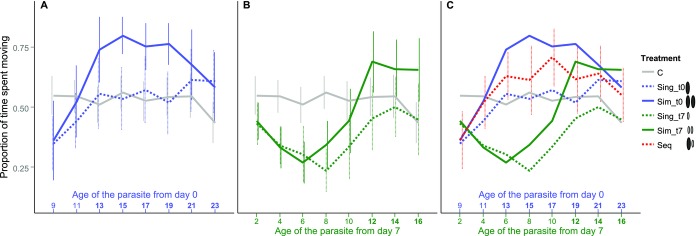
Figure 2.

Activity of copepods according to treatment, right after a simulated predator attack. Error bars indicate 95% CI. Bold numbers on the x-axis indicate that a parasite of that age was infective. (A) Copepods infected on day 0, (B) copepods infected on day 7, (C) all treatments. Error bars from the treatments already presented in (A) and (B) have been omitted for better readability. C, unexposed control copepods; Sing_t0, copepods singly infected with one parasite on day 0; Sim_t0, copepods simultaneously infected with two parasites on day 0; Sing_t7, copepods singly infected with one parasite on day 7; Sim_t7, copepods simultaneously infected with two parasites on day 7; Seq, copepods sequentially infected with two parasites, one each on day 0 plus day 7.
