

Abstract
Objective
Despite growing evidence of links between adverse childhood experiences (ACEs) and long-term health outcomes, there has been limited longitudinal investigation of such links in youth. The purpose of these analyses was to describe the patterns of exposure to ACEs over time and their links to youth health.
Methods
The current analyses used data from LONGSCAN, a prospective study of children at risk for or exposed to child maltreatment, who were followed from age 4 to age 18. The analyses focused on 802 youth with complete data. Cumulative exposure to ACEs between 4 and 16 was used to place participants in 3 trajectory-defined groups: chronic ACEs, early ACEs only, and limited ACEs. Links to self-reported age 18 health were examined using linear mixed models after controlling for earlier health status and demographics.
Results
The chronic ACEs group had increased self-reported health concerns and use of medical care at 18, but not poorer self-rated health status. The early ACEs only group did not significantly differ from limited ACEs on outcomes.
Conclusions
In addition to other negative outcomes, chronic ACEs appear to affect physical health in emerging adulthood. Interventions aimed at reducing exposure to ACEs and early mitigation of their effects may have lasting and widespread health benefits.
Keywords: Adolescent health, childhood adversities, child abuse and neglect
Introduction
Over the past decade, the Centers for Disease Control and Prevention-Adverse Childhood Experiences (CDC-ACE) study has demonstrated that adversities in childhood have a negative impact on numerous adult health outcomes and behaviors including premature death, adolescent pregnancy, and illicit drug-use.1-7 These studies examining adverse childhood experiences and adult outcomes have found that ACEs have a long-term and enduring effect across the lifespan.2
As important as the CDC-ACE studies have been in helping to clarify the relationship between child abuse/neglect and other adverse experiences and adult outcomes, they rely on adult retrospective reports about their experiences prior to age 18. Although retrospective recall of ACEs provide important information,8 it is also important to assess these relationships with prospective, proximal reports.9 In addition, it appears that whether the effects of ACEs follow a dose-related1-2 or threshold effect10 depends on the health outcome examined and the timing of exposures.11
Little is known about the impact of ACEs across different developmental stages. Examining the effects of timing of adverse experiences during childhood and adolescence may provide important information about pathways between ACEs and a variety of outcomes for children and young adults,12 as well as guiding intervention and prevention strategies. Three recent prospective studies from the Consortium for LONGitudinal Studies of Child Abuse and Neglect (LONGSCAN)13 found that at-risk and/or maltreated children experience significant ACEs across developmental periods.10,11,14, and that ACEs predicted child health outcomes in early childhood,14 middle childhood,10 and early adolescence.11 Timing of exposure to ACEs also appears to influence child outcomes.11
While these recent findings are important, there are still unanswered questions about timing and continuity of ACEs and child/youth outcomes. The LONGSCAN studies provide a unique opportunity to examine prospective reports of ACEs across early and middle childhood and the relationship of these ACEs to health outcomes in late adolescence. Furthermore, the collection of data across childhood developmental periods provides an opportunity to examine whether trajectories (patterns of children's experiences of ACEs over time) is a useful approach in attempting to understanding health outcomes in late adolescence.
Methods
Participants and Study Design
These analyses used data collected by the LONGitudinal Studies of Child Abuse and Neglect (LONGSCAN), a consortium consisting of a coordinating center and 5 study sites, focused on children exposed to child maltreatment, or at risk for it, based on potential risk factors such as demographics and family health concerns. Distributed in different regions of the country, each site collected data according to commonly shared age-specific data collection protocols.13 The sites varied in criteria for recruitment. These children and their caregivers were enrolled into the LONGSCAN study at age 4 or 6 and assessed at various age-keyed follow-up points: ages 6, 8,10, 12, 14, 16, and 18.
The initial LONGSCAN sample included 1354 subjects recruited at the age 4/6 baseline. Due to attrition and the premature ending of funding for the study, 912 (67.4%) youth had outcome data available at age 18. Of these, 802 (87.9%) had data on exposure to adverse childhood experiences at all of the key points of assessment: ages 6, 12, 14, and 18. There were no demographic differences between those included in the analyses and those not included. The description of the analysis sample is presented in the Results section.
Human Subjects
Each participating study site, as well as the coordinating center, obtained independent approval from its local Institutional Review Board for each age assessment. Caregivers provided informed consent while youth provided assent for their participation for all interviews from age 8 through 16. At the age 18 interview, youth provided informed consent.
Variables and Their Measurement
Adverse Childhood Experiences (ACEs)
As described in previous studies,11 age-appropriate measures were selected from among the available instruments administered to the LONGSCAN sample to assess ACEs over time. Prior research had identified three periods that corresponded with these assessments: early childhood (from birth to age 6), later childhood (from age 6 to age 12) and teenage years (from age 12 to age 16).11 The adversities were selected to parallel those identified in the CDC-ACE studies.1 There was some variation of the time frame used in each question because some measures asked about events in the prior year, while others asked about events in the prior 6 months. These data were collected during face-to-face or telephone assessment interviews at ages 4, 6, 8, 10, 12, 14, and 16 years. For several variables indicating ACEs, somewhat different measures were used to assess the variable at different ages. To construct a longitudinal profile of ACEs, predictor variables were dichotomized and each was assessed at three developmental periods (birth to 6, over 6 to 12, and over 12 to 16). The ACEs examined included two broad categories of childhood experiences: child maltreatment and family dysfunction.
Child Maltreatment
Each site reviewed child protective service administrative records for allegations of child maltreatment at least every 2 years. Rather than rely on child protective services labels, the allegation texts were reviewed by staff trained to high reliability and coded according to types of alleged maltreatment and linked to the age of the participant. For each of the three time periods, the following four types of child maltreatment were dichotomized, based on the Modified Maltreatment Coding System (MMCS):15,16
Physical abuse (any blows or injury to the body; violent handling, choking, burning, shaking, or nondescript injury);
Sexual abuse (any sexual exposure, exploitation, molestation, or penetration);
Psychological maltreatment (any threats to psychological safety and security, lack of acceptance and threats to self-esteem, or failure to allow age-appropriate autonomy); and
Neglect (any failure to provide for a child's physical needs, or supervision so inadequate as to put the child's safety at risk).
Family Dysfunction
Family dysfunction included caregiver substance use, caregiver depressive symptoms, intimate partner violence in the home, and criminal activity in the home. The assessment of each of these is briefly described.
Caregiver's Substance Use was assessed at age 4 using the CAGE,17 a commonly used 4-item screening measure of problem alcohol use. Endorsement of any of the screening items was considered indicative of substance use by the parent.18 The Caregiver Substance Use measure, developed by LONGSCAN,19 was administered to caregivers at ages 8, 12, 14, and 16 years. It asked a series of yes or no questions about the caregiver's use of common substances, both legal and illegal.
Caregivers' depressive symptoms were measured using two scales, depending on the time frame. The Center for Epidemiological Studies Depression Scale (CES-D)20 which measures symptoms associated with depression in the past week, was administered to caregivers of children at ages of 4, 6, 12, 14, and 16 years. The Brief Symptom Inventory, administered at the child's age 8 interview, is a valid, reliable measure of a broader range of psychological symptoms in the last week including depression.21,22 In both cases, scores were dichotomized according to the conventional cutpoints (greater than 16 for the CES-D20; t-score of 63 or higher for BSI21).
Intimate partner violence was assessed using the partner-to-partner Conflict Tactics Scale23, administered to the primary caregiver (>90% maternal) at child age 6, 8, 12, 14, and 16 years to assess intimate partner violence that had occurred during the previous 3 months. The caregiver was coded as having been treated violently if she reported having been the victim of 1 or more of the following: kicking, biting, punching, hit with an object, being beaten up, threatened with a knife or gun, or the victim of a knife or a gun.
Criminal behavior in the household was assessed using the Child Life Events measure, developed by LONGSCAN and administered to caregivers of children at ages 6, 8, 12, 14, and 16 years.19 It asked whether anyone in the child's household had been jailed or imprisoned in the past year. Affirmative responses were coded as present for criminal behavior in the household.
Construction of the ACEs Index
Analogous to the methods used in the CDC-ACE studies, the 8 dichotomous scores on each ACE (i.e., the 4 types of maltreatment; the 4 forms of household dysfunction) were summed to produce an overall ACEs Index with scores ranging from 0 to 8;1 this was done for each developmental period.
Demographic control variables
Demographic variables were assessed at each age interview. Demographic variables that did not vary over time (child's race/ethnicity, gender, and site) were collected at age 4 or 6. Family income was collected at age 18.
Earlier Self-Reported Health
Earlier health status was assessed using several indices of child health at assessments at ages 6, 12, 14, and 16. At ages 12, 14, and 16, youth self-reports of health were dichotomized, with “fair” or “poor” indicating poor health. At ages 6, 12, and 14, caregivers were asked parallel questions about the child's health and these were similarly dichotomized. At each of ages 6, 12, 14, and 16, the caregiver completed the CBCL24 including the Somatic Complaints subscale, which asks about common physical complaints. Finally, at each of ages 6, 12, 14, and 16, the caregiver was asked whether the child had had an illness that required medical attention. At age 16, youth were asked a parallel question about their own illness requiring medical attention. Overall, earlier health status was dichotomized: an affirmative response to any of these indicators of poor health from age 6 to 16 was coded as indicative of earlier poor health.
Youth Self-Reported Health Outcomes
Three outcomes involving self-reported health at age 18 were examined using LONGSCAN-modified items:25 health worry, medical care, and overall health rating. Health worry was assessed using a single item asking, on a five point scale, “During the past month, how much has your health worried you?” Medical care was assessed using two self-report questions: “I received medical care for a serious or ongoing health problem”; for those who responded in the negative, a follow-up question was asked: “I needed medical care for a serious or ongoing health problem but didn't get it.” Affirmative responses to either question were coded as self-reports of “needing or receiving medical care.” Finally, overall health rating was assessed, using a single item: “Compared to others your age, would you say your health is: Excellent, Good, Fair, or Poor.” This self-report item has been widely used with adults and is a reliable indicator of health.26 Responses of “fair” or “poor” were coded as indicating poor self-rated health.
Statistical Analyses
The analyses were conducted using Statistical Package for the Social Sciences (SPSS), Version 19, except for the identification of the ACEs trajectories, which was done using Mplus, version 7.
Identification of ACEs Trajectories
To identify trajectory group category for each participant, growth mixture modeling (GMM) was used. GMM is an individual-level statistical approach that identifies two or more unobserved categories of individuals that have similar scores on a variable measured multiple times.27 The ACE score for each age period was entered for each participant and this was subjected to the approach to identifying patterns of groups over time (latent classes). Although each group was defined by an average trajectory, each individual can deviate somewhat from that trajectory. The number of groups that best fit the data was identified using standard fit indices, with an iterative process evaluating whether the addition of more groups resulted in significantly better fit to the data; this process suggested that the optimal number of groups was 3.
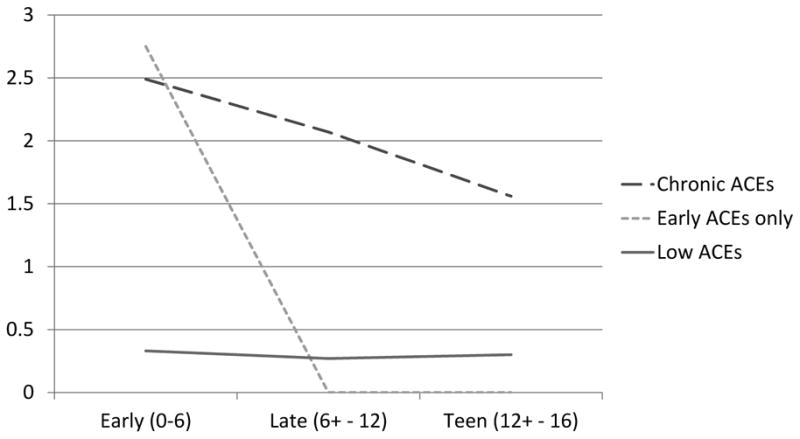
Although these three groups are compared in the Results section, in brief, they comprised: 1) a large group of children (69%) with consistently high levels of ACEs; roughly 2 at each period (Group 1, labelled “Chronic ACEs”); 2) a smaller group (7%) with high rates of early childhood (before age 6) ACEs, but very few ACEs later (Group 2, labeled “Early ACEs Only”); and 3) a substantial portion of the sample (24%) that had consistently low rates of ACEs (usually 0 ACEs) over time (Group 3, labeled “Limited ACEs). These are presented in Figure 1.
Figure 1. Trajectories of number of ACEs over time.
To establish the coherence of these three groups, they were compared on lifetime exposure to particular ACEs, as well as on their mean exposure to ACEs at each age point, and lifetime, as well as on demographic factors. These comparisons were made using chi-square analyses for categorical variables and univariate analysis of variance (ANOVA) for continuous variables.
Predicting Self-Rated Health
The effects of ACE group membership on self-rated health were assessed using multilevel mixed linear modeling. This statistical technique was used to account for possible shared variance among children/youth assessed at the same site; thus, children/youth were nested within sites. In the first step of the model, a block of control variables (gender, race/ethnicity, family income) was entered. In the next step, dichotomized earlier poor health was entered. Finally, ACE group was entered, with Low ACEs as the reference group, and a final model was estimated. This was repeated for each of the three outcomes examined (self-reported health worries, self-reported needing or receiving medical care, and self-rated health).
Results
Description of the sample
The sample is described in Table 1. As can be seen, somewhat more than half of the sample were African American, and a slight majority were female. Exposure to ACEs was highest in early childhood and generally diminished through late childhood as shown in Table 1. Overall, the mean number of ACEs from birth to age 16 was more than three, and very few had no exposure to ACEs from birth to age 16. The most common ACEs were neglect and caregiver depression.
Table 1. Description of the sample (N = 802).
| % (N) or M (SD) | |
|---|---|
| Demographic Factors | |
| Site | |
| Eastern | 20% (164) |
| Southern | 18% (146) |
| Midwest | 17% (136) |
| Northwest | 21% (165) |
| Southwest | 24% (191) |
| Race/Ethnicity | |
| White | 26% (205) |
| African American | 55% (442) |
| Hispanic | 6% (50) |
| Other | 13% (105) |
| Gender | |
| Girls | 56% (446) |
| Boys | 44% (356) |
| Lifetime Exposure to Types of ACEs | |
| Neglect | 59% (470) |
| Caregiver depression | 56% (450) |
| Household criminal behavior | 43% (344) |
| Caregiver victimization | 35% (283) |
| Psychological Maltreatment | 35% (277) |
| Physical Abuse | 34% (271) |
| Caregiver Substance use | 33% (267) |
| Sexual Abuse | 17% (138) |
| Total Number of ACEs | |
| Early childhood (age 0 – 6) | 1.94 (1.55) |
| Late childhood (age 6+ – 12) | 1.53 (1.52) |
| Teen (age 12+ – 16) | 1.15 (1.26) |
| Lifetime (age 0 – 16) | 3.24 (1.98) |
Comparison of ACEs Groups
The comparison of the three ACEs groups is presented in Table 2. As can be seen, the Limited ACEs group had lower likelihood than the other two groups of ever experiencing physical abuse, sexual abuse, or neglect. The Chronic ACEs group had significantly higher likelihood than the other two groups of ever experiencing caregiver substance use, caregiver depression, caregiver victimization, and household criminal behavior. Finally, the Early ACEs Only group was significantly more likely to have experienced psychological maltreatment than the other two groups. There were no significant effects of race/ethnicity or gender on ACE group category.
Table 2. Comparison of the three trajectory groups on ACEs and other variables.
| Groups % (N) | Test Statistic | |||
|---|---|---|---|---|
| Group 1: Chronic ACEs | Group 2: Early ACEs Only | Group 3: Limited ACEs | ||
| 70% (557) | 7% (53) | 24% (192) | ||
| ACEs (ever) | ||||
| Physical Abuse | 43% (241) | 45% (24) | 3% (5) | χ2 (2) = 109.81* |
| Sexual Abuse | 22% (121) | 21% (11) | 2% (3) | χ2 (2) = 42.08* |
| Psychological Maltreatment | 44% (243) | 62% (33) | 1% (1) | χ2 (2) = 136.64* |
| Neglect | 71% (394) | 77% (41) | 18% (35) | χ2 (2) = 170.49* |
| Caregiver Substance use | 43% (240) | 17% (9) | 9% (18) | χ2 (2) = 79.87* |
| Caregiver depression | 70% (389) | 34% (18) | 22% (43) | χ2 (2) = 109.81* |
| Caregiver victimization | 45% (251) | 6% (3) | 15% (29) | χ2 (2) = 77.93* |
| Household criminal behavior | 58% (325) | 15% (8) | 6% (11) | χ2 (2) = 179.30* |
| Total ACEs | ||||
| Early Childhood | 2.49 (1.48) | 2.75 (0.78) | 0.33 (0.47) | F (2, 799) = 214.36* |
| Late Childhood | 2.07 (1.42) | 0.00 (0.00) | 0.27 (0.51) | F (2, 799) = 200.88* |
| Teenage | 1.56 (1.28) | 0.00 (0.00) | 0.30 (0.48) | F (2, 799) = 126.78* |
| Ever | 4.13 (1.62) | 2.75 (0.78) | 0.83 (0.68) | F (2, 799) = 397.67* |
| Demographics | ||||
| Site | χ2 (2) = 106.45* | |||
| Eastern | 16% (91) | 19% (10) | 34% (63) | |
| Southern | 18% (99) | 4% (2) | 23% (45) | |
| Midwest | 14% (80) | 4% (2) | 28% (54) | |
| Northwest | 26% (142) | 30% (16) | 4% (7) | |
| Southwest | 26% (145) | 43% (23) | 12% (23) | |
| Race/Ethnicity | χ2 (2) = 10.50 | |||
| White | 27% (148) | 36% (19) | 20% (38) | |
| African American | 57% (299) | 45% (24) | 62% (119) | |
| Hispanic | 6% (33) | 4% (2) | 8% (15) | |
| Other | 14% (77) | 15% (8) | 10% (20) | |
| Gender | χ2 (2) = 0.39 | |||
| Girls | 55% (306) | 58.% (31) | 57% (109) | |
| Boys | 45% (259) | 42% (22) | 43% (83) | |
Notes.
p < .05.
Predicting Age 18 Health Outcomes
Tables 3 through 5 describe mixed models predicting three health outcomes: health worries, having needed or received medical care, and having self-rated health as “fair” or “poor.” There were significant effects of ACEs on two of these three outcomes: health worries and needing or receiving medical care. Specifically, the Chronic ACEs group had more health worries and more medical care than the Low ACEs group. There were no significant differences between Low ACEs and Early ACEs Only groups. There were no significant effects of ACEs on self-rated health.
Table 3. Mixed Models Predicting Age 18 Health: Health Worry.
| Fixed Effects | B | SE | t | P |
|---|---|---|---|---|
| Control | ||||
| Gender: Male | -.30 | .08 | -3.65 | .000 |
| Race: White | -.05 | .14 | -0.39 | .700 |
| Race: African American | .16 | .13 | 1.25 | .212 |
| Race: Hispanic | .09 | .21 | 0.46 | .648 |
| Family Income | .02 | .01 | 1.72 | .086 |
| Earlier Health | ||||
| Any Health Problem Age 6 to 16 | .23 | .08 | 2.71 | .007 |
| ACEs Trajectory | ||||
| Chronic ACEs | .25 | .10 | 2.49 | .013 |
| Early ACEs Only | -.20 | .18 | -1.08 | .280 |
Note. Boldface indicates significant at p < .05. Site was entered as a random effect.
Table 5. Mixed Models Predicting Age 18 Health: Health Rating (fair or poor).
| Fixed Effects | B | SE | t | P |
|---|---|---|---|---|
| Control | ||||
| Gender: Male | -.13 | .03 | -4.61 | .000 |
| Race: White | -.03 | .05 | -0.61 | .543 |
| Race: African American | -.03 | .05 | -0.68 | .500 |
| Race: Hispanic | .02 | .07 | 0.22 | .826 |
| Family Income | .01 | .01 | 1.09 | .278 |
| Earlier Health | ||||
| Any Health Problem Age 6 to 16 | .20 | .03 | 6.68 | .000 |
| ACEs Trajectory | ||||
| Chronic ACEs | .03 | .04 | 0.60 | .550 |
| Early ACEs Only | -0.6 | .06 | -0.93 | .351 |
Note. Boldface indicates significant at p < .05. Site was entered as a random effect.
In terms of demographic control variables, male gender predicted lower health worries and lower likelihood of poor health rating. There were no significant unique effects of race/ethnicity or family income on any of the three health outcomes examined. Earlier health status strongly predicted all three outcomes.
Discussion
The central finding of the current study was that chronic exposure to ACEs over the course of childhood predicted health worries and self-reported use of medical care at age 18. The current study adds to a relatively small literature on the life course of ACEs and their patterns through adolescence.
The youth in this study were selected because they had been maltreated or were at risk for maltreatment by age 4; however, there was much variation in their exposure to ACEs over time. The largest group (Chronic ACEs) experienced high levels of ACEs throughout their childhood. Early ACEs Only, comprising just 7% of the sample, experienced high levels of ACEs early in life, but few ACEs later while Limited ACEs (24% of the sample) had consistently few ACEs. It is interesting that a quarter of this “high risk” sample appear to have been largely spared the ACEs we assessed during their childhoods. As noted earlier, some of the sample were selected based on risk for child maltreatment and in many cases, this risk was never realized. As well, it is also possible that these children were exposed to ACEs that were not assessed here.
Comparison of the self-reported health outcomes of these 3 groups demonstrates a strong influence of ACEs on youth self-reported health. Those in the Chronic ACEs group were significantly more likely to be worried about their health and to report having needed or received medical care than those in the Low ACEs group. Prior research1-3 has suggested that the number of ACEs is the primary driver of outcomes. The current findings suggest that self-reported health outcomes may be driven by the chronicity of ACEs rather than simply the number of ACEs.
It is noteworthy that it appears that chronic exposure to ACEs is especially influential, whereas those with only early exposure had no significant effects. There may well have been problems in other areas beyond the scope of the current analyses, and it is also possible that this group of youth and their families benefited from early intervention. However, this study did not assess or monitor such services. However, at least tentatively, these findings are consistent with the possibility that early exposure to ACEs does not necessarily imply that these exposures will persist over childhood. Whether this desistance is due to intervention, preventive efforts, or family resilience remains an important topic for further study.
Earlier self-reported health problems predicted self-reported health problems at age 18. Conservatively, these analyses included self-reports of health up to age 16 in the “earlier” health problems designation. That effects for ACEs are present even after taking into account these prior health problems is especially striking. It may, however, help explain the failure to find effects of early time-limited ACEs; early ACEs experienced by most of the sample may have taken their toll at a relatively young age, with resultant self-rated health problems persisting.11 Additionally, children's early health problems may have been an added stressor on their families, contributing to the risk of maltreatment or household dysfunction. Relatively few youth, however, described not getting health care when they thought it was needed. Further research is needed to probe these findings in a more refined way.
There are several other aspects of the study to keep in mind when interpreting the findings. First, it is useful to contrast the current study with the original CDC-ACE studies.1 The subjects in the current study are not a nationally representative sample and are quite different from the middle class subjects of the original CDC-ACE study.1 Rather, this sample is more similar to the 3 million children referred to child welfare services every year, in that the rates of ACEs were very high and only a small portion had consistently low rates of exposure.28 The LONGSCAN sample was selected based on “risk”, but this risk included demographic risk, which would not necessarily entail exposure to any particular ACE. In the original CDC-ACE study, only half of the participants had experienced at least one ACE;1 as noted earlier, it is possible that adult respondents' recall of ACEs is subject to threshold effects. One possible implication of this use of a high-risk sample is that it is possible that there was limited variance and thus lowered likelihood of detecting effects. In addition, the majority of participants in the present study were African American, while most of the CDC-ACE participants were white and fewer than 5% were African American. Finally, this study featured prospective assessment of ACEs over multiple developmental periods and examined outcomes in young adults, rather than in middle aged adults.
There were also some limitations. Some ACES were not measured over the whole time period; for example, mother depression was assessed only over a period of a week at each assessment, so episodes of elevated depressive symptoms are likely to have been missed. On the other hand, the data are likely to be more accurate, because it was collected in close proximity to the actual experience. The reports about health were based on youth and caregiver self- report, and focused on health worries, poor global health, and health care utilization. Ideally, these measures would be complemented by more objective measures of health. However, it is important to keep in mind that there is a great deal of support for the validity of self-rated health.26
Finally, there is still a great deal of debate about how best to characterize the adverse experiences of childhood.29,30 This study will not settle that question; rather, we used an analog of the original lists of ACEs proposed by the CDC-ACE studies1 and predicted outcomes using trajectories based on counts of these ACEs. The ACEs studied here were not a comprehensive set of adverse childhood experiences; alternative lists of ACEs have been proposed.29 As well, a promising line of research has focused on identifying particularly critical ACEs,30,31 and an older line of research has focused on maltreatment as a predictor of poor health.32,33 These findings further support the need to identify stressors in families, and to intervene effectively. Doing so has the potential to improve the health of children and adolescents, and perhaps the adults they will become.
Table 4. Mixed Models Predicting Age 18 Health: Need or Get Medical Care.
| Fixed Effects | B | SE | t | P |
|---|---|---|---|---|
| Control | ||||
| Gender: Male | .04 | .03 | 1.34 | .179 |
| Race: White | .05 | .05 | 1.07 | .283 |
| Race: African American | .00 | .04 | 0.01 | .988 |
| Race: Hispanic | .03 | .07 | 0.49 | .622 |
| Family Income | .00 | .01 | -0.48 | .631 |
| Earlier Health | ||||
| Any Health Problem Age 6 to 16 | .09 | .03 | 3.41 | .001 |
| ACEs Trajectory | ||||
| Chronic ACEs | .07 | .03 | 2.03 | .042 |
| Early ACEs Only | -.05 | .06 | -0.94 | .347 |
Note. Boldface indicates significant at p < .05. Site was entered as a random effect.
What's New
The study provides longitudinal evidence that chronic exposure to adversity over the course of childhood is associated with health worries and with consumption of medical care in 18 year olds.
Acknowledgments
This research was supported by Grant 1R01DA031189 from the National Institute of Drug Abuse.
Footnotes
Conflicts: The authors have no conflicts of interest or corporate sponsors for this research.
Publisher's Disclaimer: This is a PDF file of an unedited manuscript that has been accepted for publication. As a service to our customers we are providing this early version of the manuscript. The manuscript will undergo copyediting, typesetting, and review of the resulting proof before it is published in its final citable form. Please note that during the production process errors may be discovered which could affect the content, and all legal disclaimers that apply to the journal pertain.
Contributor Information
Richard Thompson, Richard H. Calica Center for Innovation in Children and Family Services, Juvenile Protective Association, Chicago, IL
Emalee G. Flaherty, Department of Pediatrics, Ann & Robert H. Lurie Children's Hospital of Chicago, Chicago, IL
Diana J. English, School of Social Work, University of Washington, Seattle, WA
Alan J. Litrownik, Dept. of Psychology, San Diego State University, San Diego, CA
Howard Dubowitz, Dept. of Pediatrics, University of Maryland School of Medicin, Baltimore, MD
Jonathan B. Kotch, Dept. of Child and Maternal Health, University of North Carolina-Chapel Hill, Chapel Hill, NC
Desmond K. Runyan, Kempe Center for the Prevention and Treatment of Child Abuse and Neglect, University of Colorado School of Medicine, Aurora, CO.
References
- 1.Felitti VJ, Anda RF, Nordenberg D, Williamson DF, Spitz AM, Edwards V, et al. Relationship of childhood abuse and household dysfunction to many of the leading causes of death in adults. The Adverse Childhood Experiences (ACE) Study. Am J Prev Med. 1998;14:245–58. doi: 10.1016/s0749-3797(98)00017-8. [DOI] [PubMed] [Google Scholar]
- 2.Anda RF, Felitti VJ, Bremner JD, et al. The enduring effects of abuse and related adverse experiences in childhood. A convergence of evidence from neurobiology and epidemiology. Eur Arch Psychiatry Clin Neurosci. 2006 Apr;256:174–186. doi: 10.1007/s00406-005-0624-4. [DOI] [PMC free article] [PubMed] [Google Scholar]
- 3.Anda RF, Brown DW, Felitti VJ, Dube SR, Giles WH. Adverse childhood experiences and prescription drug use in a cohort study of adult HMO patients. BMC Public Health. 2008;8:198. doi: 10.1186/1471-2458-8-198. [DOI] [PMC free article] [PubMed] [Google Scholar]
- 4.Anda RF, Dong M, Brown DW, Felitti VJ, Giles WH, Perry GS, et al. The relationship of adverse childhood experiences to a history of premature death of family members. BMC Public Health. 2009;9:106. doi: 10.1186/1471-2458-9-106. [DOI] [PMC free article] [PubMed] [Google Scholar]
- 5.Dube SR, Felitti VJ, Dong M, et al. The impact of adverse childhood experiences on health problems: evidence from four birth cohorts dating back to 1900. Prev Med. 2003;37:268–277. doi: 10.1016/s0091-7435(03)00123-3. [DOI] [PubMed] [Google Scholar]
- 6.Hillis SD, Anda RF, Dube SR, Felitti VJ, Marchbanks PA, Marks JS. The association between adverse childhood experiences and adolescent pregnancy, long-term psychosocial outcomes, and fetal death. Pediatrics. 2004;113:320–327. doi: 10.1542/peds.113.2.320. [DOI] [PubMed] [Google Scholar]
- 7.Dong M, Anda RF, Felitti VJ, Williamson DF, Dube SR, Brown DW, et al. Childhood residential mobility and multiple health risks during adolescence and adulthood: the hidden role of adverse childhood experiences. Arch Pediatr Adolesc Med. 2005;159:1104–1110. doi: 10.1001/archpedi.159.12.1104. [DOI] [PubMed] [Google Scholar]
- 8.Hardt J, Rutter M. Validity of adult retrospective reports of adverse childhood experiences: review of the evidence. J Child Psychol Psychiatry. 2004;45:260–73. doi: 10.1111/j.1469-7610.2004.00218.x. [DOI] [PubMed] [Google Scholar]
- 9.Widom CS, Raphael KG, DuMont KA. The case for prospective longitudinal studies in child maltreatment research: Commentary on Dube, Williamson, Thompson, Felitti, and Anda (2004) Child Abuse Negl. 2004;28:715–22. doi: 10.1016/j.chiabu.2004.03.009. 2004. [DOI] [PubMed] [Google Scholar]
- 10.Flaherty EG, Thompson R, Litrownik AJ, Zolotor AJ, Dubowitz H, Runyan DK, et al. Adverse childhood exposures and reported child health at age 12. Academic Pediatrics. 2009;9:150–6. doi: 10.1016/j.acap.2008.11.003. [DOI] [PubMed] [Google Scholar]
- 11.Flaherty EG, Thompson R, Dubowitz H, Harvey EM, English DJ, Proctor LJ, et al. Adverse childhood experiences and child health in early adolescence. JAMA Pediatrics. 2013;16:622–29. doi: 10.1001/jamapediatrics.2013.22. [DOI] [PMC free article] [PubMed] [Google Scholar]
- 12.Appleyard K, Egeland B, van Dulmen MHM, Sroufe LA. When more is not better: The role of cumulative risk in child behavior outcomes. J Child Psychol Psychiatr. 2005;46:235–45. doi: 10.1111/j.1469-7610.2004.00351.x. [DOI] [PubMed] [Google Scholar]
- 13.Runyan DK, Curtis PA, Hunter WM, et al. Longscan: a consortium for longitudinal studies of maltreatment and the life course of children. Aggression and Violent Behavior. 1998;3:275–85. [Google Scholar]
- 14.Flaherty EG, Thompson R, Litrownik AJ, Theodore A, English DJ, Black MM, et al. Effect of early childhood adversity on child health. Arch Pediatr Adolesc Med. 2006;160:1232–38. doi: 10.1001/archpedi.160.12.1232. [DOI] [PubMed] [Google Scholar]
- 15.English DJ, Bangdiwala SI, Runyan DK, English DJ, Bangdiwala SI, Runyan DK. The dimensions of maltreatment: introduction. Child Abuse Negl. 2005 May;29:441–460. doi: 10.1016/j.chiabu.2003.09.023. [DOI] [PubMed] [Google Scholar]
- 16.Barnett D, Manly JT, Cicchetti D. Defining child maltreatment: The interface between policy and research. Norwood, NJ: Ablex; 1993. [Google Scholar]
- 17.Ewing JA. Detecting Alcoholism: The CAGE Questionaire. JAMA. 1984;252:1905–7. doi: 10.1001/jama.252.14.1905. [DOI] [PubMed] [Google Scholar]
- 18.Turner CF, Lessler JT, Gfroerer JC. Survey measurement of drug use: Methodological studies. Washington DC: US Department of Health and Human Services; 1992. [Google Scholar]
- 19.Hunter WM, Cox CE, Teagle S, et al. Measures for Assessment of Functioning and Outcomes in Longitudinal Research on Child Abuse. 2003;2 [Google Scholar]
- 20.Radloff LS. The CES-D Scale: A self-report depression scale for research in the general population. Applied Psychological Measurement. 1977;1:385–401. [Google Scholar]
- 21.Derogatis LR. Brief Symptom Inventory. Baltimore, MD: Clinical Psychometric Research; 1975. [Google Scholar]
- 22.Derogatis LR. BSI Brief Symptom Inventory Administration, Scoring, and Procedures Manual. 4th. Minneapolis, MN: National Computer Systems; 1993. [Google Scholar]
- 23.Straus MA. Measuring intrafamily conflict and violence: The conflict tactics scale. Journal of Marriage and the Family. 1979;41:75–88. [Google Scholar]
- 24.Achenbach TM, Edelbrock C. Manual for the child behavior checklist/4-18 and 1991 profile. Burlington: Departent of Psychiatry, University of Vermont; 1991. [Google Scholar]
- 25.Knight ED, Smith JB, Martin LM, the LONGSCAN Investigators Measures for Assessment of Functioning and Outcomes in Longitudinal Research on Child Abuse and Neglect Volume 5: Young Adulthood (Age 18) 2011 Accessible at the LONGSCAN web site ( http://www.iprc.unc.edu/longscan/)
- 26.Krause N, Jay G. What do global health items measure? Med Care. 1994;9:930–42. doi: 10.1097/00005650-199409000-00004. [DOI] [PubMed] [Google Scholar]
- 27.Muthen B. Secon-generation structural equation modeling with a combination of categorical and continuous latent variables: New opportunities for latent class-latent growth modeling. In: Collins LM, Sayer A, editors. New methods for the analysis of change. Washington, DC: American Psychological Association; 2001. pp. 291–322. [Google Scholar]
- 28.U.S. Department of Health and Human Services, Administration for Children and Families, Administration on Children, Youth and Families, Children's Bureau. Child maltreatment 2009. 2010 [Google Scholar]
- 29.Finkelhor D, Shattuck A, Turner H, Hamby S. Improving the Adverse Childhood Experiences Study scale. Arch Pediatr Adolesc Med. 2013;167:70–5. doi: 10.1001/jamapediatrics.2013.420. [DOI] [PubMed] [Google Scholar]
- 30.Thompson R, Litrownik AJ, Isbell P, Everson MD, English DJ, Dubowitz H, et al. Adverse experiences and suicidal ideation in adolescence: Exploring the link using the LONGSCAN samples. Psychology of Violence. 2012;2:211–225. doi: 10.1037/a0027107. [DOI] [PMC free article] [PubMed] [Google Scholar]
- 31.Schilling EA, Aseltine R, Gore S. The impact of cumulative childhood adversity on young adult mental health: Measures, models, and interpretations. Soc Sci Med. 2008;66:1140–51. doi: 10.1016/j.socscimed.2007.11.023. [DOI] [PMC free article] [PubMed] [Google Scholar]
- 32.Chartier MJ, Walker JR, Naimark B, Chartier MJ, Walker JR, Naimark B. Childhood abuse, adult health, and health care utilization: results from a representative community sample. Am J Epidemiol. 2007;165:1031–8. doi: 10.1093/aje/kwk113. [DOI] [PubMed] [Google Scholar]
- 33.Hulme PA. Symptomatology and health care utilization of women primary care patients who experienced childhood sexual abuse. Child Abuse Negl. 2000;24:1471–84. doi: 10.1016/s0145-2134(00)00200-3. [DOI] [PubMed] [Google Scholar]