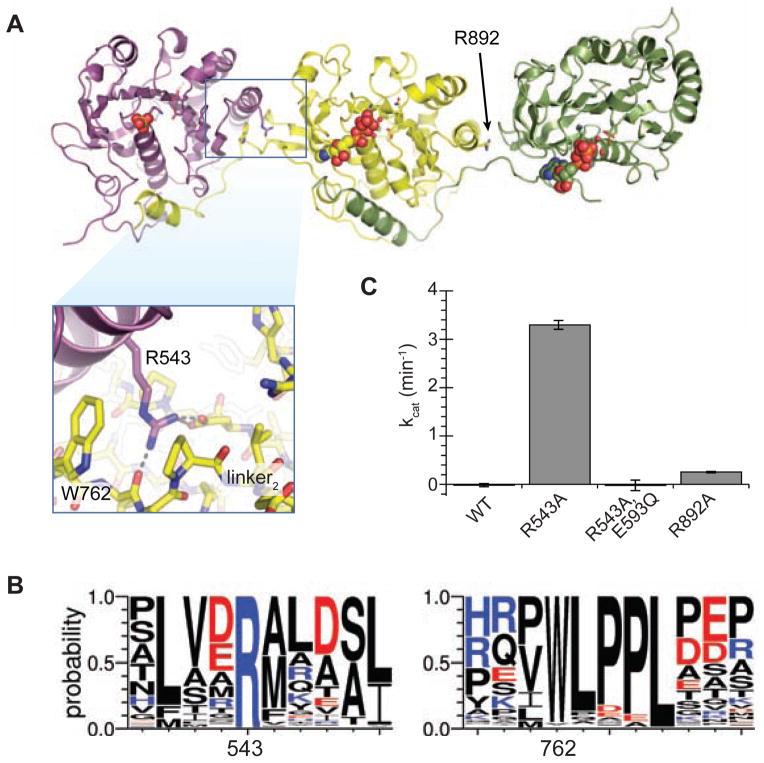
Figure 5. ATPase1 is held in an autoinhibited state by inter-ATPase interactions.
(A) Crystal structure of TcEccC(cyto) with inset highlighting the interface between ATPase1 and ATPase2. (B) Logo diagram representing the alignment of 142 unique EccC sequences. (C) Disruption of ATPase1-ATPase2 interface by R543A mutation activates the ATPase activity of TcEccC, which requires the Walker B catalytic residue in ATPase1 (E593Q). An analogous mutation between ATPase2 and ATPase3, R892A, led to a small increase in activity. The graph represents three measurements of ATPase activity at an enzyme concentration of 1 μM ATPase with saturating ATP*MgCl2 (10 mM). Also see Figure S4.

