

Abstract
Primary normal human bronchial/tracheal epithelial (NHBE) cells, derived from the distal-most aspect of the trachea at the bifurcation, have been used for a number of studies in respiratory disease research. Differences between the source tissue and the differentiated primary cells may impact infection studies based on this model. Therefore, we examined how well-differentiated NHBE cells compared with their source tissue, the human distal trachea, as well as the ramifications of these differences on influenza A viral pathogenesis research using this model. We employed a histological analysis including morphological measurements, electron microscopy, multi-label immunofluorescence confocal microscopy, lectin histochemistry, and microarray expression analysis to compare differentiated NHBEs to human distal tracheal epithelium. Pseudostratified epithelial height, cell type variety and distribution varied significantly. Electron microscopy confirmed differences in cellular attachment and paracellular junctions. Influenza receptor lectin histochemistry revealed that α2,3 sialic acids were rarely present on the apical aspect of the differentiated NHBE cells, but were present in low numbers in the distal trachea. We bound fluorochrome bioconjugated virus to respiratory tissue and NHBE cells and infected NHBE cells with human influenza A viruses. Both indicated that the pattern of infection progression in these cells correlated with autopsy studies of fatal cases from the 2009 pandemic.
Keywords: confocal microscopy, electron microscopy, experimental pathology, immunohistochemistry, respiratory tract, viruses, viral diseases
Introduction
Normal human bronchial epithelial (NHBE) cells, also known as normal human tracheobronchial epithelial cells, are a primary cell line derived from biopsies at the distal-most aspect of the trachea and carina. They have been used for a number of studies in respiratory biology as well as respiratory disease research, including therapeutics development (Hackett et al. 2009; Kesimer et al. 2009; LeSimple et al. 2010; Lopez-Souza et al. 2009; Thompson et al. 2006b; Triana-Baltzer et al. 2010; Zhang et al. 2005). Post-harvest and pre-distribution to researchers, these cells are de-differentiated by the vendor. Typically, researchers differentiate the cells into pseudostratified epithelium, composed of basal, ciliated and non-ciliated (goblet) cells, prior to conducting their experiments (Gray et al. 1996). Differentiated NHBEs have been compared with undifferentiated NHBEs and their source tissue, trachea, using microarray analysis (Dvorak et al. 2011; Martinez-Anton et al. 2013; Pezzulo et al. 2011). Additionally, their sialic acid receptor distribution has been examined (Kogure et al. 2006; Thompson et al. 2006a; Ayora-Talavera et al. 2009). However, the reported findings are conflicting.
A side-by-side comparison of the morphology and cell type characteristics of these cells compared with distal trachea is lacking, despite their wide use for influenza A virus research (Brookes et al. 2011; Chan et al. 2010; Ilyushina et al. 2012a; Ilyushina et al. 2008; Ilyushina et al. 2012b; Mok et al. 2011; Oshansky et al. 2011; Scull et al. 2009; Song et al. 2009; Steel et al. 2008; Suksatu et al. 2009; Triana-Baltzer et al. 2010; Wan and Perez 2007). Differences between the source tissue and the re-differentiated primary cell line may impact respiratory viral infection studies based on this in vitro model. Therefore, this study examined how well-differentiated NHBE cells compared with their source tissue, the human distal trachea, as well as the ramifications of these differences on influenza A virus pathogenesis research conducted with differentiated NHBE cells.
In this study, we employed histological analysis, immunofluorescence, and electron microscopy (EM) to characterize differentiated NHBEs in greater detail in comparison to their source tissue. Second, influenza receptor distribution in differentiated NHBE cells was compared with that in distal trachea and carina samples using lectin histochemistry for sialic acids (Nicholls et al. 2007; Suzuki 2005). Third, we examined the binding pattern of Alexa Fluor-594-conjugated influenza A/New York/312/2001 (H1N1) virus (NY312) to sections of distal trachea, carina and differentiated NHBEs. Fourth, we conducted a series of infection studies with seasonal and 2009 pandemic influenza viruses, NY312 and A/CA/04/2009 (H1N1) virus (CA04), respectively. Finally, we evaluated influenza A virus antigen distribution in conjunction with apical cell type markers in both a section of human trachea from an autopsy of an individual who died from a primary infection with 2009 pandemic influenza and differentiated NHBEs infected with CA04.
Materials & Methods
Tissues
Anonymous donor female human adult lung tissue and distal tracheal tissue, with a post-mortem interval of several hours, were fixed in 10% neutral-buffered formalin (NBF), dehydrated and embedded in paraffin (Capital Biosciences; Rockville, MD). Additionally, anonymous female human adult post-mortem tracheal and carina tissues were obtained from the autopsy service of the Laboratory of Pathology, Center for Cancer Research, National Cancer Institute, National Institutes of Health (NIH) (Bethesda, MD) and similarly processed. In both cases, distal tracheal samples were sourced 2 cm proximal to the carina. Immediately adjacent tissue samples from the latter donor were also fixed in 2.5% glutaraldehyde in 0.1 M Sorensen’s sodium phosphate buffer for EM analysis. Both donors were reported to have no pulmonary complications and the respiratory tissues were within normal limits with histopathology. This study also used formalin-fixed, paraffin-embedded (FFPE) autopsy tissues, as described by Gill et al. (2010). Finally, additional anonymous normal human tissue sections used for immunohistochemistry controls were also obtained from the NCI Laboratory of Pathology. In all cases, procedures for obtaining tissues from cadavers donated to science were observed.
Normal Human Bronchial Epithelial Cells
NHBE cells (CC-2541, Lonza; Walkersville, MD) were from a single anonymous female, non-smoking donor who lacking respiratory pathology. The cells were differentiated according to the manufacturer’s instructions. Briefly, passage 1 NHBE cells were grown submerged in bronchial air-liquid interfaced (B-ALI) growth medium supplemented with Lonza SingleQuots (expansion media) in 6.5-mm transwell-clear membrane supports coated with rat tail collagen (BD Bioscience; Bedford, MA) until they reached confluence (3–5 days). At this point, the apical medium was removed in order to create an air–liquid interface and the basal compartment medium was refreshed with B-ALI differentiation media. During the 4-week-long cellular differentiation period, medium in the basal compartment was changed every 48–72 h. Once mucus production commenced, mucus was removed at the same frequency using a gentle aspiration technique. At 28 days, cell cultures had formed a mature pseudostratified epithelium, which was confirmed by direct light microscopic (LM) examination and were considered to be ready for infections. Samples were fixed in NBF for LM and confocal microscopy and in 2.5% glutaraldehyde in 0.1 M Sorensen’s sodium phosphate buffer for EM. Samples of confluent, undifferentiated NHBE cells were also used for LM.
Viruses
All influenza viruses were propagated in Madin-Darby Canine Kidney epithelial cells prior to their use for bioconjugation or infection studies using standard techniques (Balish et al. 2013). The following previously described viruses were used in this study: A/New York/312/2001 (NY312) and A/California/04/2009 (CA04) (Jagger et al. 2010; Qi et al. 2009). All viruses and infectious samples were handled in accordance with the guidelines of the NIH under the supervision of the NIH Department of Health and Safety.
General Immunofluorescence Techniques
Five µm-thick sections of FFPE cells or tissues were placed on positively charged slides (North Carolina State University College of Veterinary Medicine Histopathology Lab; Raleigh, NC). Slides were deparaffinized, rehydrated and, unless otherwise stated, subjected to heat-based antigen retrieval in pH 6 citrate buffer (Dako-Target retrieval buffer s1699; DAKO, Carpinteria, CA) using a vegetable steamer technique for 15 min followed by 20 min cooling. Unless otherwise stated, tissues or cells were blocked with 5% normal serum derived from the species in which the secondary antibody was raised for 20 min and then incubated with an appropriate primary antibody. Prior to lectin application, a streptavidin-biotin block (SP-2002, Vector Laboratories; Burlingame, CA) and a carbohydrate block (SP-5040, Vector Laboratories) were applied, as per the vendor’s instructions. A carbohydrate block was applied as above before applying the fluorochrome bioconjugated lectin or virus. After the application of all markers of interest, either DAPI (D1306; Molecular Probes, Eugene, OR) or DRAQ 5 (4084; Cell Signaling Technology, Danvers, MA) were applied, as per the vendors’ instructions, briefly washed, and then mounted in either Prolong Gold or Slow Fade Gold antifade reagents (P36930 and S36936, Life Technologies; Grand Island, NY). Finally, unless otherwise noted, all primary antibody incubations were conducted for 1 hr at room temperature and all conjugated secondary antibody and streptavidin conjugate incubations were for 30 min at room temperature.
NY312 Alexa Fluor 594 Conjugate
Large batches of NY312 virus were inactivated using β-propriolactone (P5648; Sigma-Aldrich, St Louis, MO), as previously described (Budowsky et al. 1993; Goldstein and Tauraso 1970) and concentrated by ultra-centrifugation using a discontinuous sucrose gradient. Concentrated virus was collected and bioconjugated with Alexa Fluor 594 carboxylic acid, succinimidyl ester, mixed isomers (AF594-SE) (A-20004, Molecular Probes) at a 4:1 virus/dye ratio. The mixture was incubated for 1 hr on a stir plate at room temperature in the dark and filtered with a 100,000 MWCO Vivaspin 500 centrifugal concentrator (VS0141; Vivaproducts, Littleton, MA). Prior to inactivation, virus activity was confirmed by standard plaque assay (Gaush and Smith 1968). After each stage in the process, the virus was tested to ensure maintenance of hemagglutinin binding capability using standard techniques (Balish et al. 2013). Protein concentrations were assayed using Bradford technique as per the vendor’s instructions (23235 Micro BCA Protein Assay Kit; Pierce Biotechnology, Rockford, IL).
Jacalin Alexa Fluor 680 Conjugate
Unconjugated Jacalin lectin (L-1150, VL) was bioconjugated with Alexa Fluor 680 NHS ester (A-20172; Molecular Probes) according to vendor’s kit instructions.
Microarray Expression Analysis
To ascertain whether neuroendocrine and professional immune cells were present in fully differentiated NHBE cells, we mined data from a previously completed microarray analysis of a day 28, fully differentiated, NHBE cell sample from a non-smoker (Martinez-Anton et al. 2013). Briefly, sample preparation was completed according to standard Affymetrix procedures using the Genechip 3’IVT Express Kit and the Human Genome U133 plus 2.0 chip (Affymetrix; Santa Clara, CA). Specifically, we checked for the presence of the following genes: CHGA, ENO2, SYP and NCAM1, expressed by neuroendocrine cells; CD68, expressed by monocytes, macrophages and dendritic cells; CD207, expressed by dendritic cells only; and CD163, expressed by macrophages only. HMMR was used as a positive control. Data were generated using Affymetrix Expression Console Build 1.3.1.187. The probeset summarization was calculated using the MAS 5.0 signal intensity algorithm. Intensity values for each probeset along with their present absent calls were reported after running the Expression Console software on CEL files.
Immunofluorescence for Club Cells
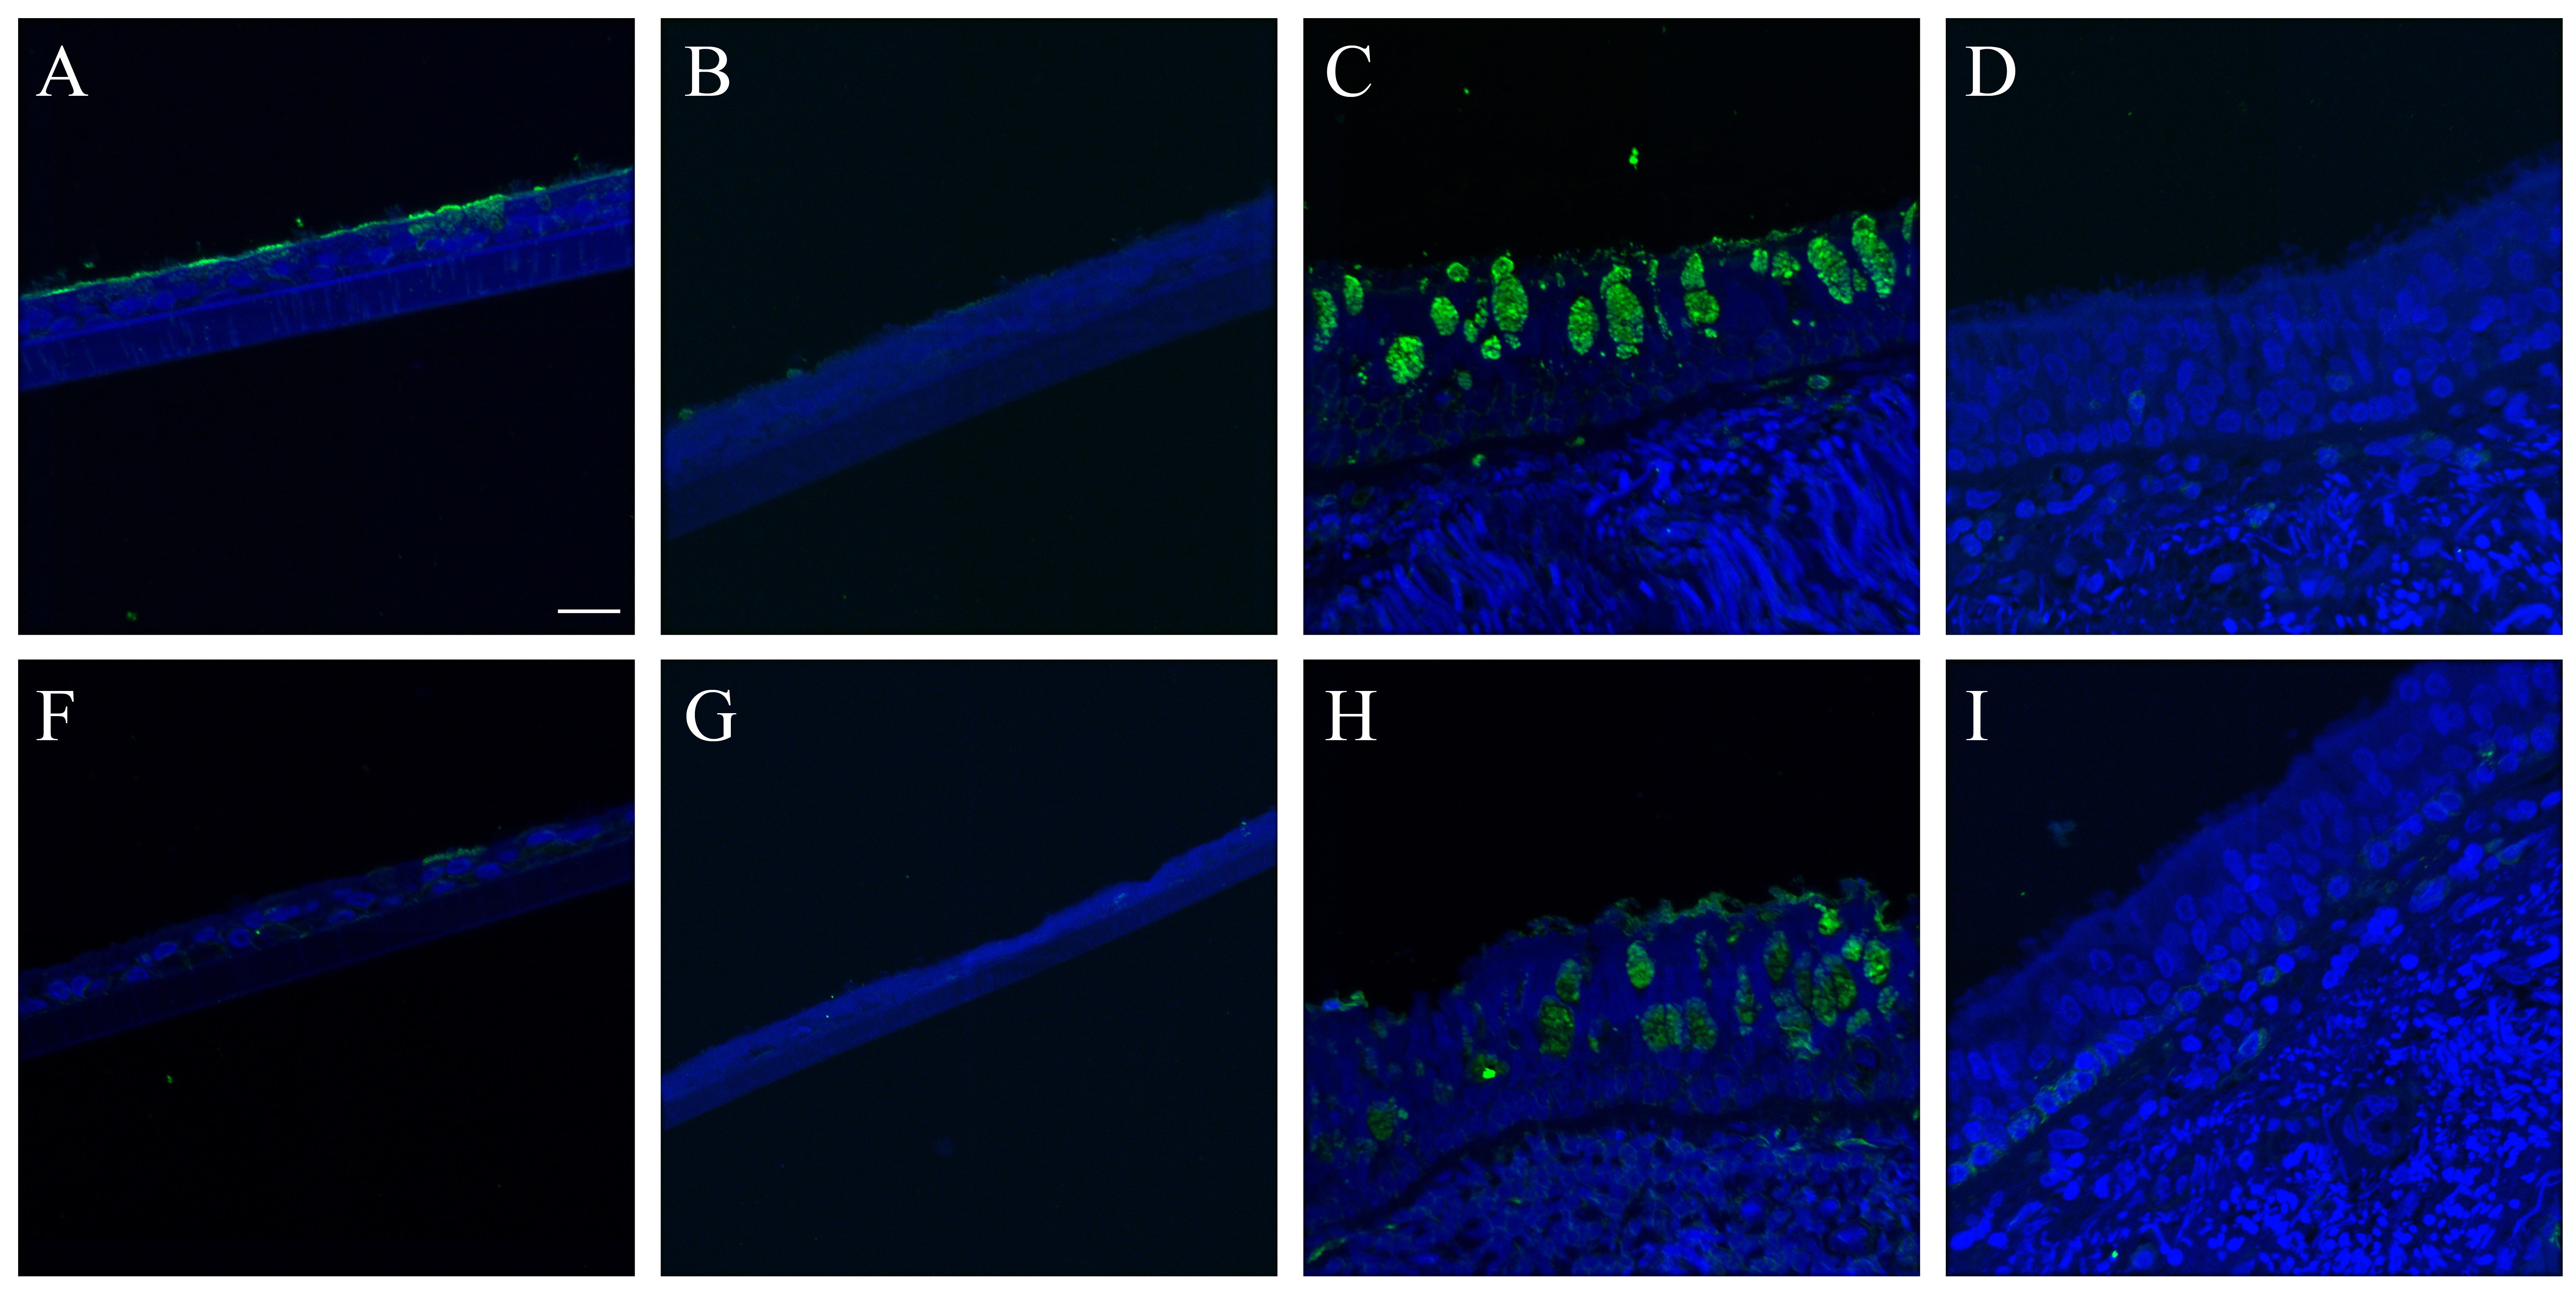
Due to the presence of genes that encode proteins expressed by club cells in the differentiated NHBE microarray dataset (Martinez-Anton et al. 2013), immunofluorescence for the presence of this cell type was done on FFPE differentiated NHBE cells, human lung and distal trachea tissues sections, without antigen retrieval. The monoclonal mouse anti-human CC10 antibody (sc-130411; Santa Cruz Biotechnology, Dallas, TX) was used alone and in conjunction with the goblet cell marker, biotinylated Jacalin (B-1155, VL). These markers were visualized with Dylight 549-AffiniPure Donkey Anti-Mouse (discontinued; Jackson ImmunoResearch Laboratories, West Grove, PA) and Chromeo 494 streptavidin conjugate (16113; Active Motif, Carlsbad, CA), respectively. When CC10 signal was absent on the NHBE cells and distal trachea, an intermediary biotinylation step with Biotin-SP-AffiniPure Donkey Anti-Mouse IgG (715-065-151, Jackson ImmunoResearch Laboratories) was tried.
Cell Type Marker Immunofluorescence on Distal Trachea and Carina
In order to evaluate the distribution of cell types of interest within the epithelium of the distal trachea and carina samples, a multi-label was constructed to visualize ciliated, goblet, basal, neuroendocrine and antigen-presenting cells, macrophages and dendritic cells. The primary–secondary pairings were applied in the following order: macrophages and dendritic cells were detected with goat polyclonal anti-human CD68 antibody (C-18, sc-7082, 1:25 dilution; Santa Cruz Biotechnology) and visualized with Cy3-AffiniPure donkey anti-goat IgG (705-165-147, 1:200 dilution; Jackson ImmunoResearch Laboratories); neuroendocrine cells were detected with rabbit polyclonal anti-human Chromagranin A (A0430, 1:300 dilution; DAKO) overnight at 4°C and visualized with Dylight 594-AffiniPure donkey anti-rabbit IgG (1:200 dilution); basal cells were detected with the aforementioned rabbit polyclonal anti-cytokeratin 5 at 1:300 overnight at 4°C and visualized with Alexa Fluor 633 goat anti-rabbit IgG (A-21070, Invitrogen) at 8 µg/ml; ciliated cells were detected with the same β-tubulin antibody as above at 1:50 and visualized with Dylight 488-AffiniPure donkey anti-mouse IgG (discontinued, Jackson Immuno-Research Laboratories) at 1:200; goblet cells were detected and visualized by application of the AF680-Jac, as above. DAPI was applied to the sections. Prior to the application of the basal cell marker, the tissue was blocked with 10% normal rabbit serum, and then incubated with AffiniPure Fab fragment goat anti-rabbit IgG (111-007-003, Jackson ImmunoResearch Laboratories) at a dilution of 1:10 for 1 hr to block the prior rabbit primary antibody. The tissue sections were then fixed in 4% paraformaldehyde for 3 min, and blocked with 5% normal goat serum.
Cell Type Marker Immunofluorescence on Differentiated NHBE Cells
We used both existing cell type marker-labeled cells (Martinez-Anton et al. 2013) and the uninfected control cells from the infection study detailed below. These additional samples were labeled as described above, with the exception that anti-CD68 and anti-Chromagranin A labelings were omitted. Finally, due to microarray results, we performed immunofluorescence for Chromagranin A to screen for neuroendocrine cells.
Morphology Observations by Light and Electron Microscopy
Initial observations of morphological differences were made using standard hematoxylin and eosin (H&E)-stained slides. A detailed examination was undertaken using the immunofluorescently labeled human distal trachea, carina and NHBE cells. The most representative slice from differential interference contrast (DIC) imaging was selected for each z-stack and merged with max projected images of multi-labeled fluorescence. Additionally, 30 epithelial height measurements from unique locations were taken and averaged for eight samples of differentiated NHBEs, two samples of the distal trachea and one of the carina. Measurements were made using Imaris 7.6.3 (Bitplane; Zurich, Switzerland) using the ruler to measure from the basal lamina to the apical epithelial surface without including cilia projecting above the apical cell surfaces.
We also reviewed samples of both human respiratory tissue and differentiated NHBE cells by transmission electron microscopy (TEM) and the NHBE cells by scanning electron microscopy (SEM). For this work, glutaraldehyde-fixed, differentiated NHBE cells were excised from the plastic frame supporting the cell membrane using a scalpel. Samples were processed as previously described (Howe et al. 2010) for TEM with two changes. First, processing was done at approximately 150 W and 250 W in a BioWave Model microwave processor (Ted Pella, Inc.; Redding, CA); second, an Araldite resin (Structure Probe, Inc.; West Chester, PA)—rather than Spurr’s—was used for embedding. Post-processed samples were placed in flat embedding molds (Ted Pella, Inc.) perpendicular to the cutting surface before polymerizing. For SEM, samples were processed as described for TEM through post-fixation in osmium, and dehydrated in EtOH, as described. Samples were critical-point dried through liquid CO2, lightly sputter-coated with iridium, and examined on a model SU8000 field emission SEM (Hitachi High Technologies America; Dallas, TX).
Lectin Histochemistry with Apical Cell Type Markers
α2,3 sialic acid (SIA) linkages were detected with biotinylated Maackia amurensis isotype I and II (MAA I and MAA II) lectins (B-1315 and B-1265, VL), and α2,6 SIA linkages with biotinylated mixed isotype Sambucus nigra (SNA) lectin (B-1305, VL). The biotinylated lectins were visualized with streptavidin Alexa Fluor 594 conjugate (S-11227, MP). Goblet cells were detected with AF680-Jacalin. Ciliated cells were detected as before and visualized with Dylight 488-AffiniPure donkey anti-mouse IgG. Nuclei were visualized with DAPI. A 90-min incubation of 4 U/ml or 8 U/ml neuraminidase from Clostridium perfringens (N2876, lot # 071M8636V, Sigma-Aldrich) performed at room temperature served as an additional negative control.
NY312-AF594 Binding to Cells and Tissues
A modified version of the above protocol for cell type markers was used to label the ciliated and goblet cells in combination with bound AF594-NY312 on distal trachea, carina and differentiated NHBE cells. AF594-NY312 diluted in TBS was applied for 30 min at room temperature. Neuraminidase-treated control slides were prepared to check for a loss of viral binding in the absence of the sialic acid receptors for the virus.
Receptor Lectin and Virus Binding Competition
To confirm AF594-NY312 affinity for the same receptors as those labeled by receptor lectins, AF594-NY312 and biotinylated-SNA were applied as described in alternating order on individual slides. Biotinylated SNA was detected with streptavidin Alexa Fluor 488 conjugate (S-11223; Molecular Probes). SNA only and virus only control slides, with and without neuraminidase pre-treatment, were also included.
NHBE Influenza A Infection Studies
To examine variation in infections between seasonal and pandemic 2009 viruses, we conducted infections with both NY312 and CA04 at a multiplicity of infection (MOI) of 0.1 in triplicate. Prior to virus application, mucus was aspirated from each NHBE well, and the cells were incubated in PBS for 1 hr to solubilize the remaining mucus (37°C, 5% CO2) and then aspirated once more. Virus at the appropriate dilution in 100 µl PBS was applied to each well and cells were incubated for 1 hr at 37°C in 5% CO2. Virus was removed by aspiration, cells washed once with PBS, aspirated again, and 100 µl of PBS was added to prevent desiccation. Cells were incubated until the appropriate end time-points (4, 8, 24, 48 or 72 hr) and placed in NBF. Uninfected control cell inserts were removed and immersed in NBF prior to conducting the infections on the cells.
Replication kinetics at the same time-points were determined in triplicate for both viruses using the same infection technique in a separate experiment. At the appropriate time-points for each infected insert, the apical supernatant was collected by adding 200 µl PBS to the sample, collecting the apical fluid, repeating this process and then placing the insert in NBF. All supernatants were stored individually in cryovials at -80°C. Standard plaque assays for influenza A with a crystal violet end product were undertaken (Gaush and Smith 1968). Graphs and analysis were performed using Prism 6.0c (GraphPad; La Jolla, CA).
Immunofluorescence for Influenza Antigen with Cell Type Markers on NHBEs
Infected and uninfected (control) NHBE cells on their membranes were fixed in 10% NBF, processed, and the slides made as described above. After examination of multiple time-points for the influenza antigen, we selected the 24-hr time-point for demonstration of infected differentiated NHBE cells with cell type markers for both viruses. Immunofluorescence for influenza antigen was performed using a 10% donkey serum block, followed by incubation with polyclonal anti-H1N1 influenza A (ab20841; Abcam, Cambridge, UK) at 1:200 and Dylight-594 AffiniPure donkey anti-goat IgG (discontinued, Jackson Immuno-Research Laboratories) at 1:300. For the influenza antigen with immunofluorescently stained cell type markers, the influenza antigen labeling was combined with the aforementioned ciliated, goblet and basal cell labeling technique.
Immunofluoresence for Influenza Antigen with Cell Type Markers on Human Tracheal Tissue
Unstained, positively charged slides of human tracheal tissue from a fatal 2009 pandemic influenza case, lacking secondary bacterial infection, as discussed in Gill et al. (2010) was confirmed positive by influenza A viral antigen immunohistochemistry. Similarly screened, normal, uninfected tracheal tissue samples sourced from NCI Laboratory of Pathology were used as uninfected controls. Sections of this tissue were treated identically to the infected NHBE cells described in the last section yielding sections immuno-fluorescently labeled for influenza antigen and cell type markers.
Confocal Image Capture and Analysis
Slides were imaged on Leica TCS SP5 X WLL and TCS SP8 systems (Leica Microsystems; Wetzler, Germany). All image post-processing and analysis was done with Imaris then Adobe Photoshop CS6 (Adobe Systems, Inc.; San Jose, CA). Where statements regarding relative intensity are made (e.g., receptor lectins, influenza antigen, or bioconjugated virus), the signal intensity levels for the markers were kept constant during image capture and post-processing. Final figure compilation was done in Adobe InDesign CS6 Extended (Adobe Systems, Inc.).
Results
Comparison of Normal Human Bronchial Epithelial Cells to Their Source Tissue Type
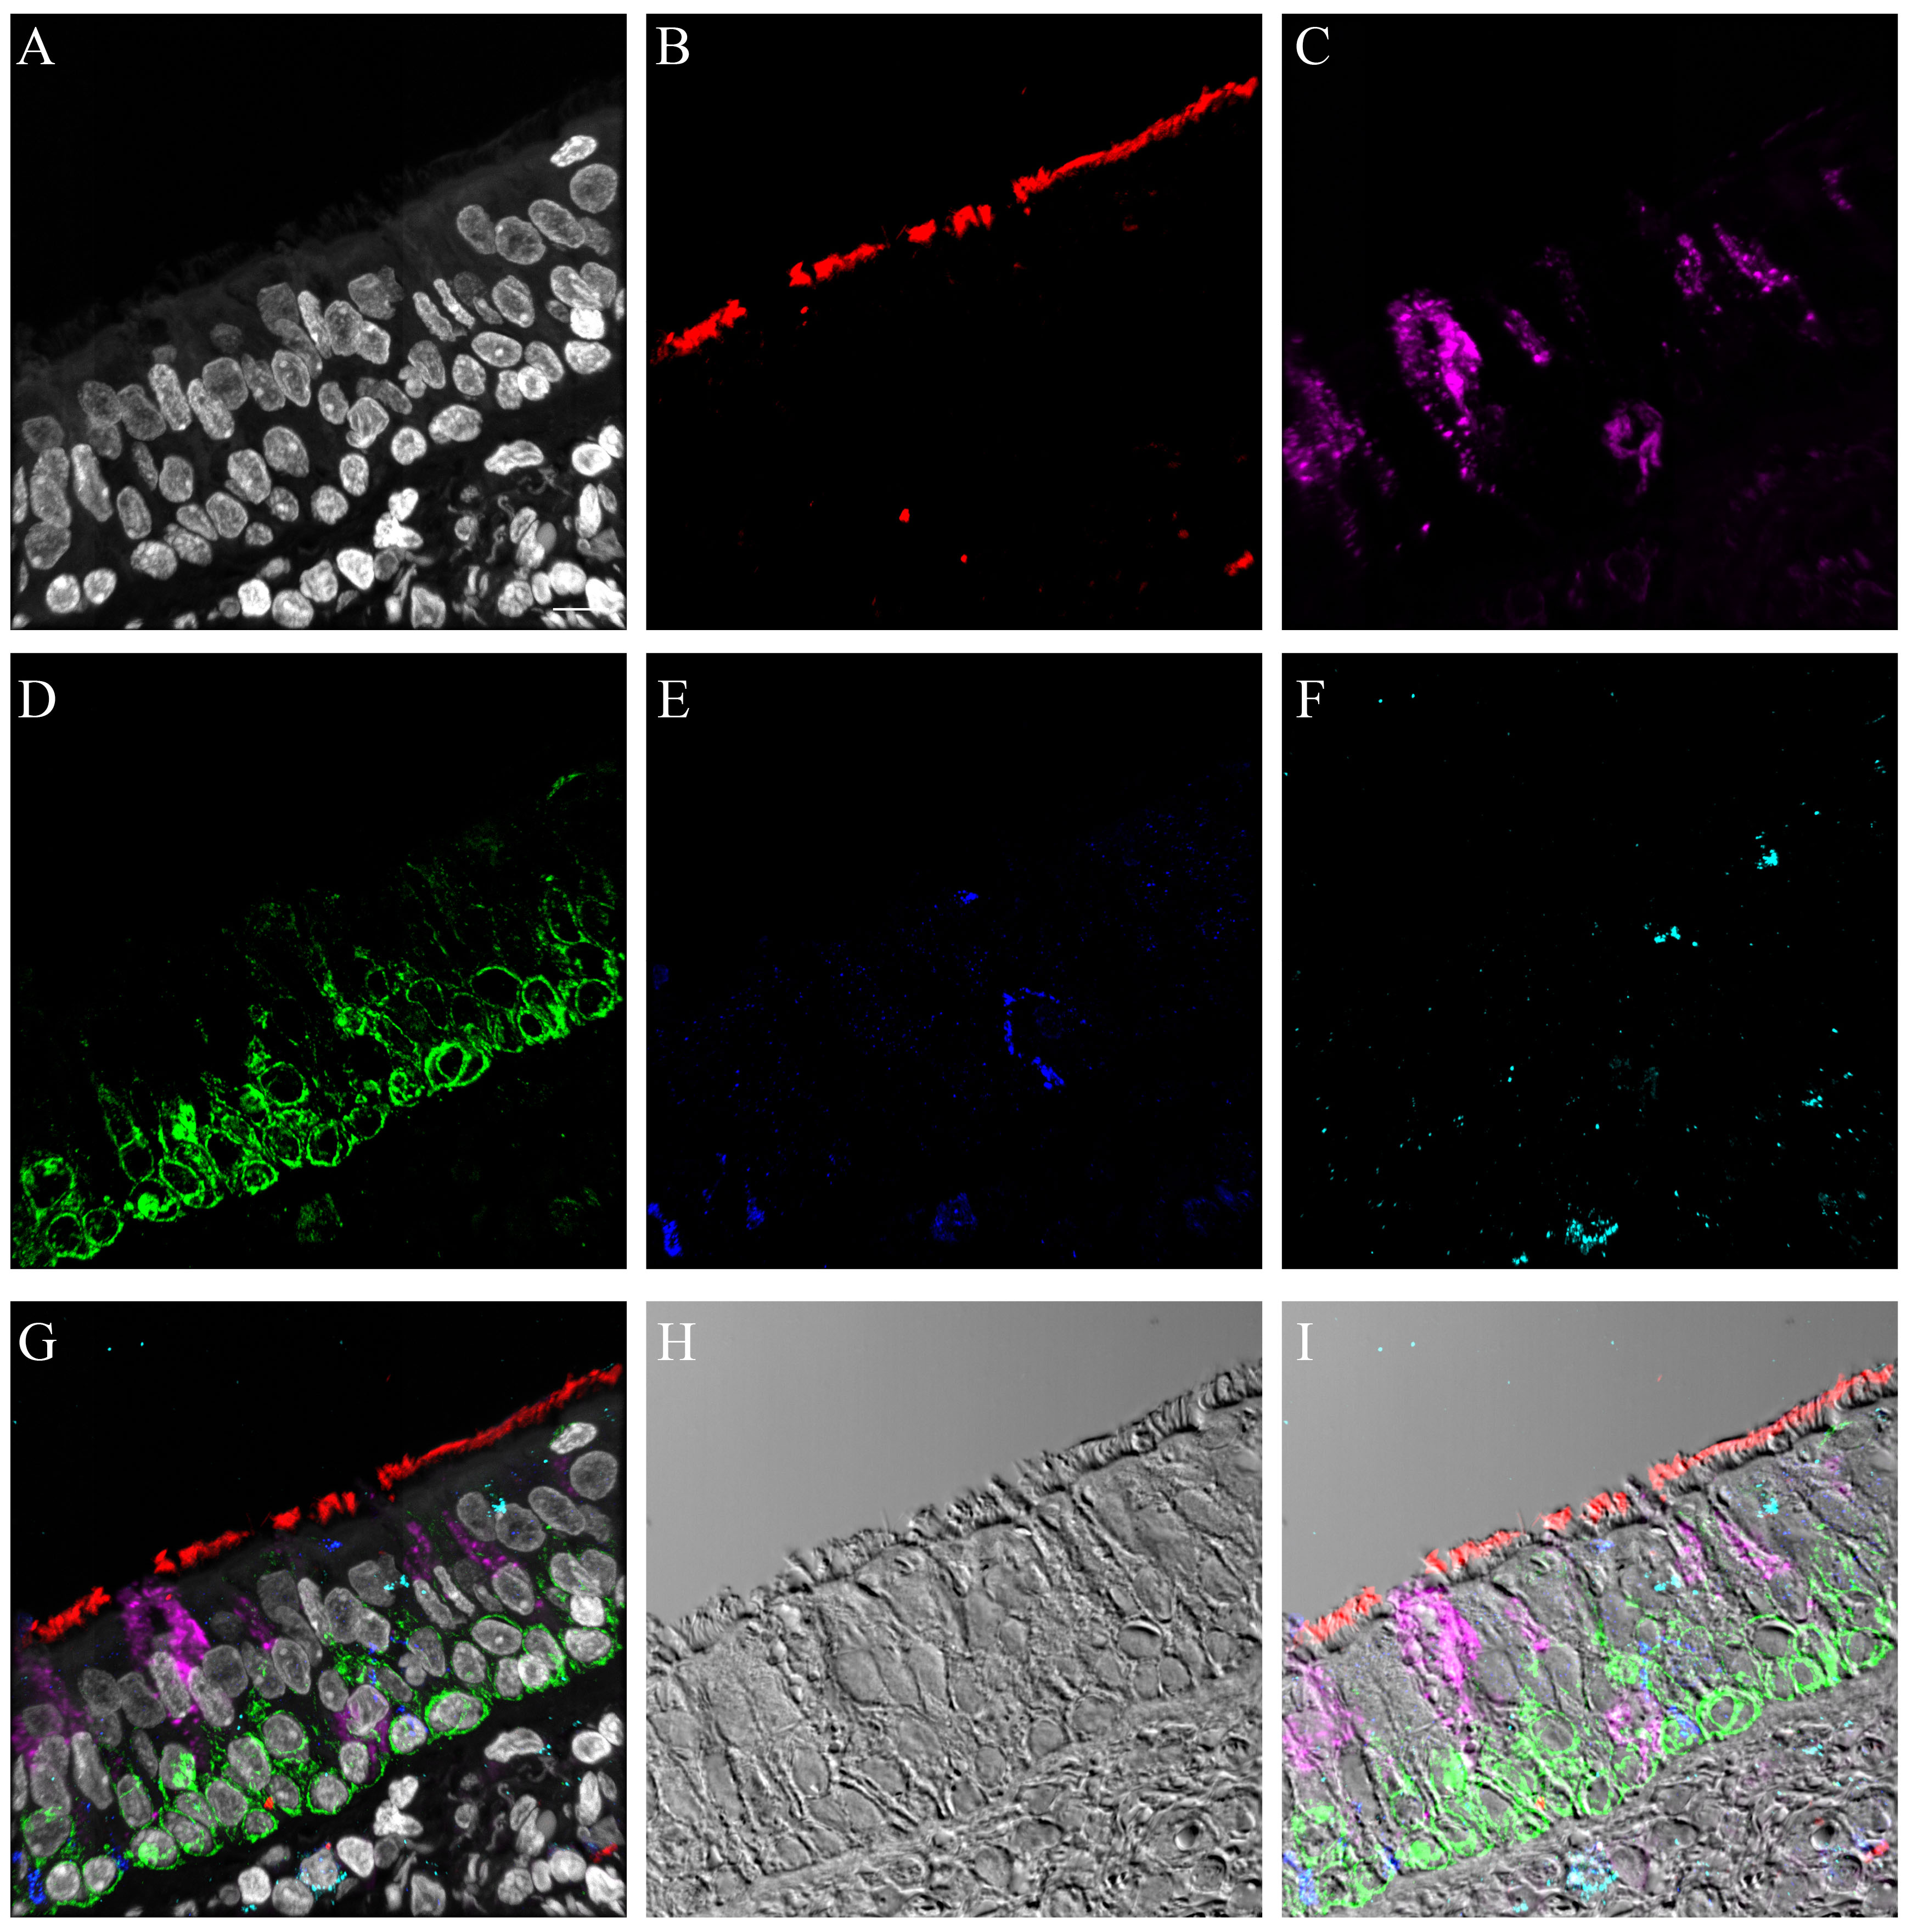
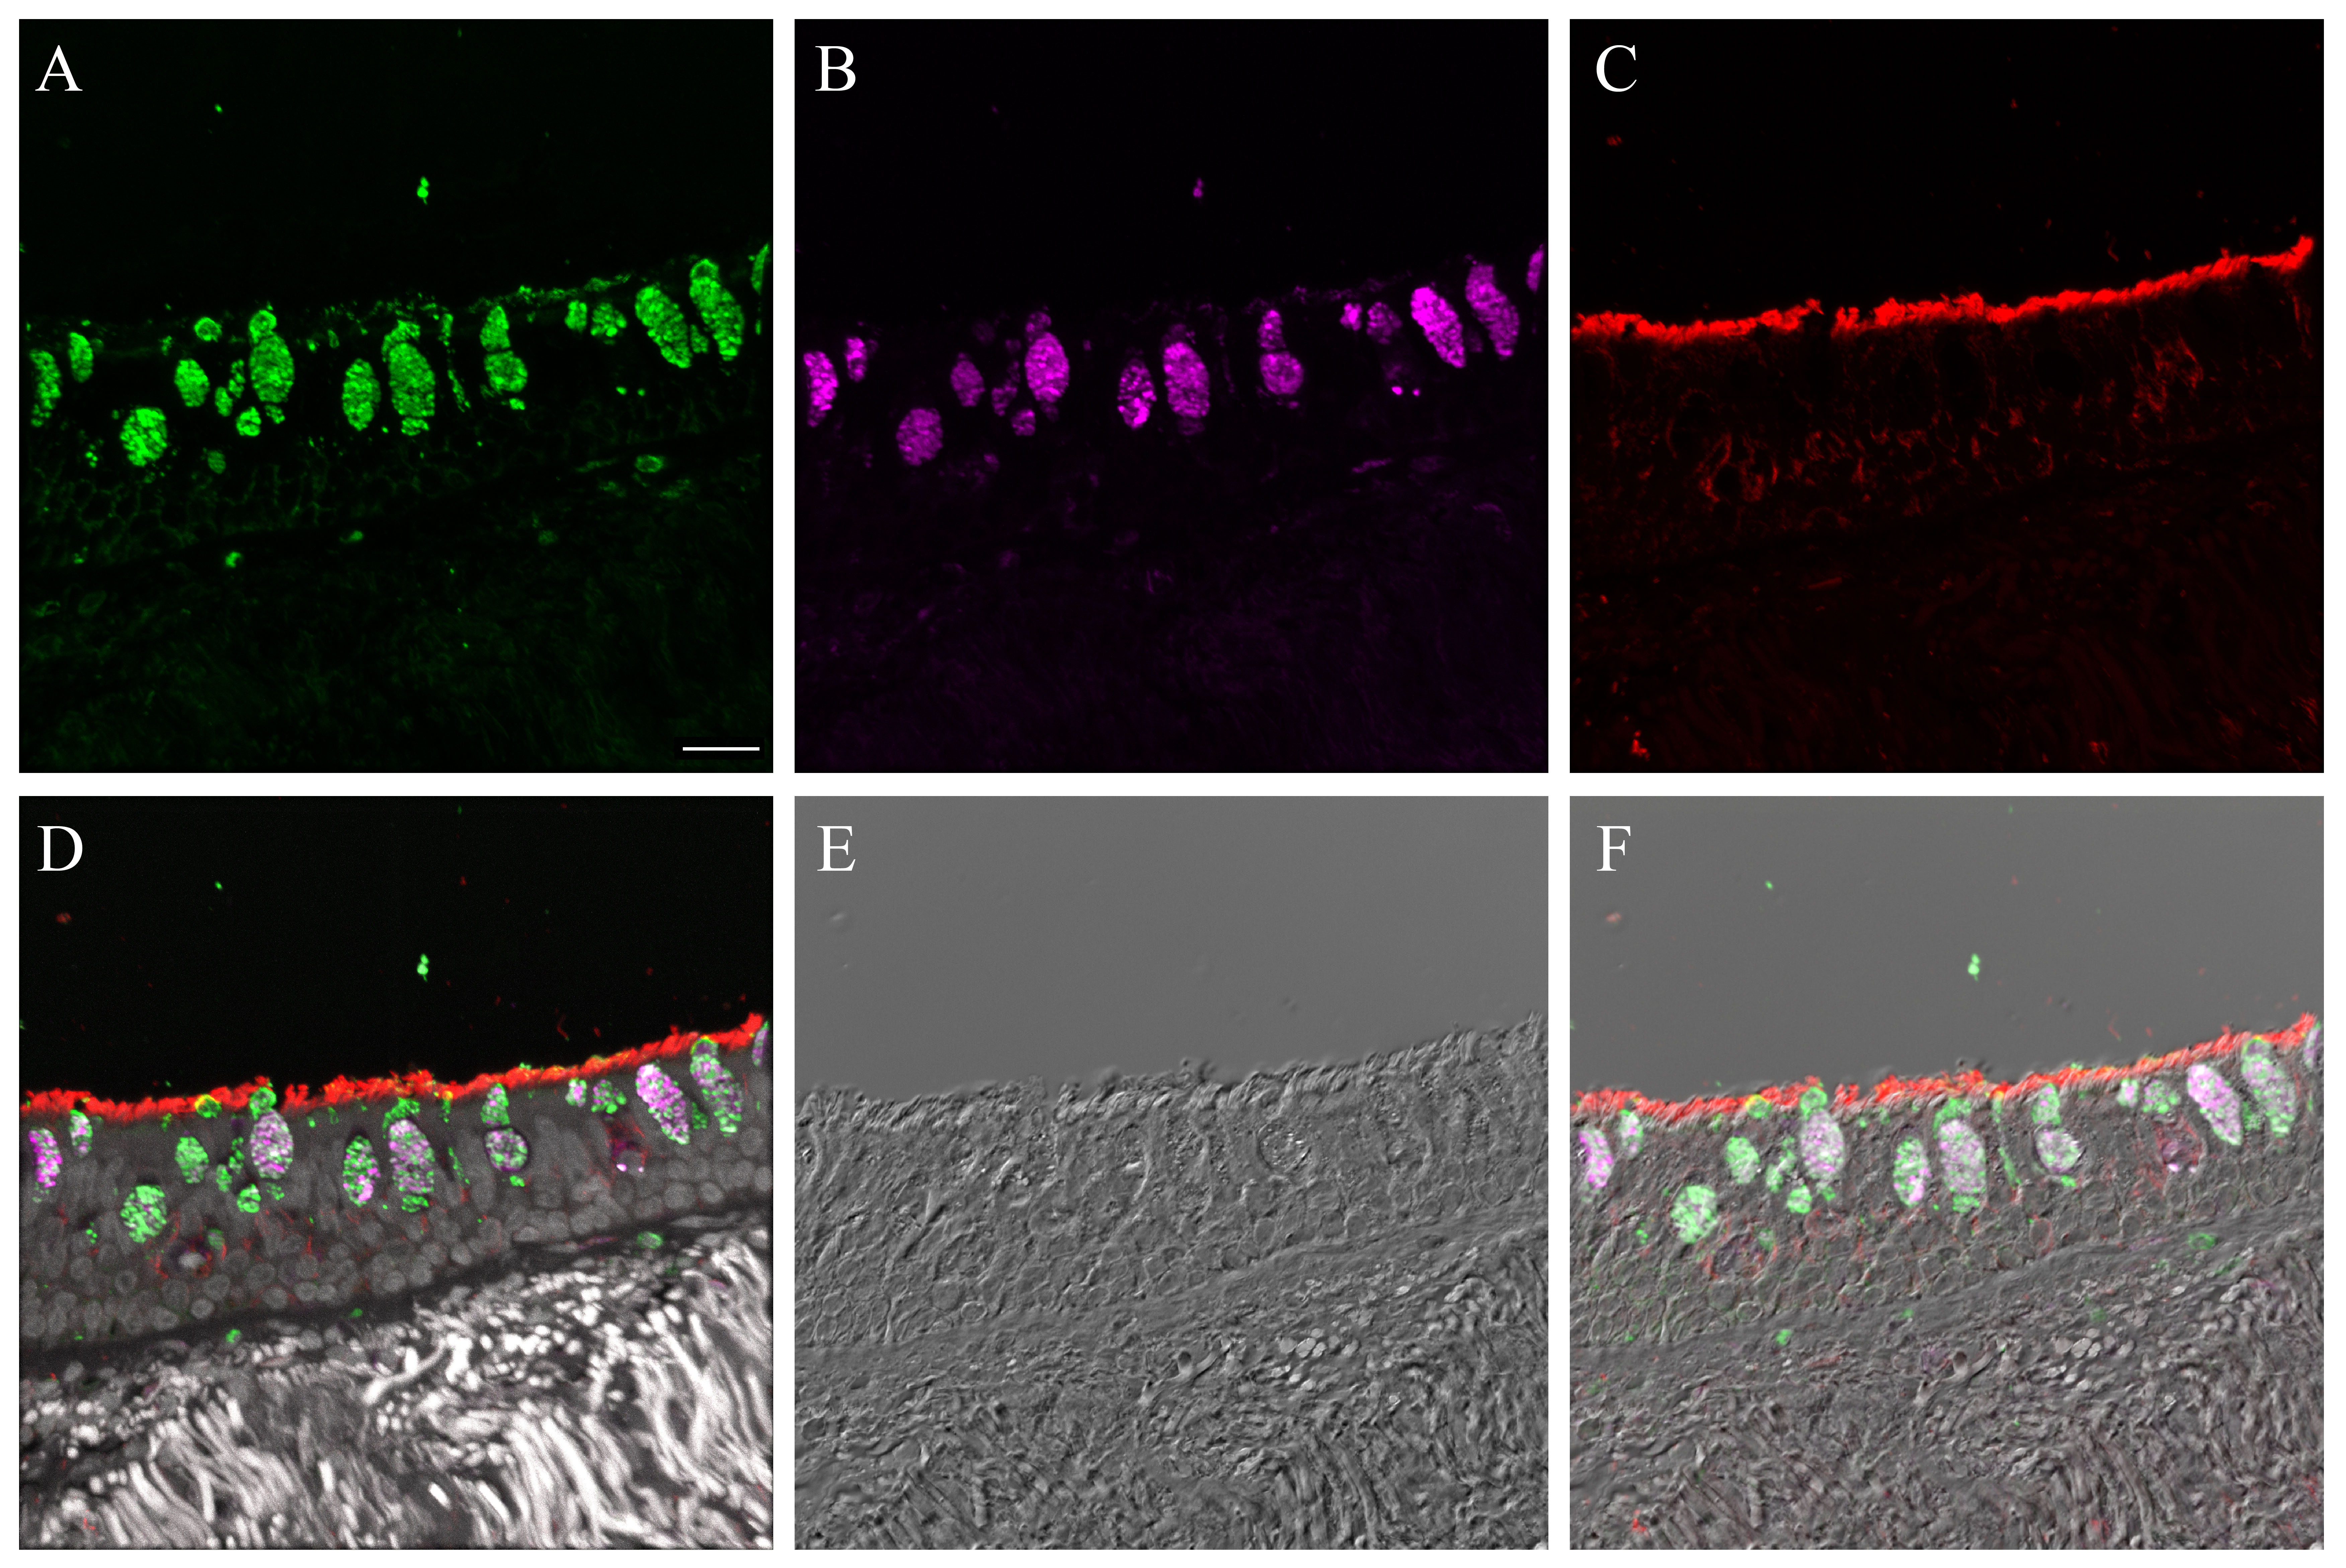
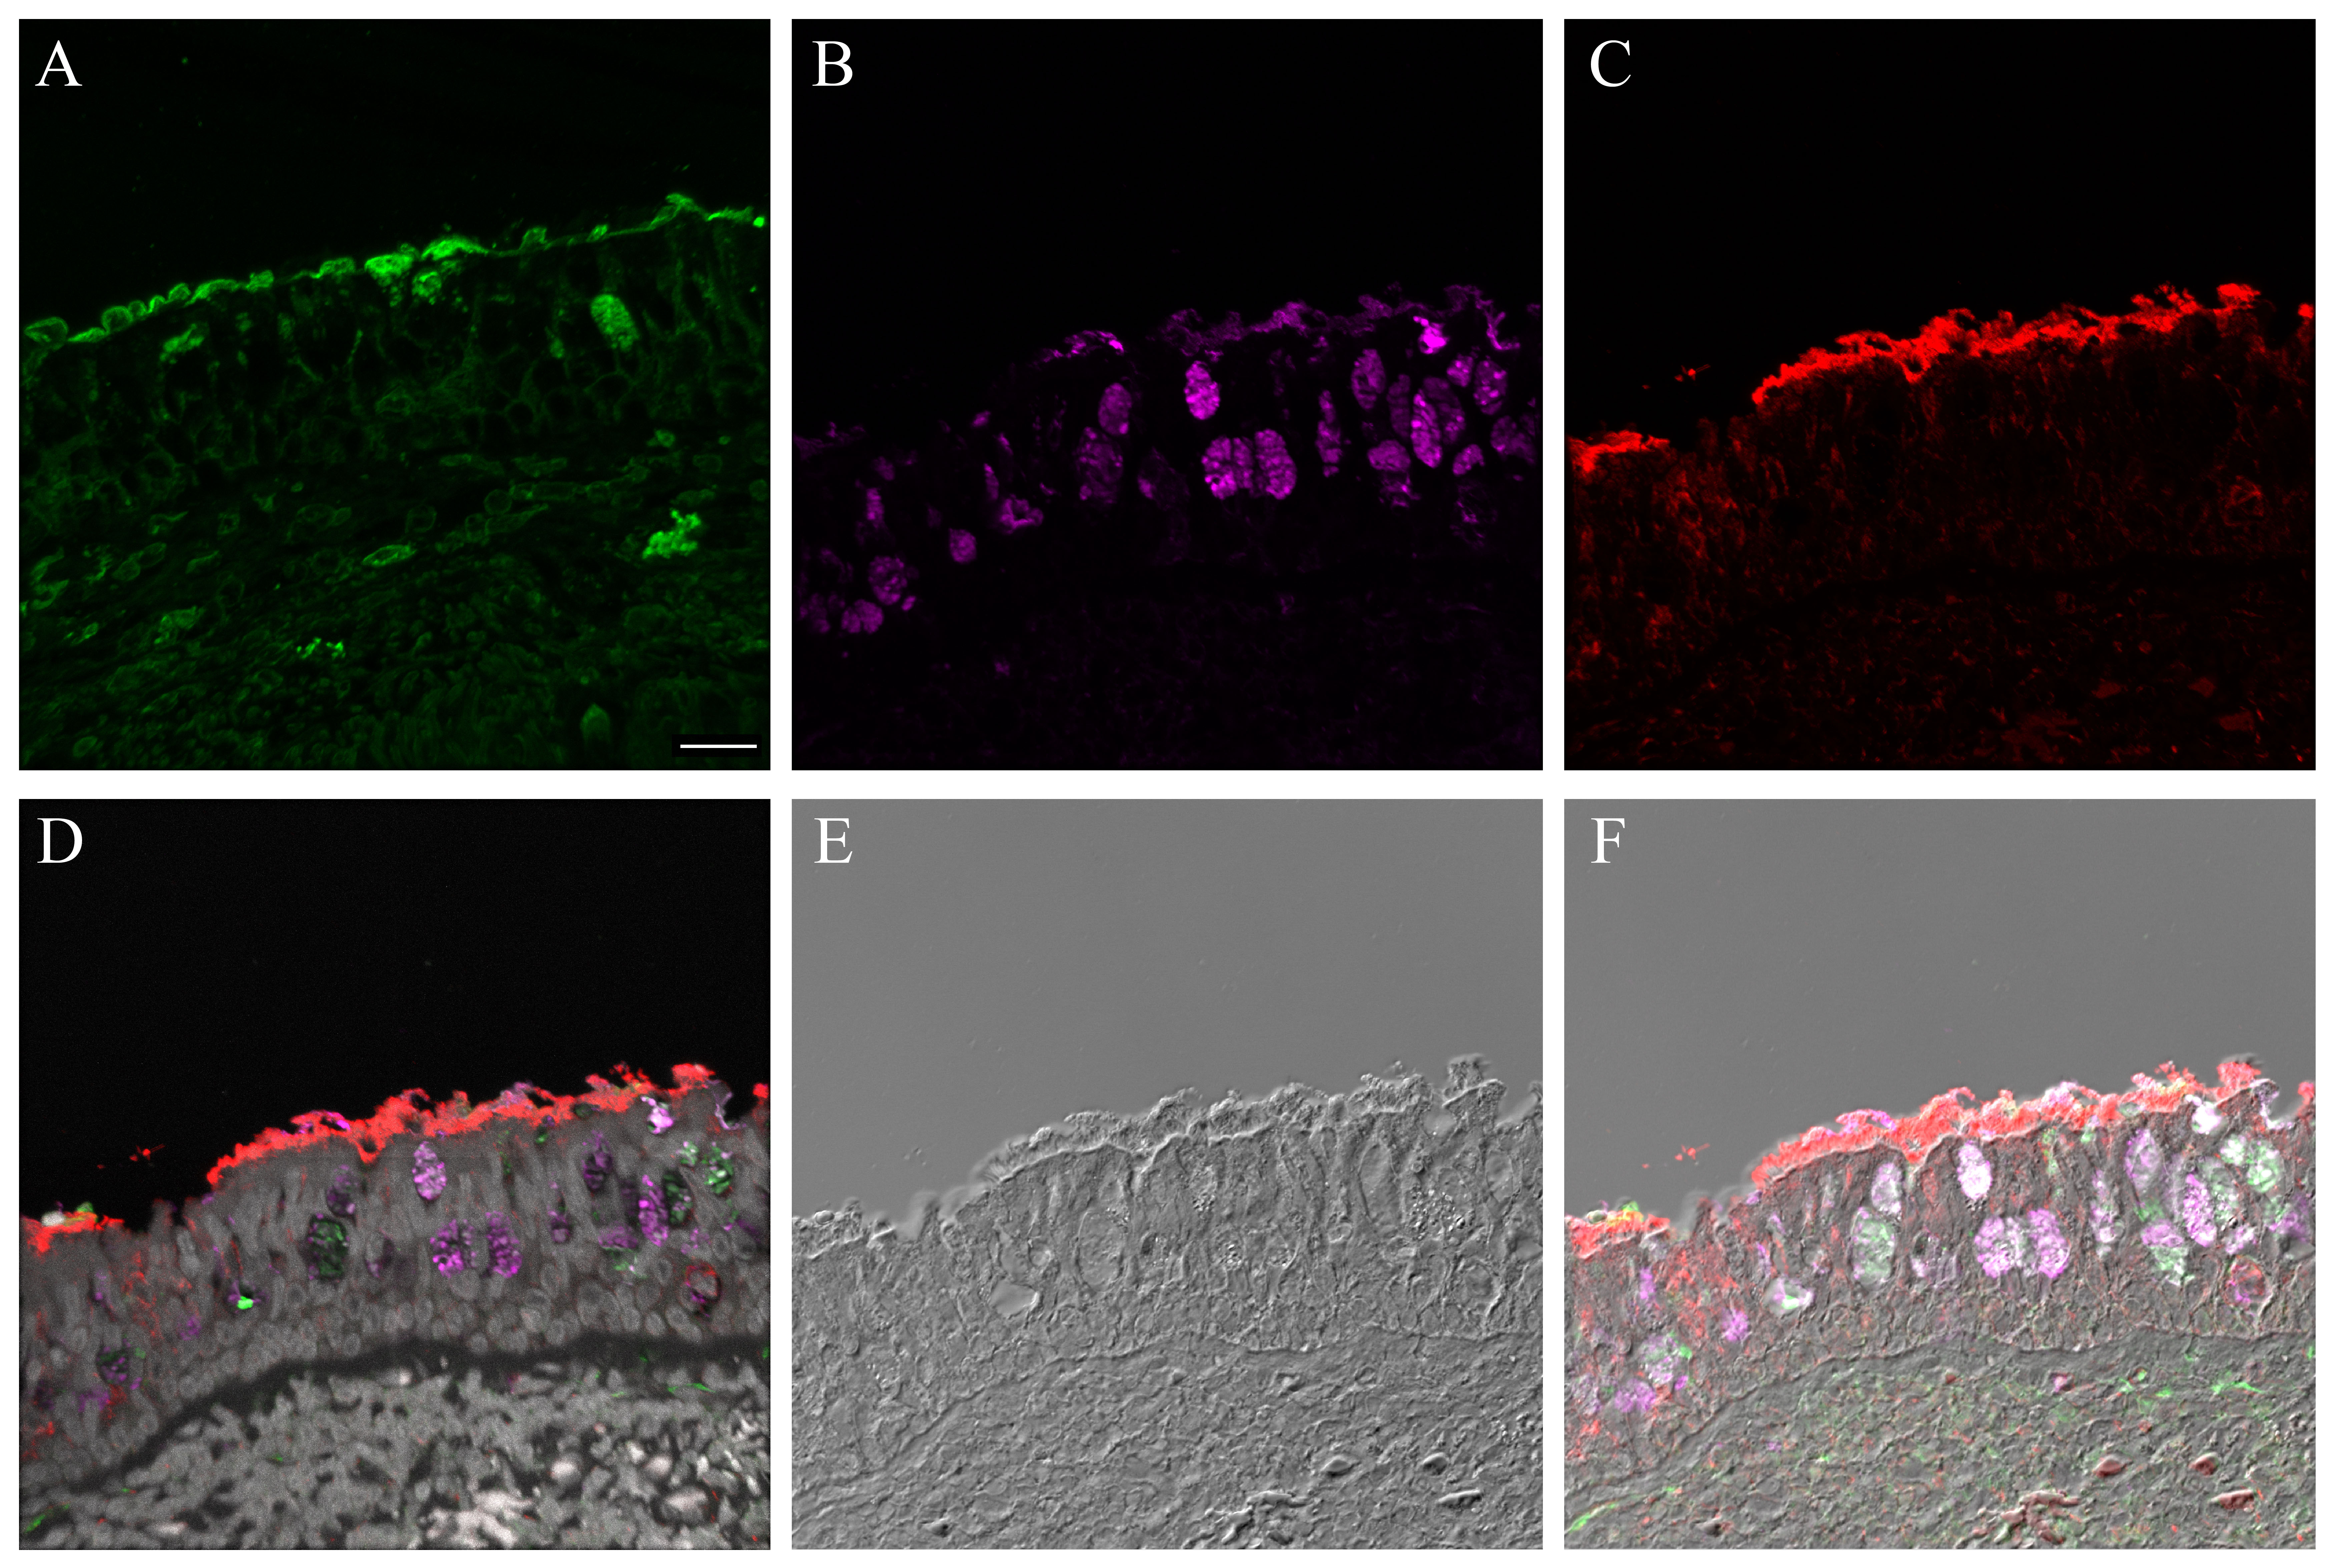
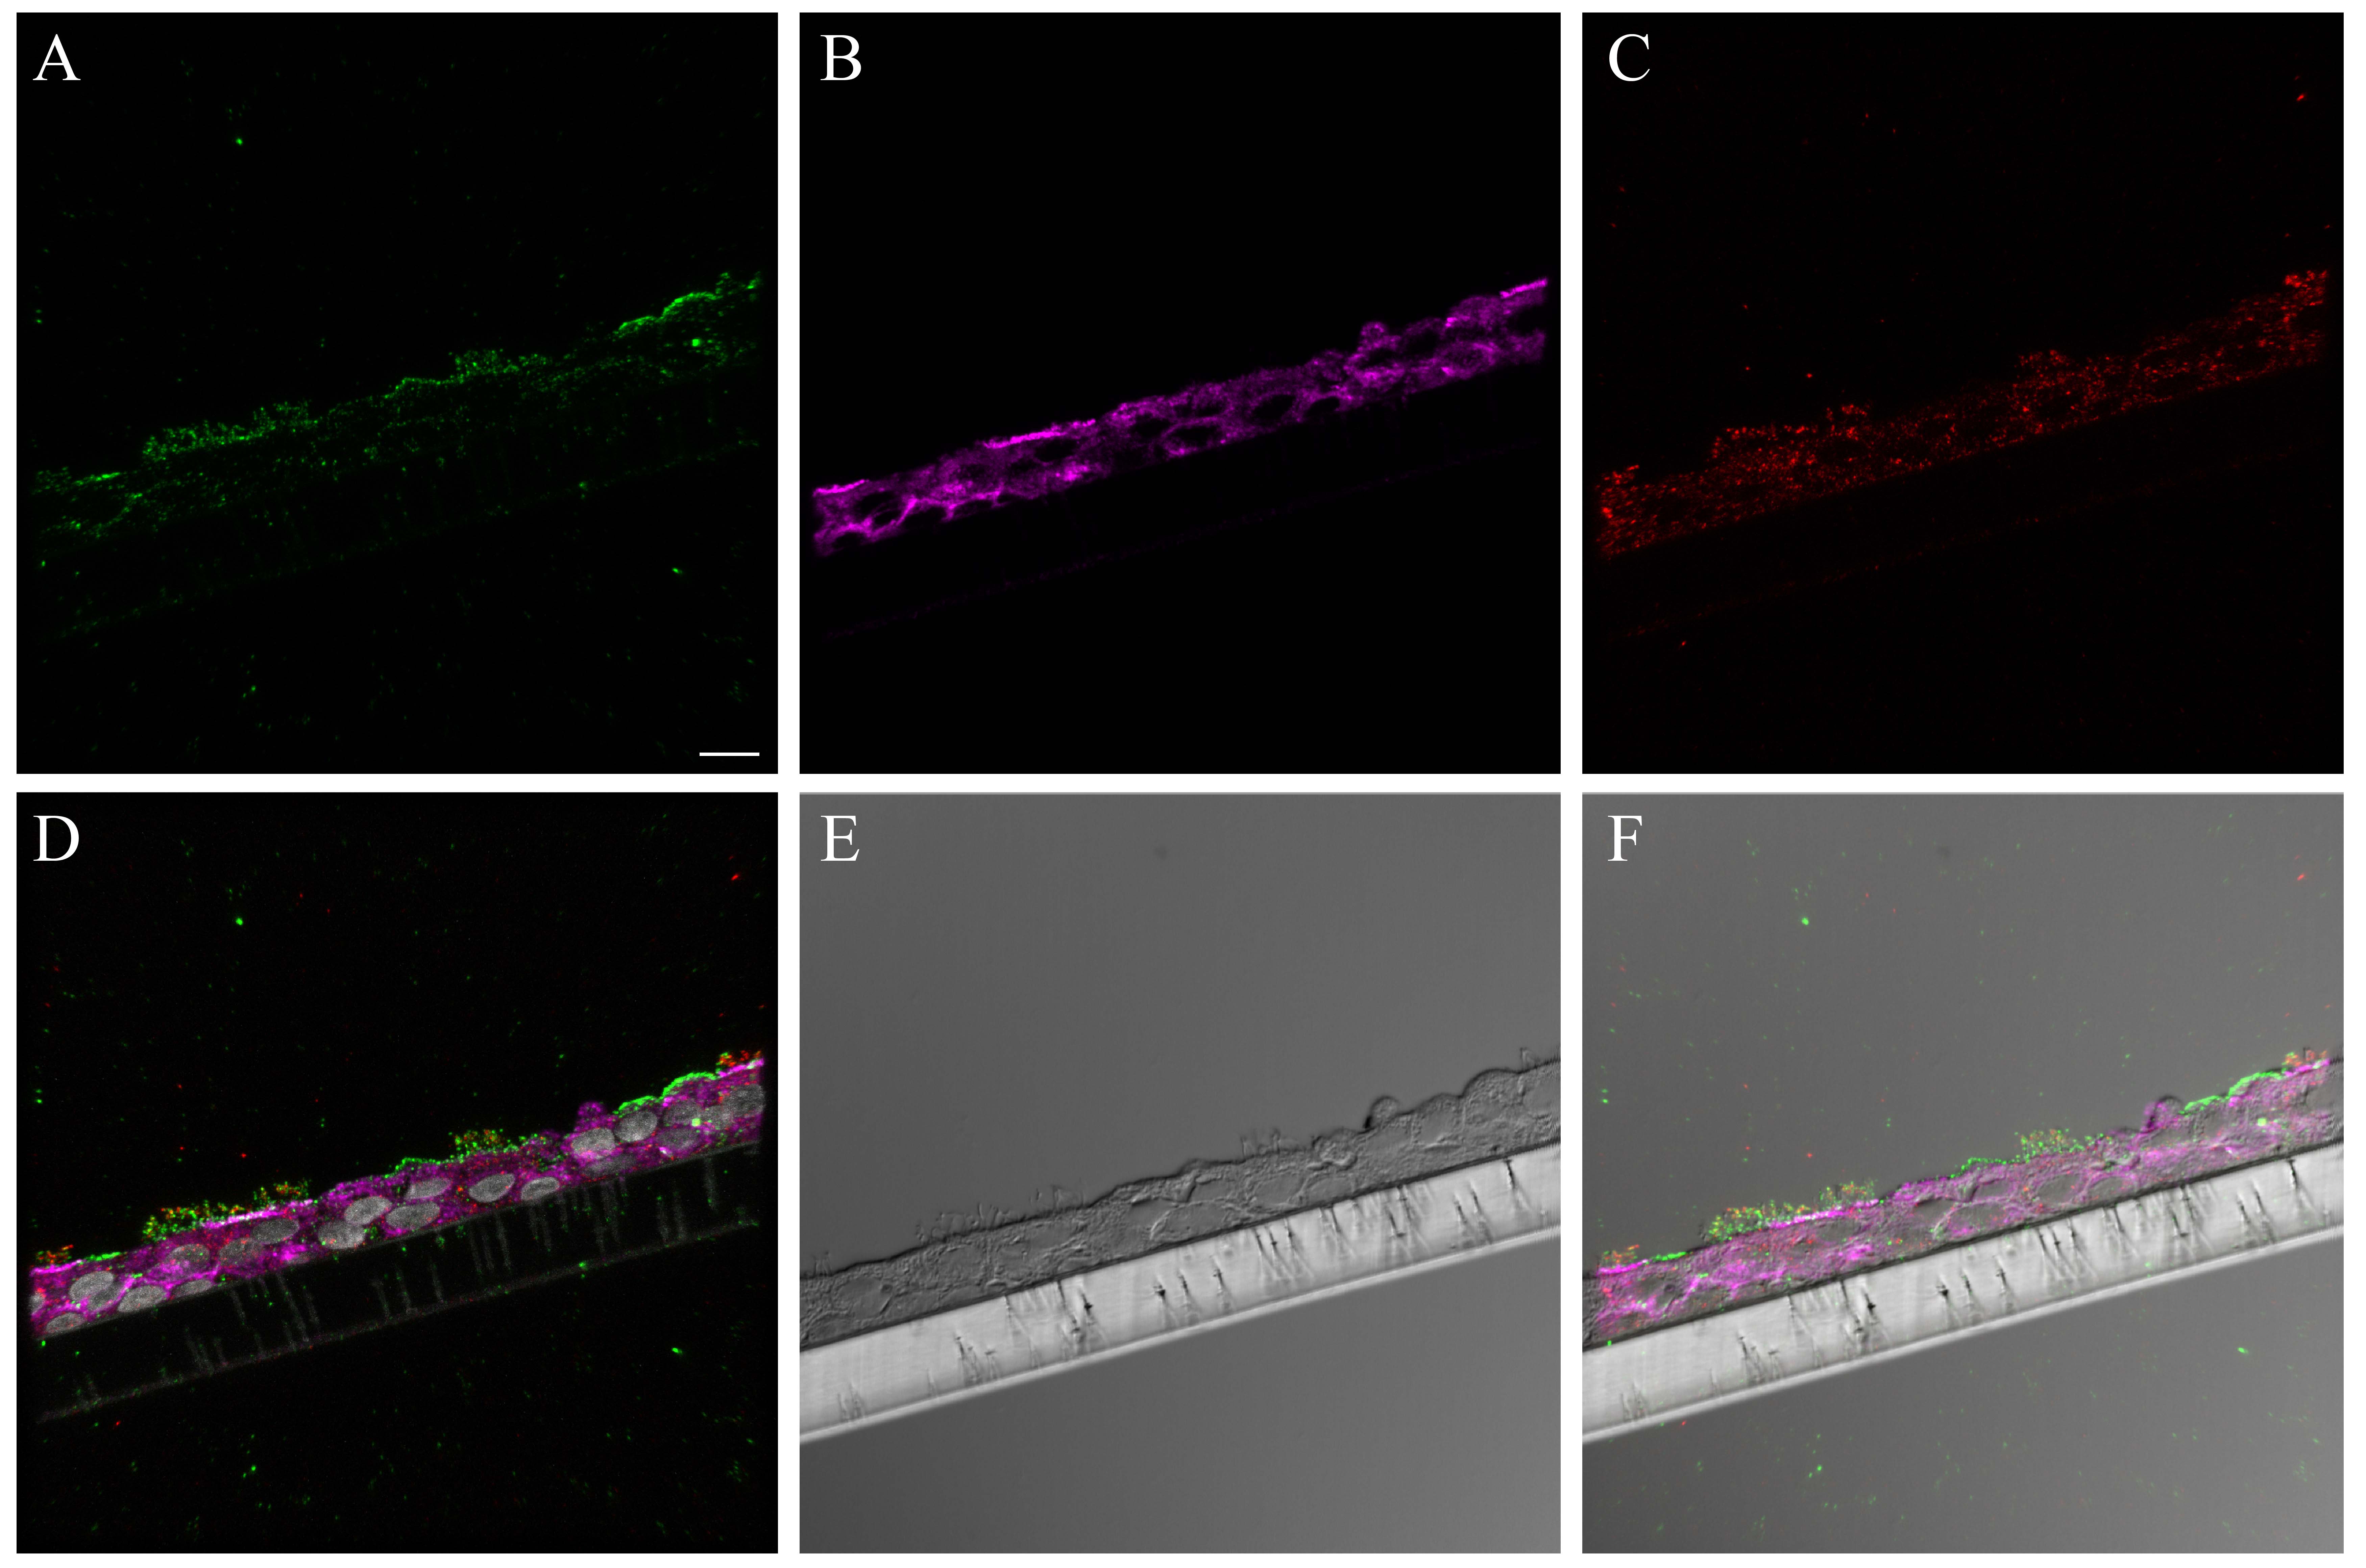
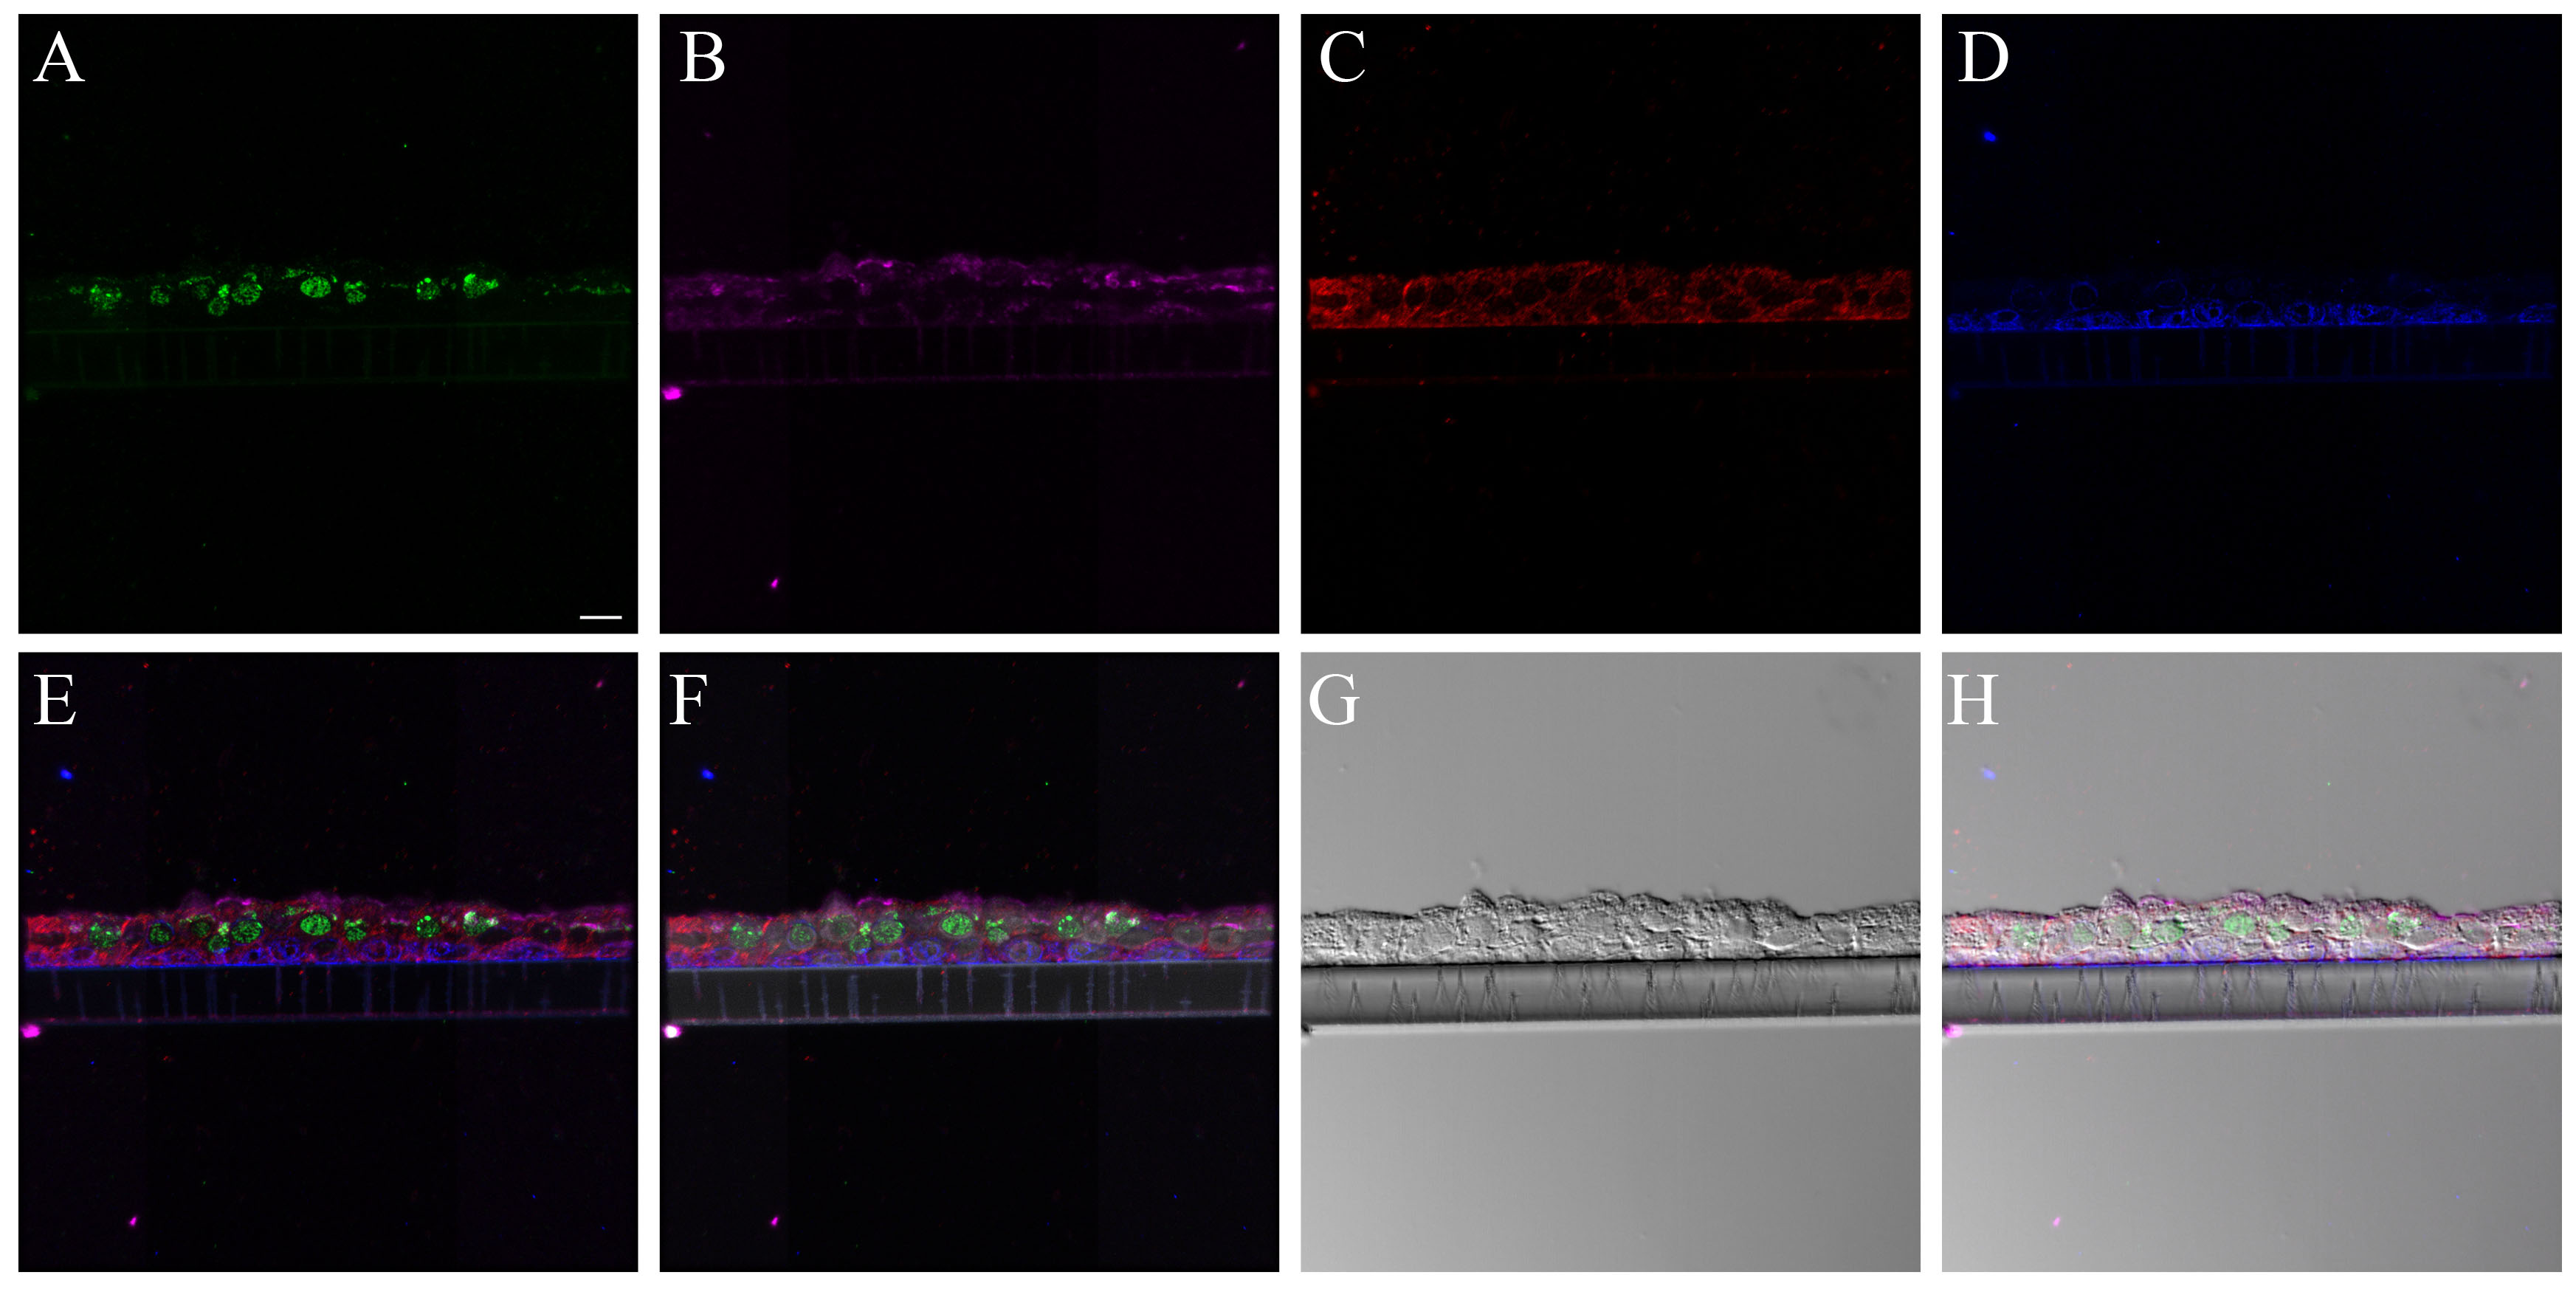
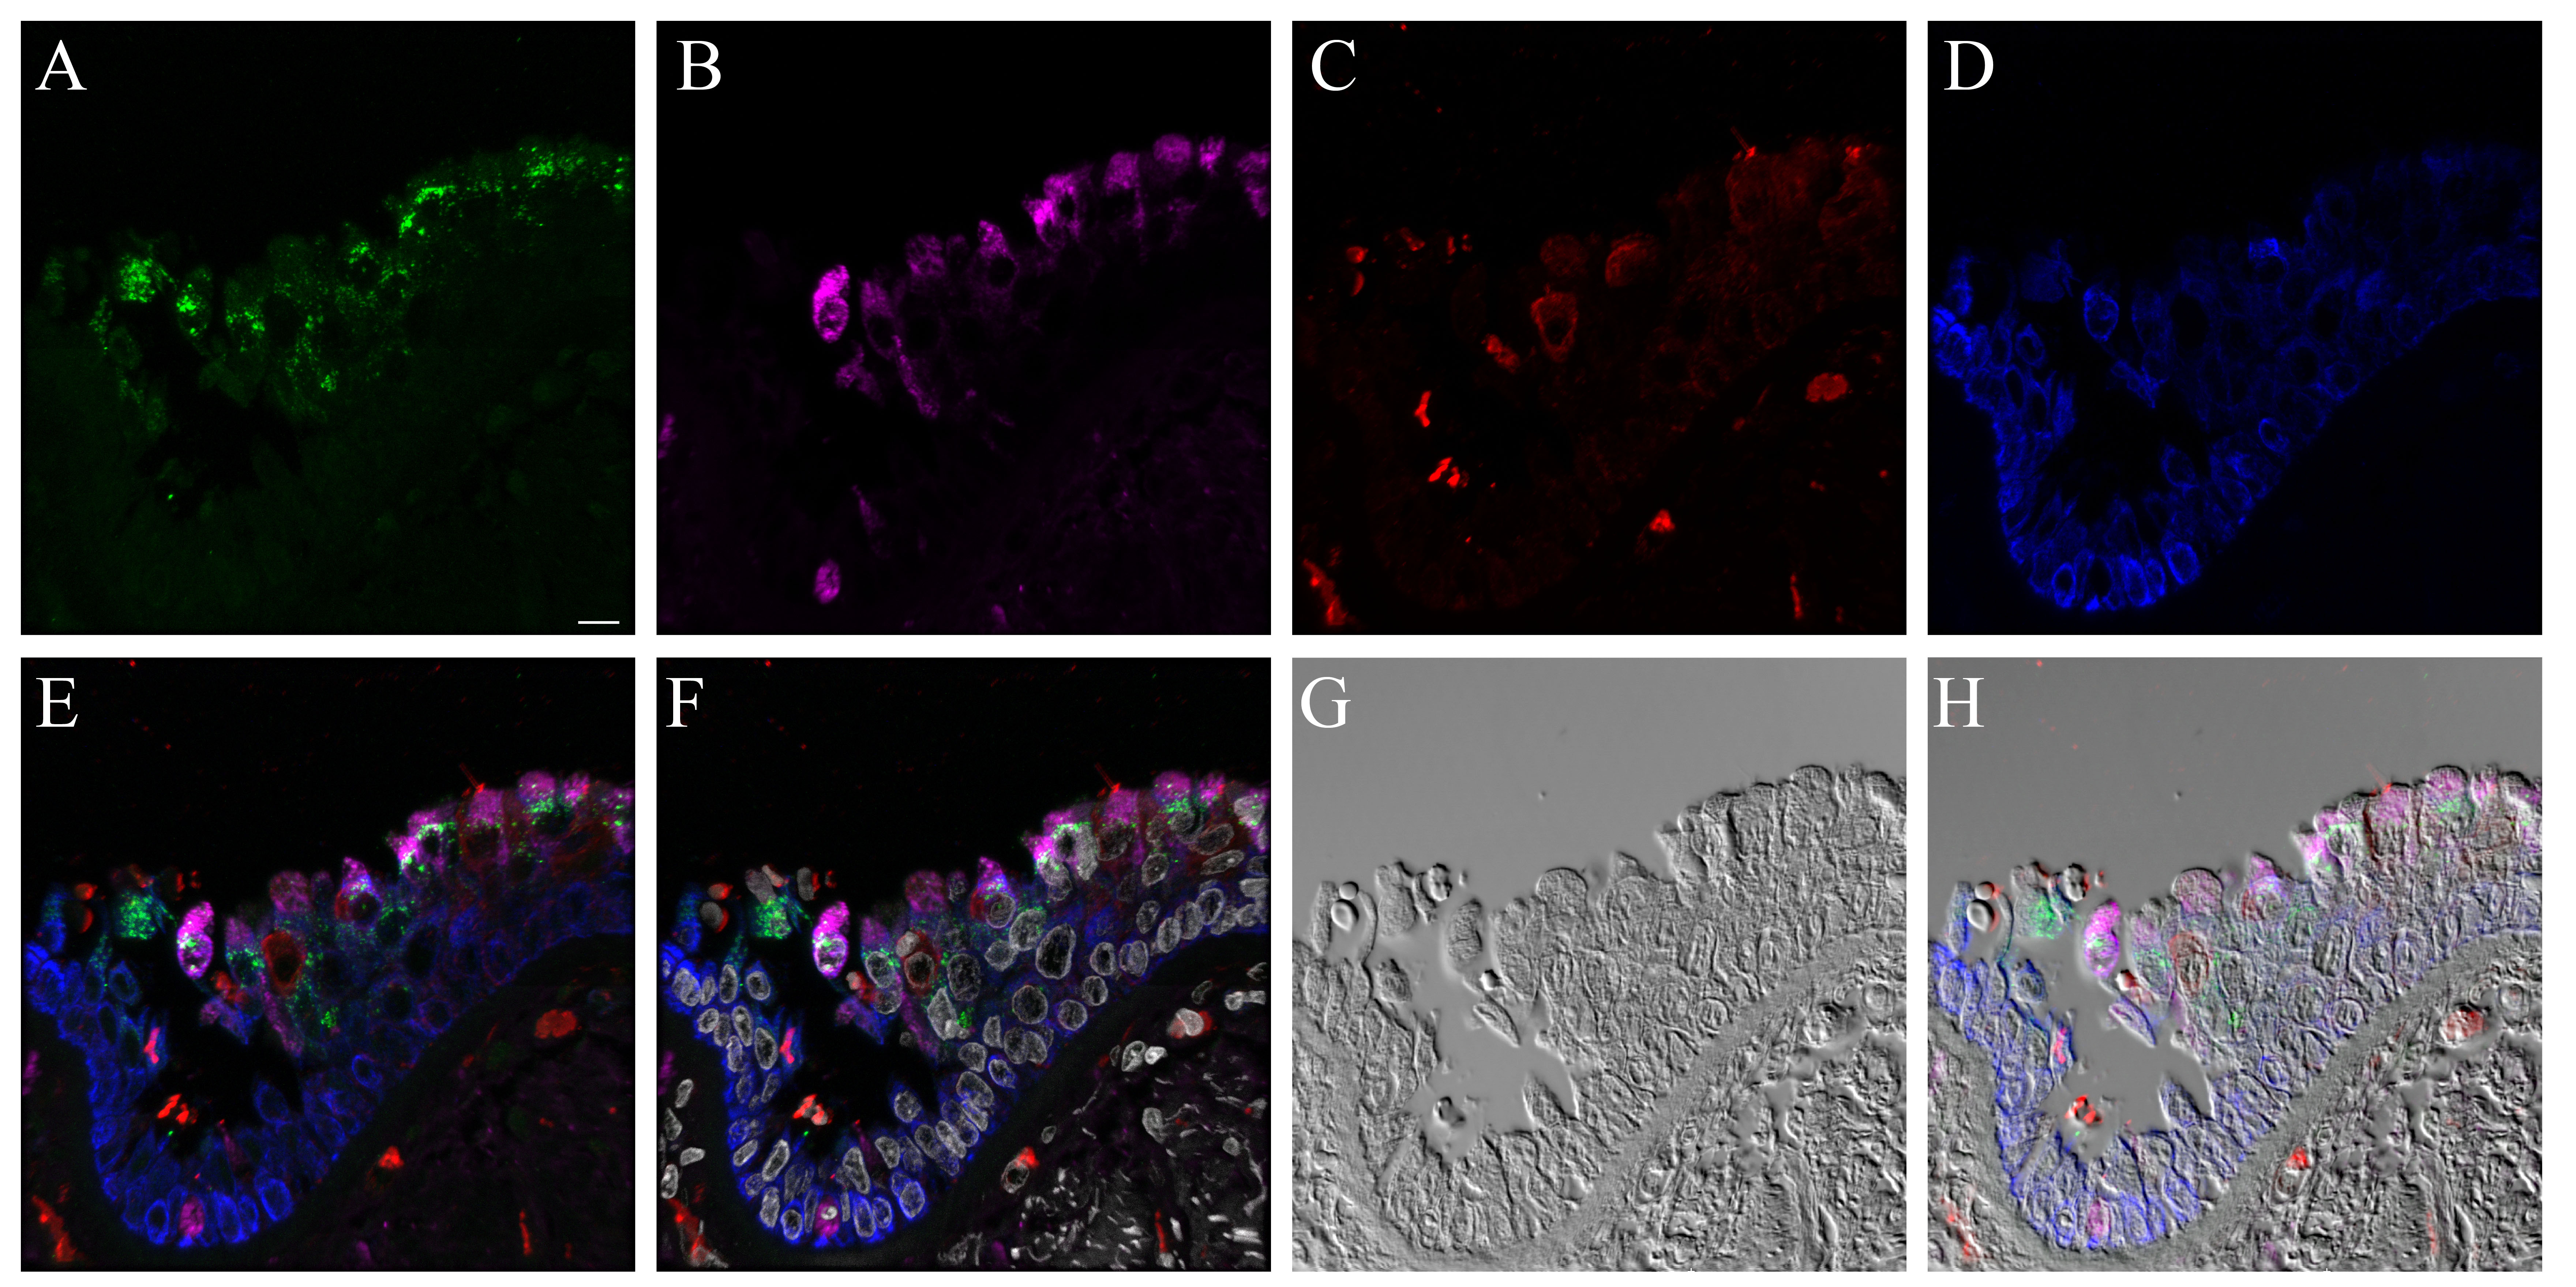
The cell types present in the differentiated NHBE pseudostratified epithelial layer were a subset of those identified in the pseudostratified epithelial cell layers of the distal trachea and carina tissue. Jacalin-680 consistently identified goblet cells. Jacalin co-localized with Muc5Ac on distal trachea demonstrating that Jacalin is also specific for mucin-producing goblet cells (Fig. S1). At the apical epithelial aspect, multi-label immunofluorescence for cell type markers revealed β-tubulin-positive ciliated cells and Jacalin-positive non-ciliated cells. Non-apical, round, cytokeratin-5-positive cells, interpreted as basal respiratory epithelial cells, were present at the basal epithelial aspect (Figs. 1, S2–S5). Distal trachea and carina epithelia additionally contained pyramidal-shaped, Chromagranin A-positive cells, interpreted as neuroendocrine cells, and CD68-positive cells that were morphologically consistent with macrophages and dendritic cells. All signals were cytoplasmic, consistent with the expectations for these markers. These findings were also consistent with those predicted by the microarray expression analysis.
Figure 1.

Normal human bronchial epithelial (NHBE) cell types compared to human distal trachea and carina. Leica SP8 laser confocal maximum projection images of full thickness z-stacks of immunofluorescence-labeled formalin-fixed, paraffin-embedded cells and tissues. All imaging was done with a 40× oil objective at zoom 2.7, 2048×2048 pixels. (Row 1, A–C) Differentiated NHBE cells; (Row 2, D–F) Human distal tracheal tissue, and (Row 3, G–I) Human carina. (Column 1) Cell type markers, include β-tubulin labeled ciliated cells (red); Jacalin labeled goblet cells (magenta); cytokeratin-5 labeled basal cells (green), nuclei (gray), neuroendocrine cells (blue), and CD68-positive cells (macrophages/dendritic cells) (cyan); the last two markers were only done on the human tissues. (Column 2) Differential interference contrast (DIC), a representative single 0.20-µm thick slice showing cell outlines. (Column 3) Merged images, showing cell type markers in relation to DIC cell outlines (nuclei label is removed). Scale, 10 µm.
Neuroendocrine, professional immune and club (Clara) cells were absent from differentiated NHBEs. The expression of the following genes was absent in the differentiated NHBE cells: chromogranin A (CHGA), synaptophysin (SYP), neural cell adhesion molecule-1 (NCAM1), CD68, CD207, CD163. Expression of γ-enolase (or neuron-specific enolase; ENO2) and hyaluronan-mediated motility receptor (HMMR) was present (Table 1). Since club cell-specific genes SCGB1A1 and CYP2B6 were increased in differentiated in comparison to undifferentiated NHBEs (Martinez-Anton et al. 2013), we sought to identify club cells by immunofluorescence. The anti-CC10 immunofluorescence yielded a consistent cytoplasmic signal from cells in the positive control human lung tissue at the expected locations in cells that were morphologically consistent with club cells. These cells were most abundant at the level of the respiratory and terminal bronchioles, with lower numbers found in the larger bronchi. However, differentiated NHBE cells and human distal trachea were consistently negative despite amplification attempts (data not shown). Finally, we saw no cells that were morphologically consistent with these cell types in undifferentiated or differentiated NHBE cell cultures using both light microscopy and DIC microscopy.
Table 1.
Microarray Presence/Absence Calls.
| Gene Symbol | Cell Type | Sample 1 | Sample 2 | Sample 3 |
|---|---|---|---|---|
| CHGA | Neuroendocrine | A | A | A |
| ENO2 | Neuroendocrine | P | P | P |
| SYP | Neuroendocrine | A | A | A |
| NCAM1 | Neuroendocrine | A | A | A |
| CD68 | Macrophage/Dendritic Cell | A | A | A |
| HMMR | Positive control | P | P | P |
| CD207 | Dendritic Cell | A | A | A |
| CD163 | Macrophage | A | A | A |
| CD163 | Macrophage | A | A | A |
P, Present; A, Absent; CHGA, chromogranin A, ENO2, enolase 2; SYP, synaptophysin; NCAM-1; neural cell adhesion molecule-1; HMMR, hyaluronan-mediated motility receptor.
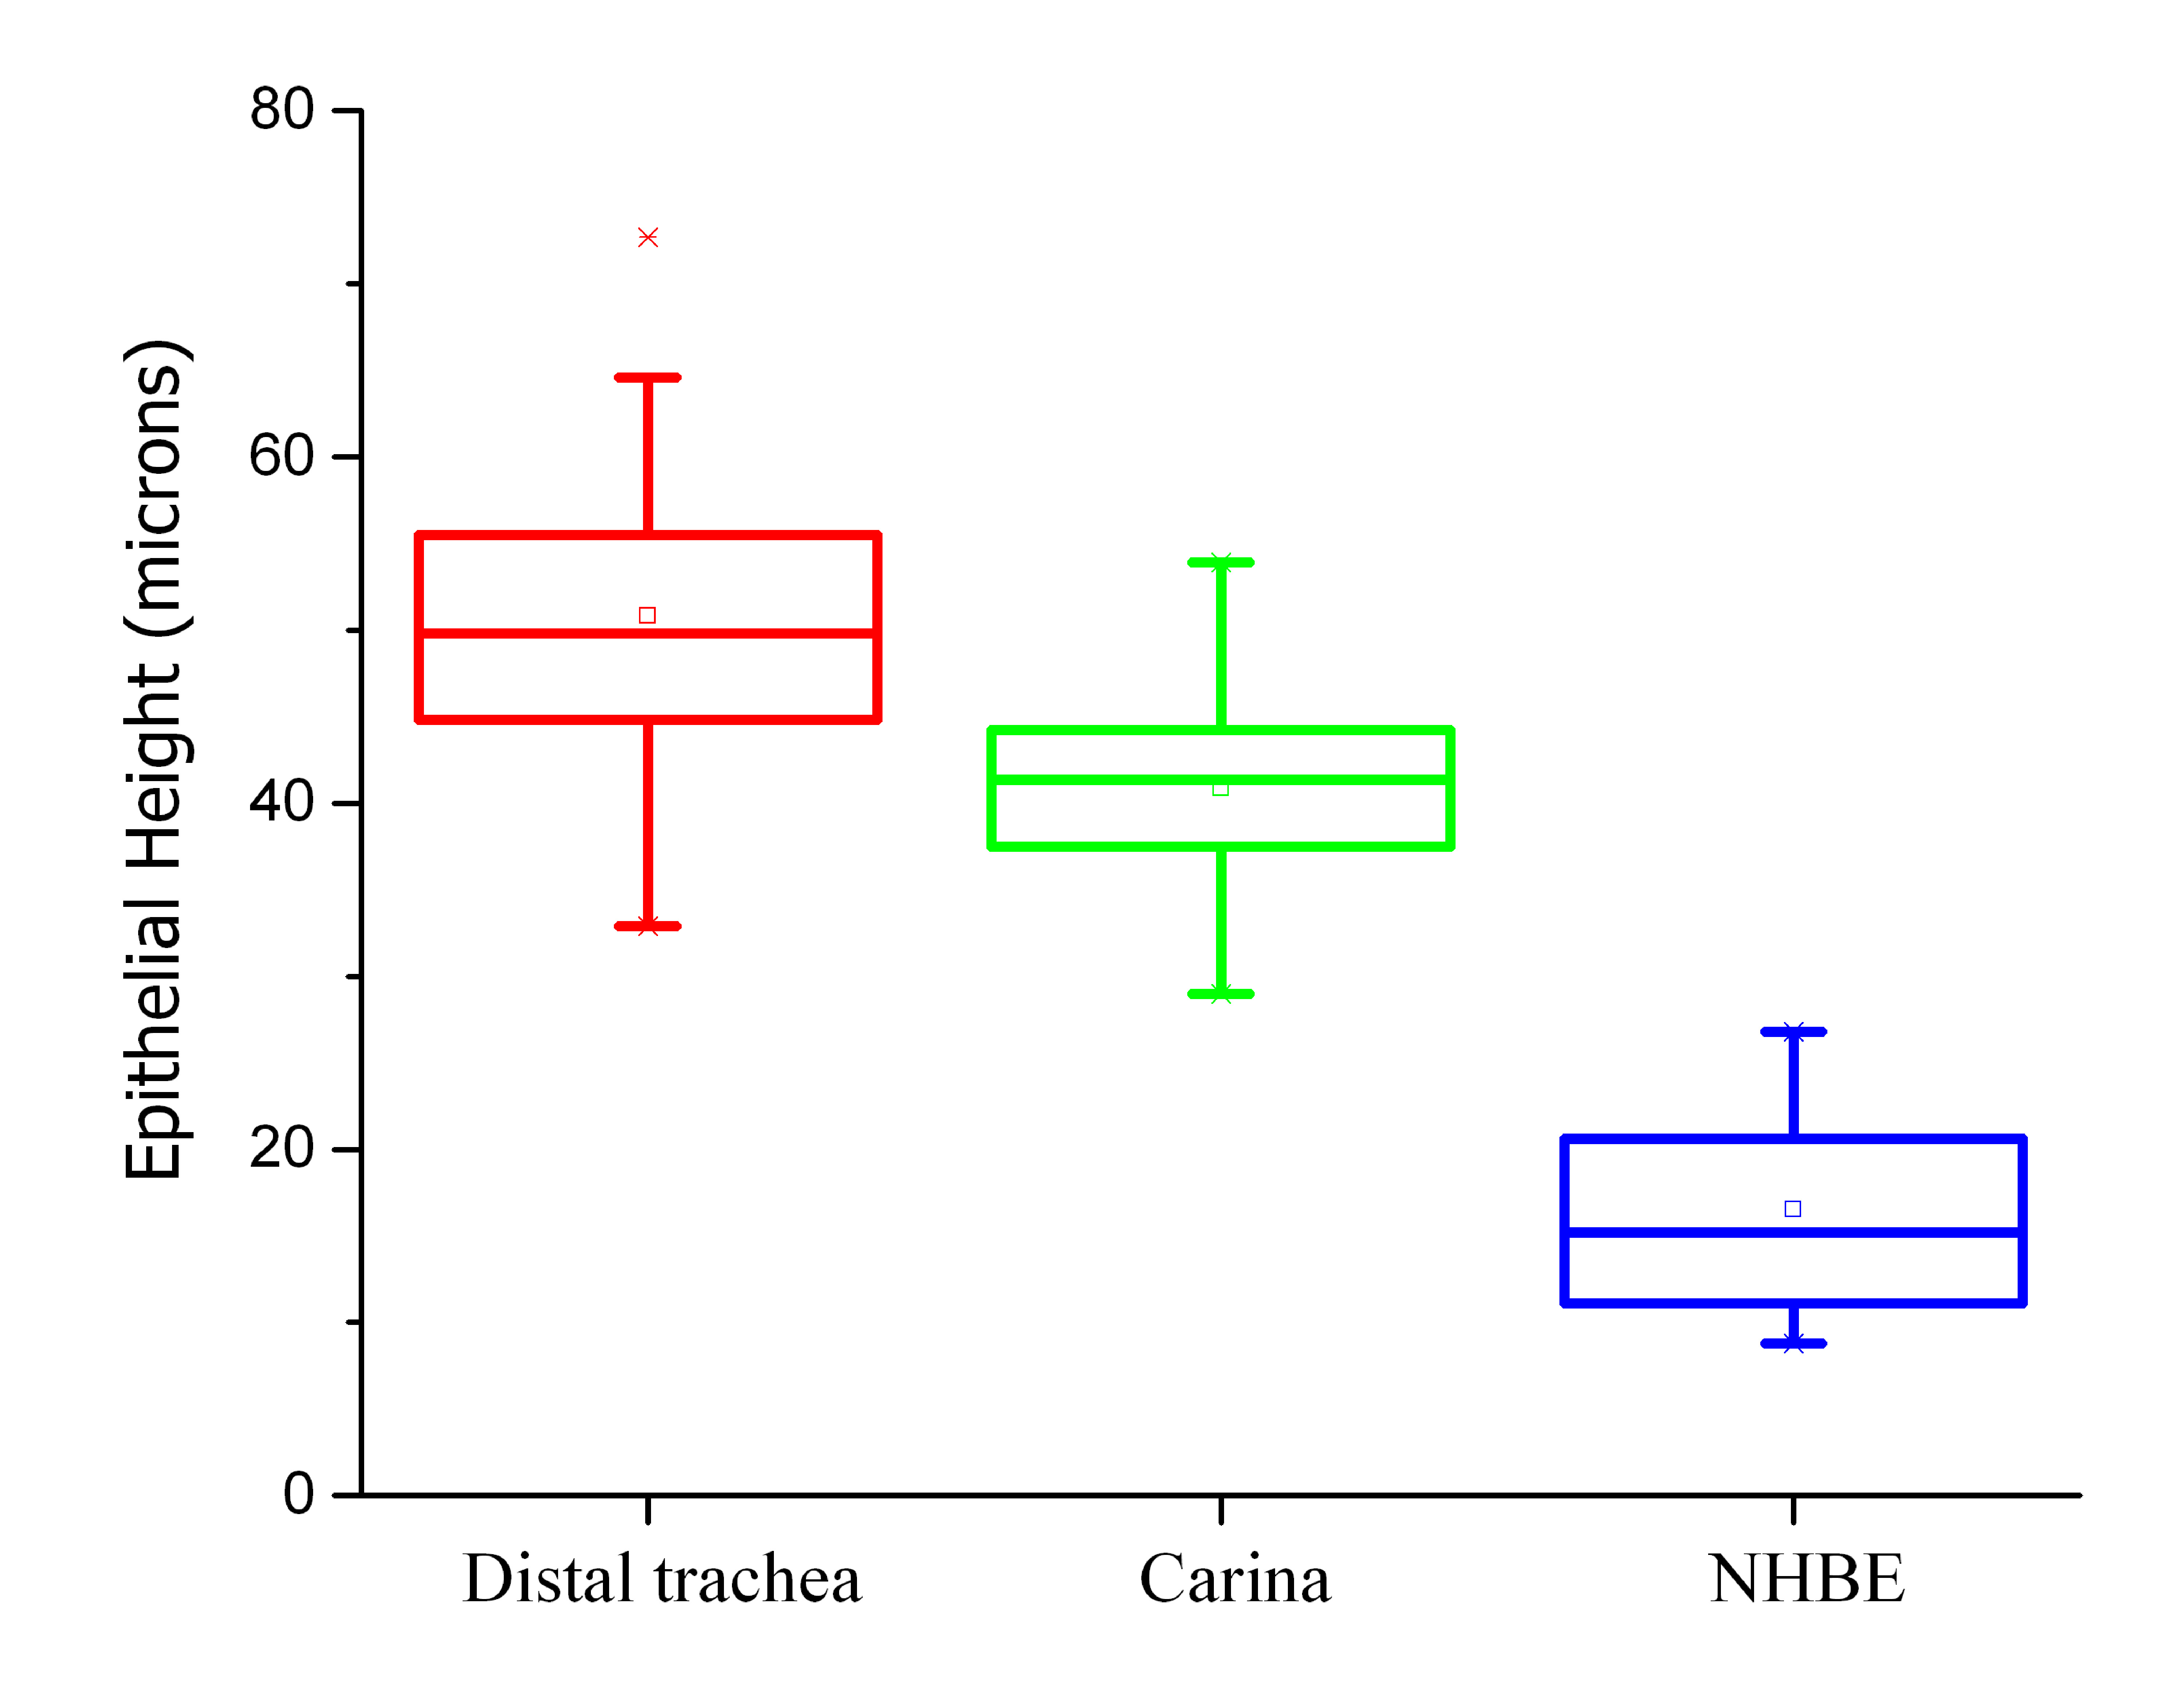
Fully differentiated NHBEs appeared to consistently form a true pseudostratified epithelium, morphologically similar to that of carina and distal trachea but different in height and cell type distribution. All cells traced in NHBE layers reached the membrane just as cells in the distal trachea and carina contacted the basement membrane. The NHBEs consistently presented with a thinner pseudostratified epithelium than carina or distal trachea tissue. The average epithelial heights for the differentiated NHBEs, distal trachea and carina were 16.5, 50.8, and 40.9 µm, respectively. The NHBE measurements were significantly different from those of the distal trachea and carina, as determined with one-way ANOVA (Fig. S6).
The cilia density appeared to be lower on both individual ciliated cell surfaces and on the epithelial surface as a whole. The β-tubulin labeling of NHBEs (Fig. 1) and review of unembedded membranes by light microscopy and SEM (Fig. 2; Row 1) corroborated this frequently sparse distribution of ciliated cells. Non-ciliated cells dominated the apical aspect of the epithelium. Even despite the poorer preservation state of the carina and distal trachea EM samples, this difference was also appreciable by TEM (Fig. 2E–2F).
Figure 2.

Electron microscopy of normal human bronchial epithelial (NHBE) cells and human carina. (Row 1, A–D) Scanning electron micrographs of progressively higher resolution demonstrating the distribution of ciliated (c) and goblet (g) cells at the epithelial surface of fully differentiated NHBEs. Transmission electron micrographs of fully differentiated NHBEs alternating with human carina tissue (Row 2, E–H; Row 3, I–L). Magnification is marked with individual rulers at the bottom right of each image. (E) The differentiated NHBE cells, full thickness from membrane (m) to lumen (l); examples of ciliated (c), goblet (g), and basal (b) cells are annotated. The (*) denotes an atypical non-ciliated cell. (F) The full carina epithelial thickness with submucosa (s) and basement membrane denoted by arrows; examples of ciliated (c), goblet (g), and basal (b) cells are annotated. (G) A goblet cell between two ciliated cells with cilium basal body marked by a white (*) and arrows denoting desmosomes and tight junctions present between these cells. (H) A ciliated cell (left) next to a goblet cell (right) with arrows denoting tight junctions between them at their apical aspects; (*) marks cilium basal body. (I) Basal aspect of epithelium demonstrating laxity in the interdigitations between cells (white *). White and black arrows denote a membrane pore with a lamellipodial-like extension from the adjacent basal cell (b). (J) Within the basal aspect of epithelium, paracellular junctions between epithelial cells, denoted by arrows, are tighter in the carina and distal tracheal epithelium compared with that in the NHBEs. (K) The basal aspect of epithelium (arrows) is not firmly attached to the membrane (m). (L) Arrows show that the basement membrane of the epithelium (e) is tightly adherent to the submucosa (s) by hemidesmosomes. Scale (A–F) 2 µm; (G–J) 500 nm; (K–L) 100 nm.
TEM revealed that cells consistent with ciliated, goblet (mucous) and basal cells were present in both the NHBEs and source tissue, as expected (Fig. 2E–2F). Tight junctional collars composed of desmosomes were also seen at the subapical aspect (Fig. 2G–2H). However, NHBE cells consistently demonstrated increased laxity in their paracellular junctions, both between basal cells and between basal cells and the other epithelial cells, when compared to distal trachea and carina (Fig. 2I–2J). Additionally, the NHBE’s cellular attachment to the artificial membrane was limited to an occasional lamellopodium of a basal cell interacting with a membrane pore (Fig. 2K). In contrast, the distal trachea and carina samples showed the presence of both basement membrane substance and hemidesmosomes (Fig. 2L).
Comparison of Receptor Lectin Histochemistry and Fluorochrome Conjugated Influenza Binding
Clostridium perfringens neuraminidase (NA) application effectively removed sialic acid receptors (Sia), preventing Sambucus nigra (SNA) and Maackia amurensis II (MAA II) from binding to both the human respiratory tissue and the NHBE cells (Fig. S7). In contrast, the extent of labeling with MAA I increased overall on all targets after NA treatment. Interestingly, NHBEs required twice the concentration of NA as compared to the human tissue samples to successfully block the SNA and MAA II lectin binding.
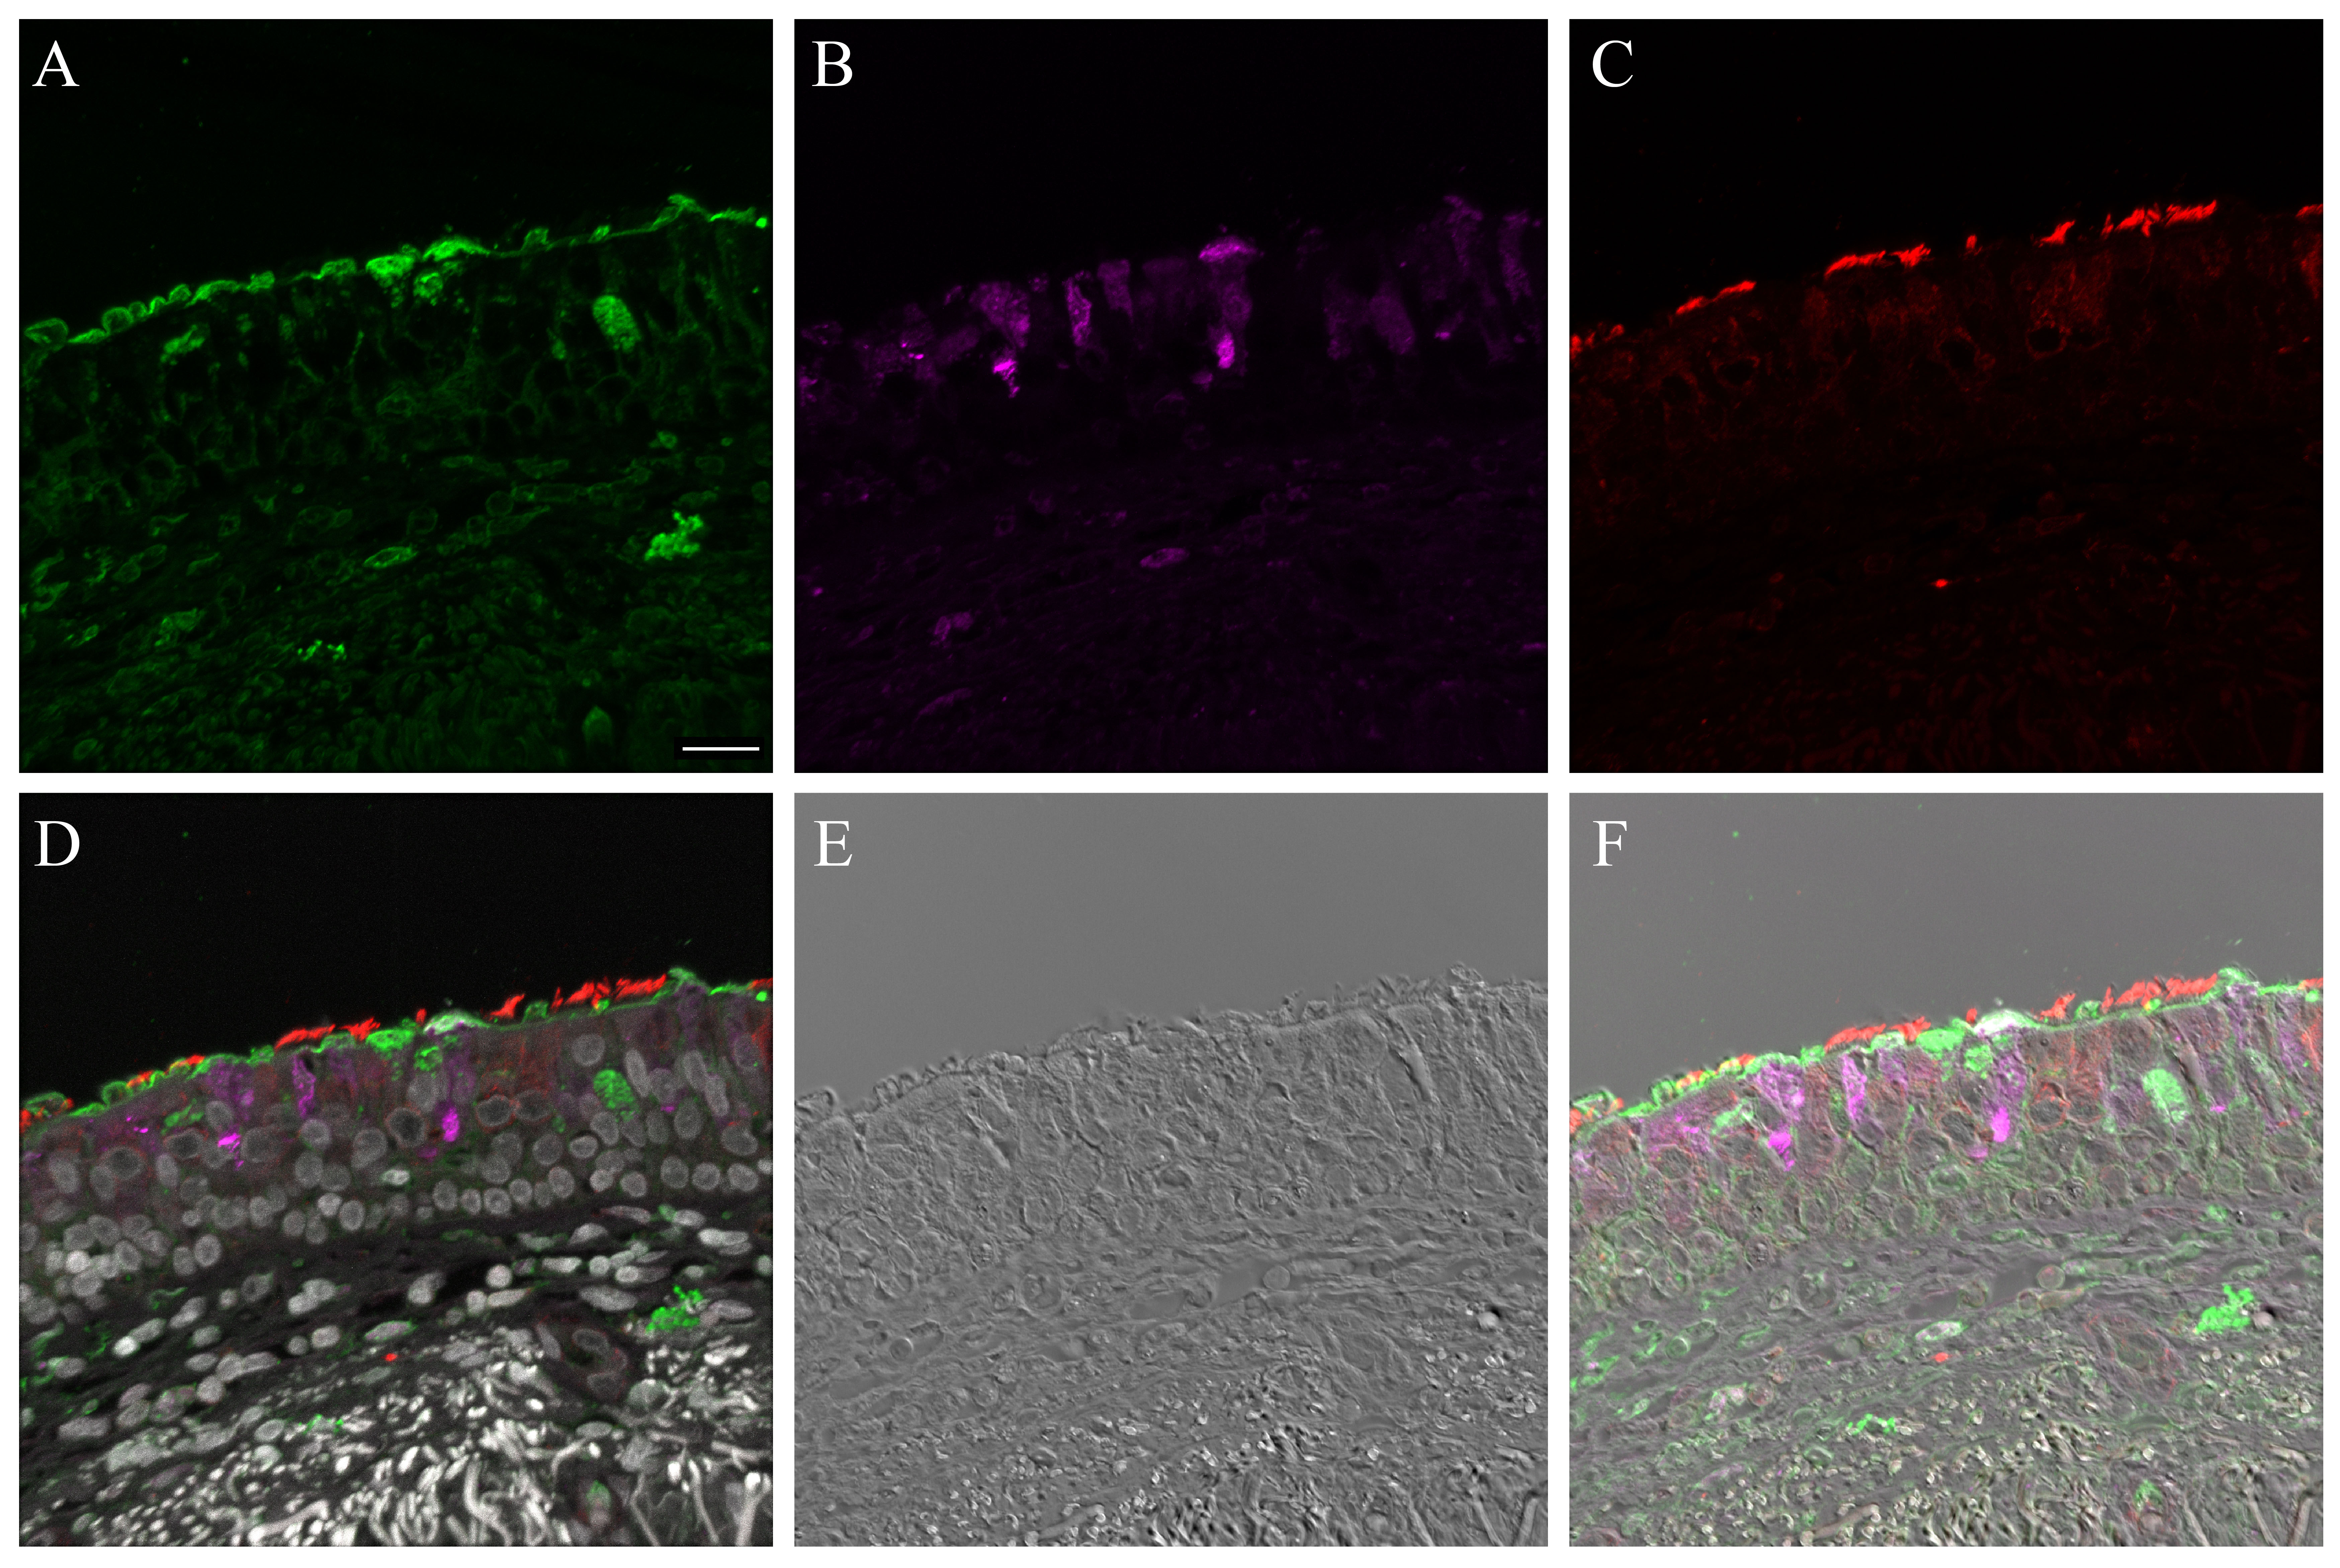
SNA consistently labeled the entire apical epithelial aspect of the NHBE cells (Fig. 3A). Combining its signal with that of cell type markers for the ciliated and goblet cells revealed that it labeled both cell types (Figs. 3B, S8). A similar pattern was seen with SNA in the distal trachea (Figs. 3C–D, S9–S11).
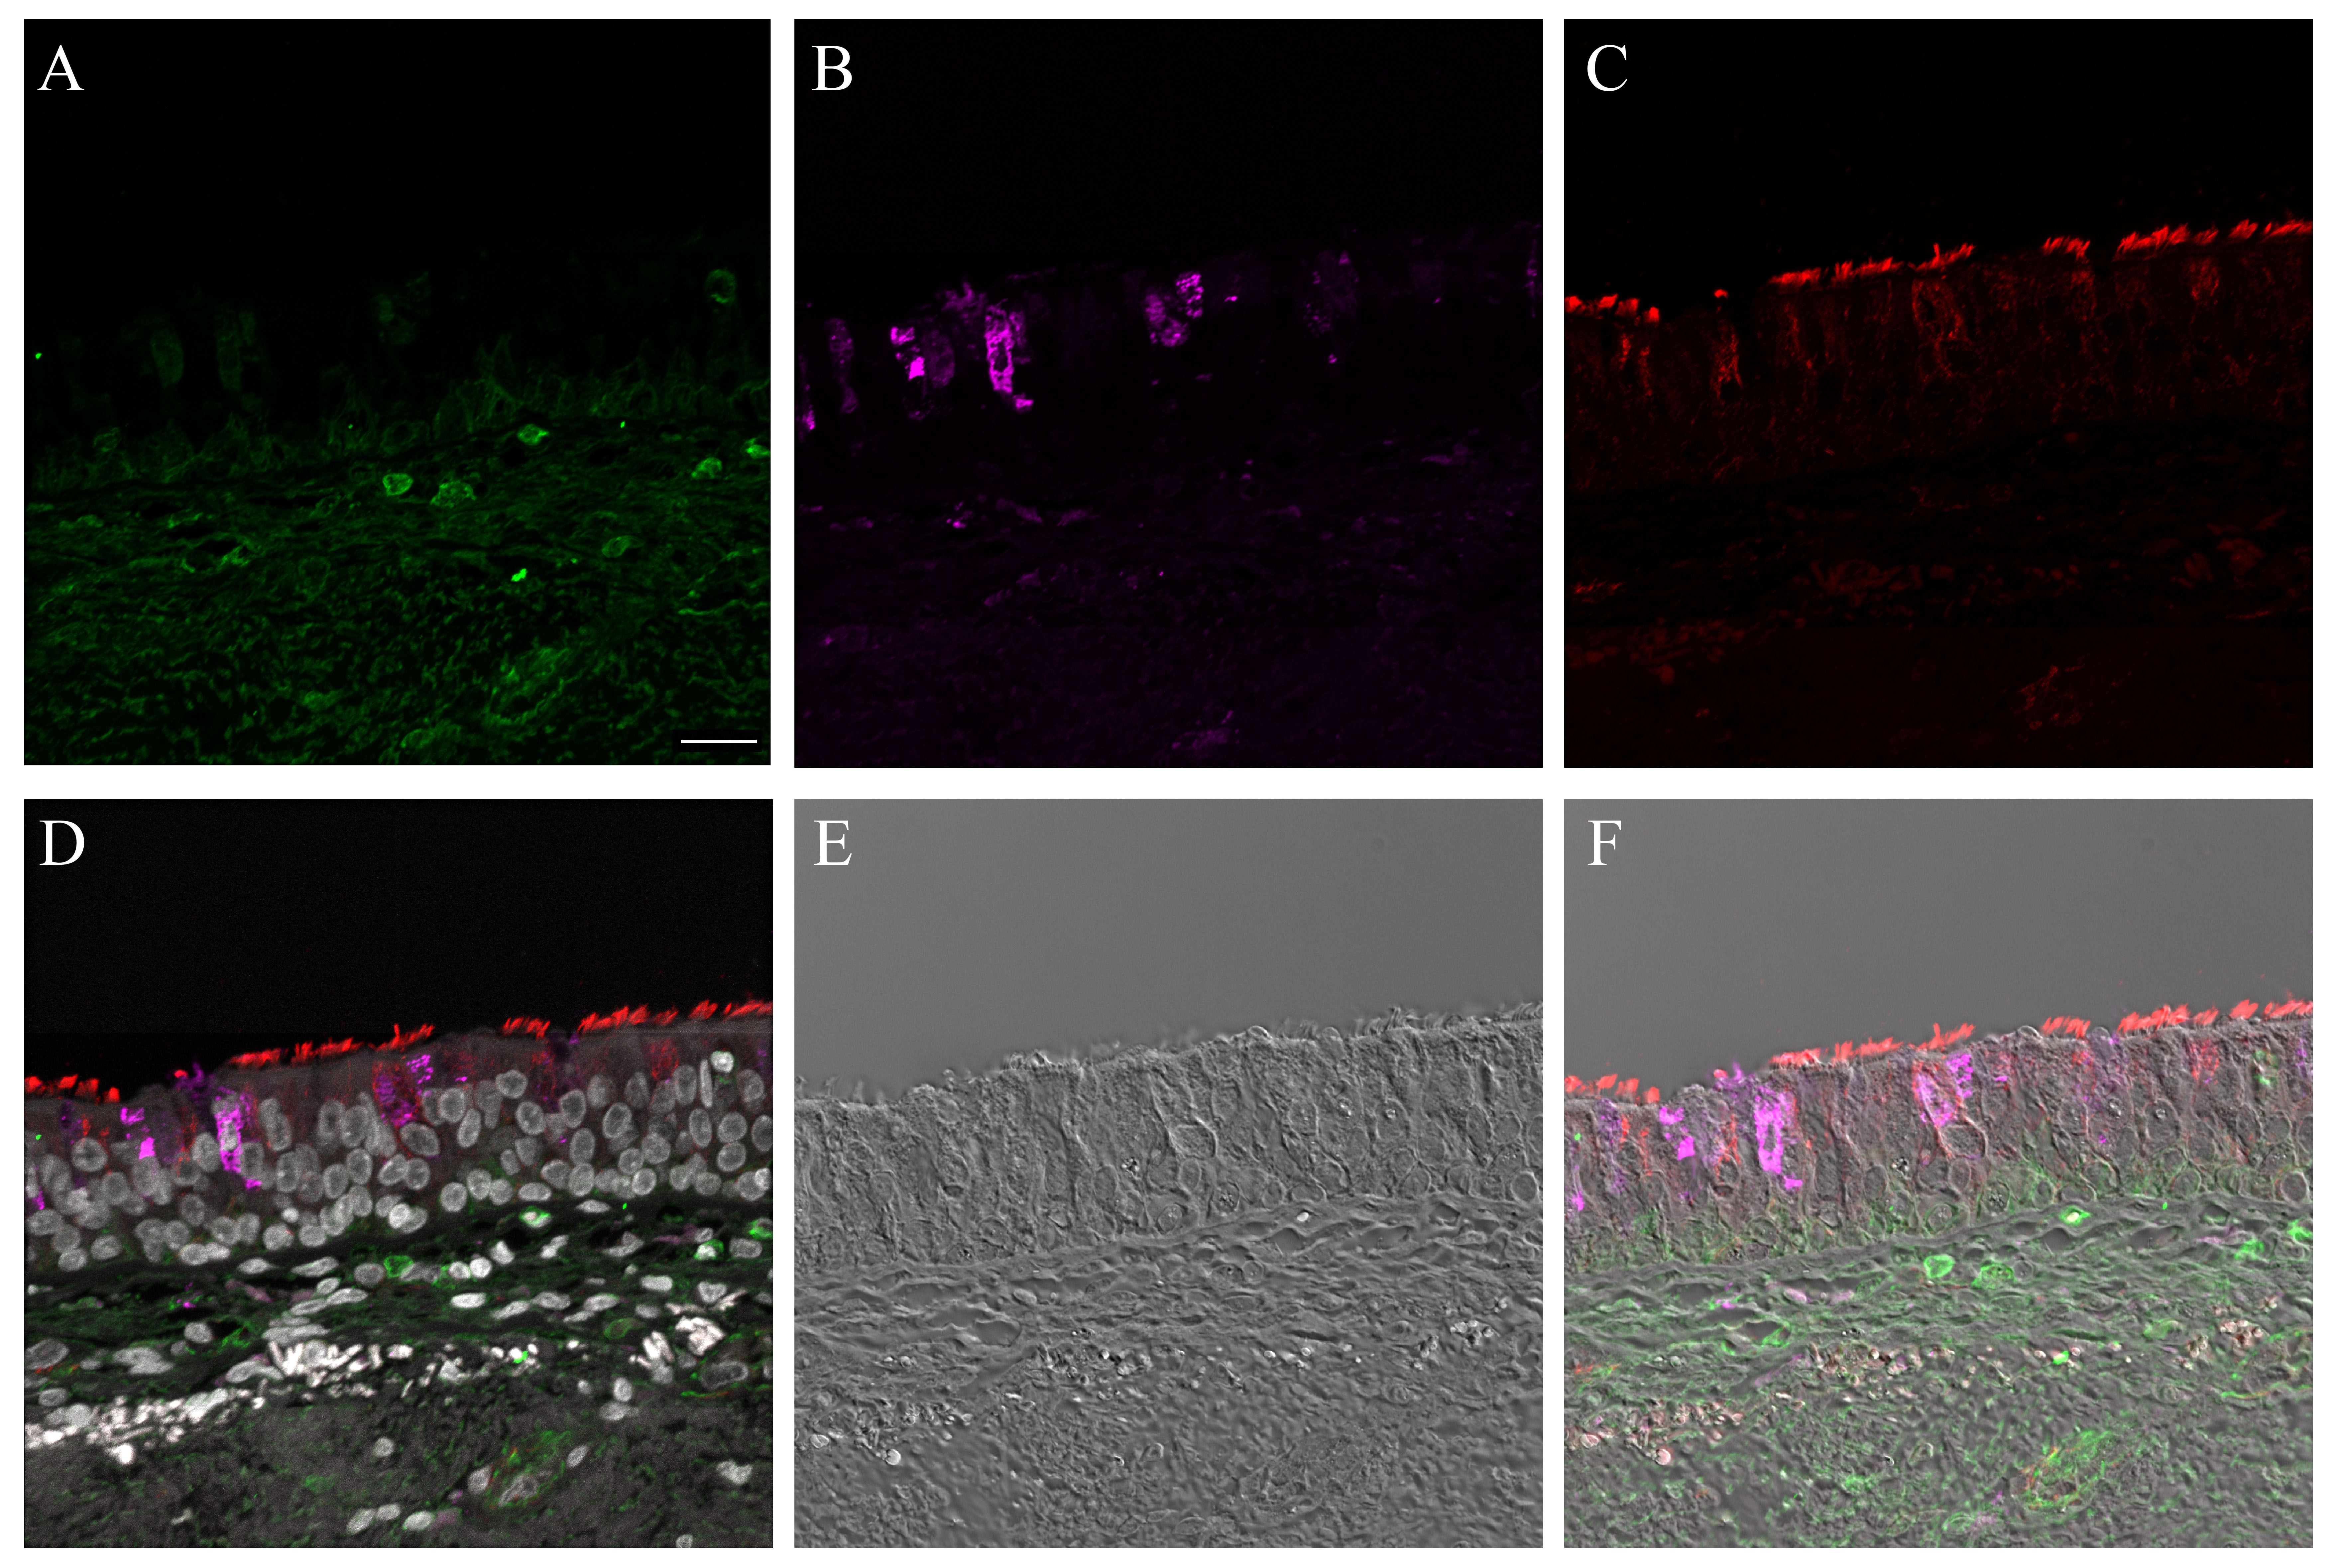
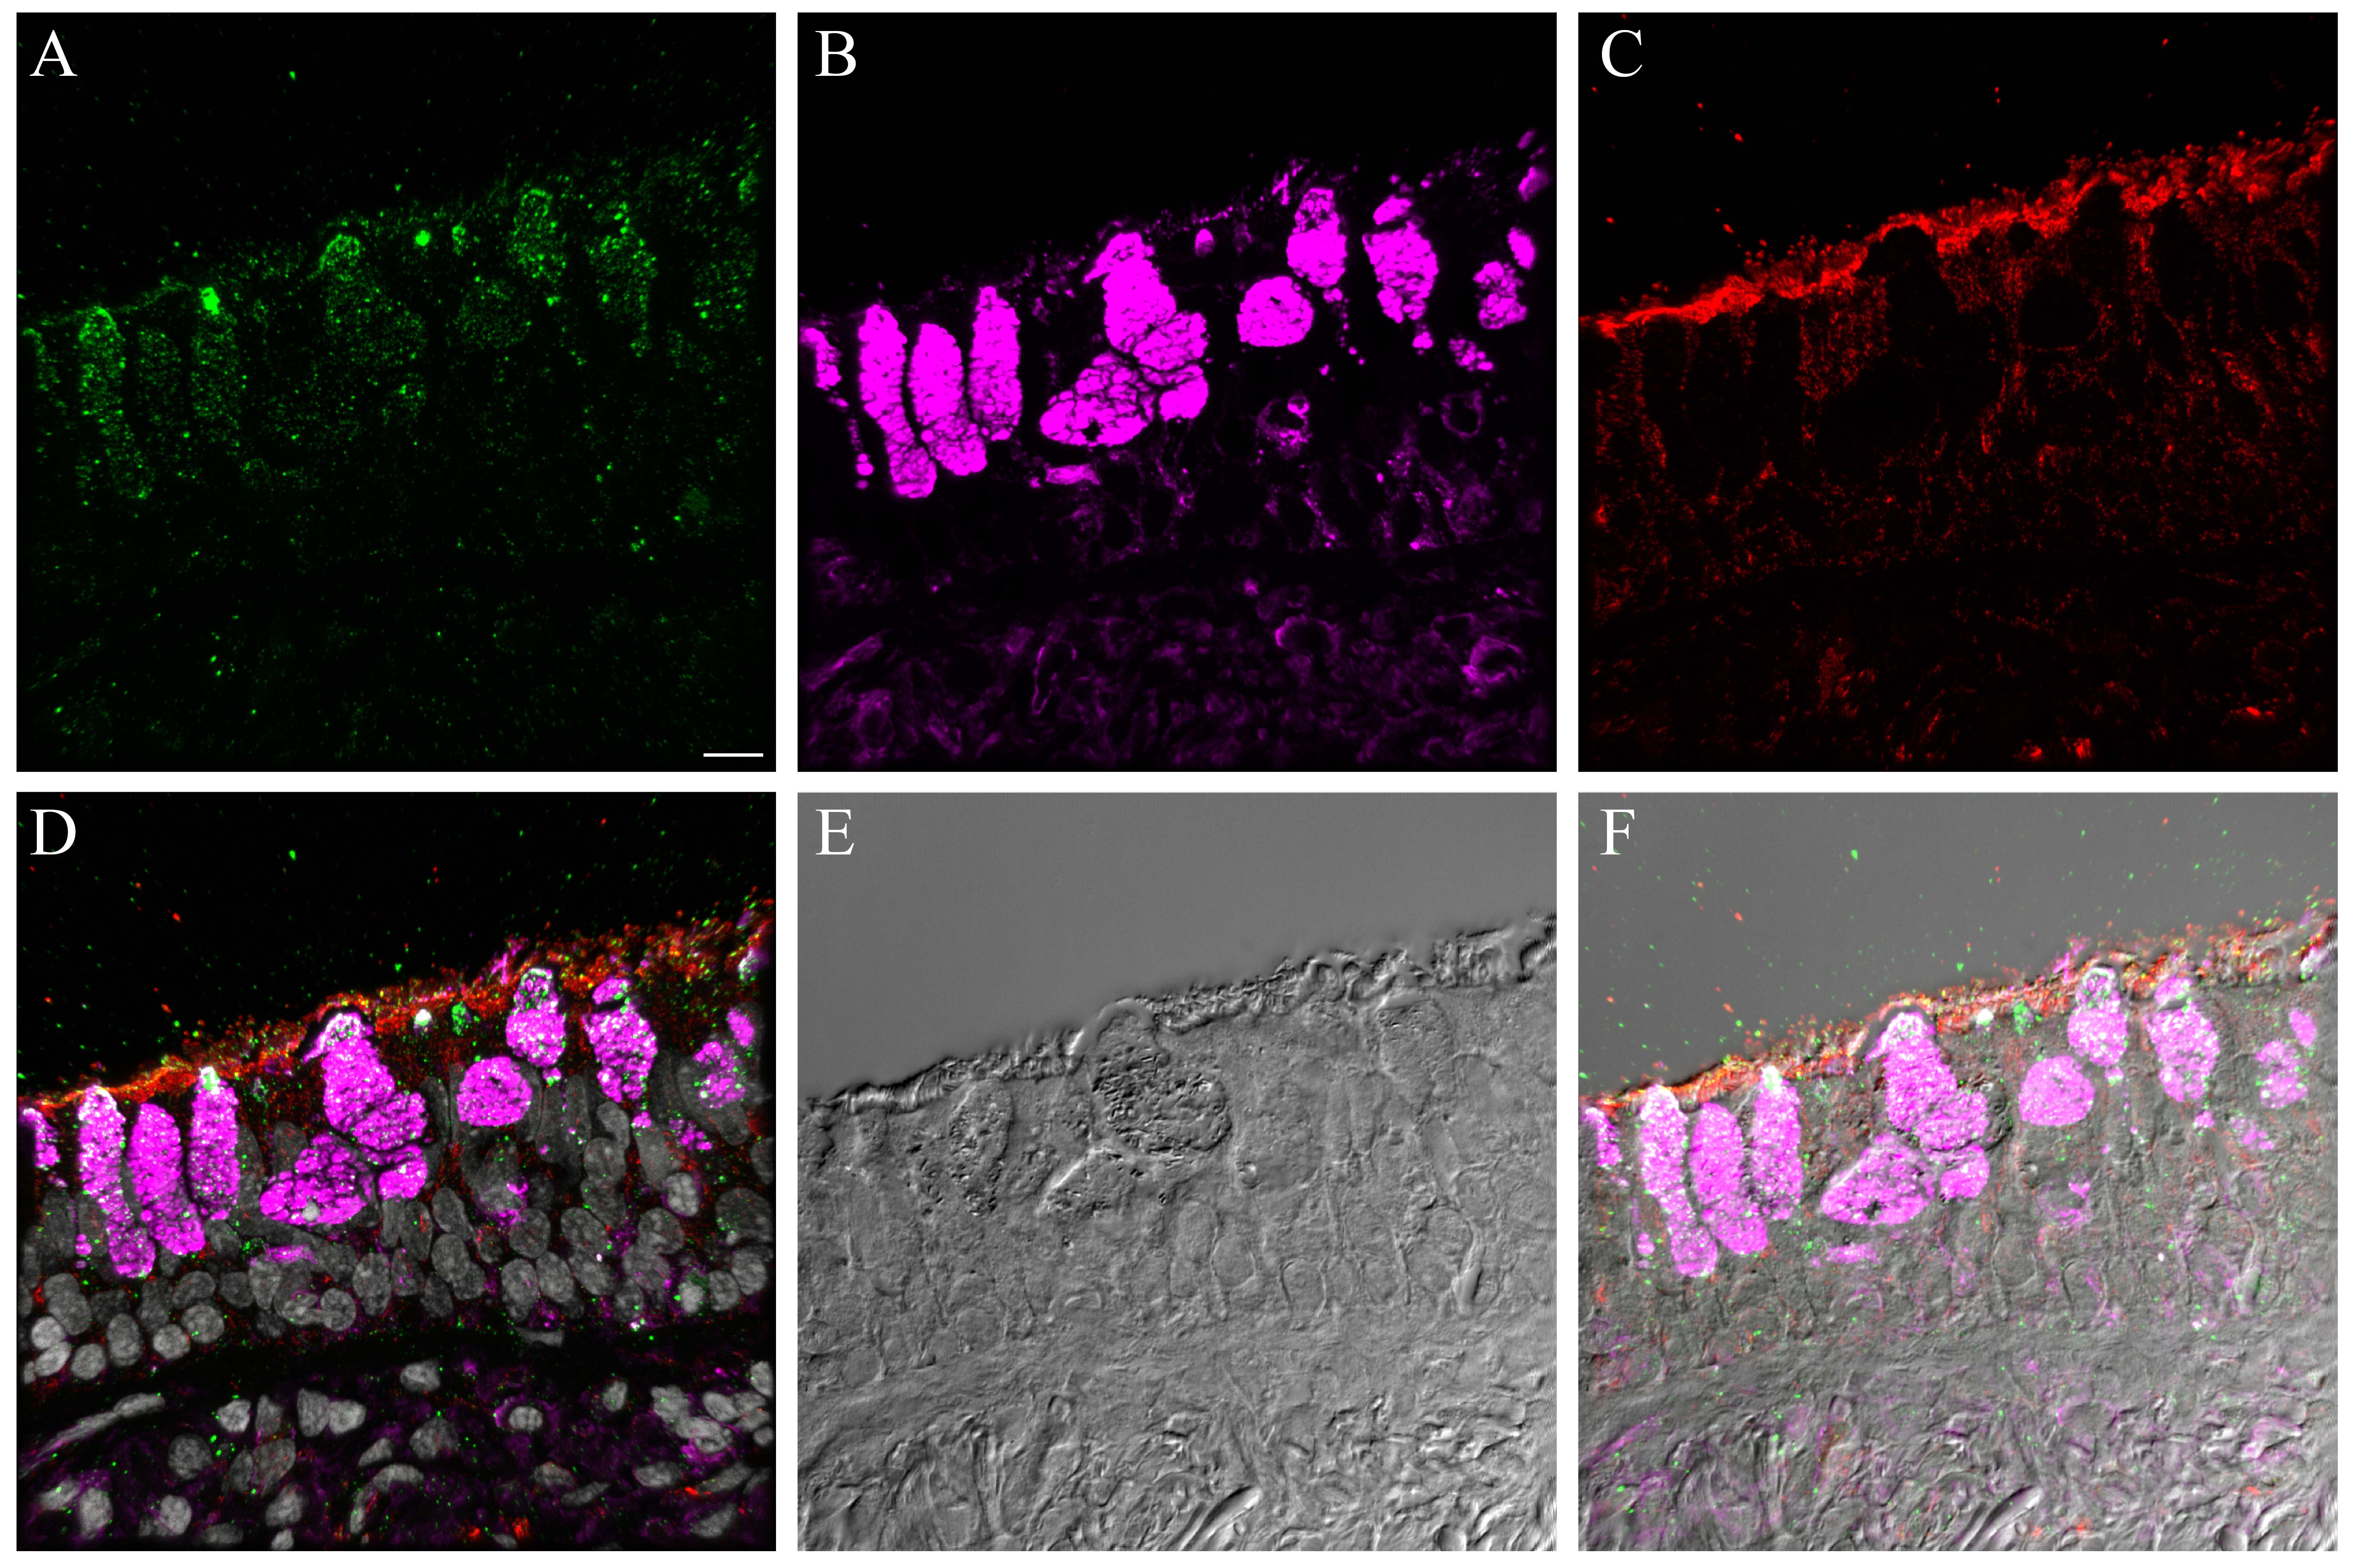
Figure 3.

Influenza receptor lectin distributions in normal human bronchial epithelial (NHBE) cells and distal trachea. Leica SP5 white light laser confocal maximum projection images of full thickness z-stacks of immunofluorescence-labeled, formalin-fixed, paraffin-embedded cells and tissues. All imaging was done with a 40× oil objective at zoom 2.0, 2048×2048 pixels. (Row 1, A–D) Sambucus nigra labeling of differentiated NHBEs and distal trachea, lectin labeling alone, A and C, and lectin labeling with ciliated and goblet cell markers, B and D. (Row 2, E–H) Maackia amurensis II labeling of differentiated NHBEs and distal trachea, lectin labeling alone, E and G, and lectin labeling with ciliated and goblet cell markers, F and H. The pseudo-colors are receptor lectins (green), goblet cells (magenta) and ciliated cells (red). Yellow indicates co-localization between a receptor lectin and the ciliated cell marker. White indicates co-localization between a receptor lectin and the goblet cell marker. Scale, 20 µm.
MAA II labeled rare, apical aspects of NHBE cells. When these cells were examined in conjunction with cell type markers they were consistently determined to be goblet cells (Figs. 3E–3F, S12). In contrast, on the distal trachea and carina sections, MAA II labeled more cells overall. Both the apical aspects and the mucins within the goblet cells were positive (Fig. 3G–3H). In the first trachea sample, there was some MAA II signal correlation with ciliated cells (Fig. S13). However, this correlation was not observed in the second donor trachea or carina samples (Figs. S14, S15).
MAA I labeled the NHBE ciliated cells (Fig. S16A–S16B). In contrast, after NA treatment, MAA I labeled nearly the entire NHBE apical epithelial surface, corresponding to a mix of ciliated and goblet cells (Fig. S16C–S16D). On the distal trachea samples, MAA I faintly labeled nearly the entire apical epithelial surface as well as submucosal gland epithelial cells (Fig. S16E–S16F). Again, as with the NHBE cells, the MAA I labeling intensity increased post NA treatment and included goblet cell mucins (Fig. S16G, S16H).
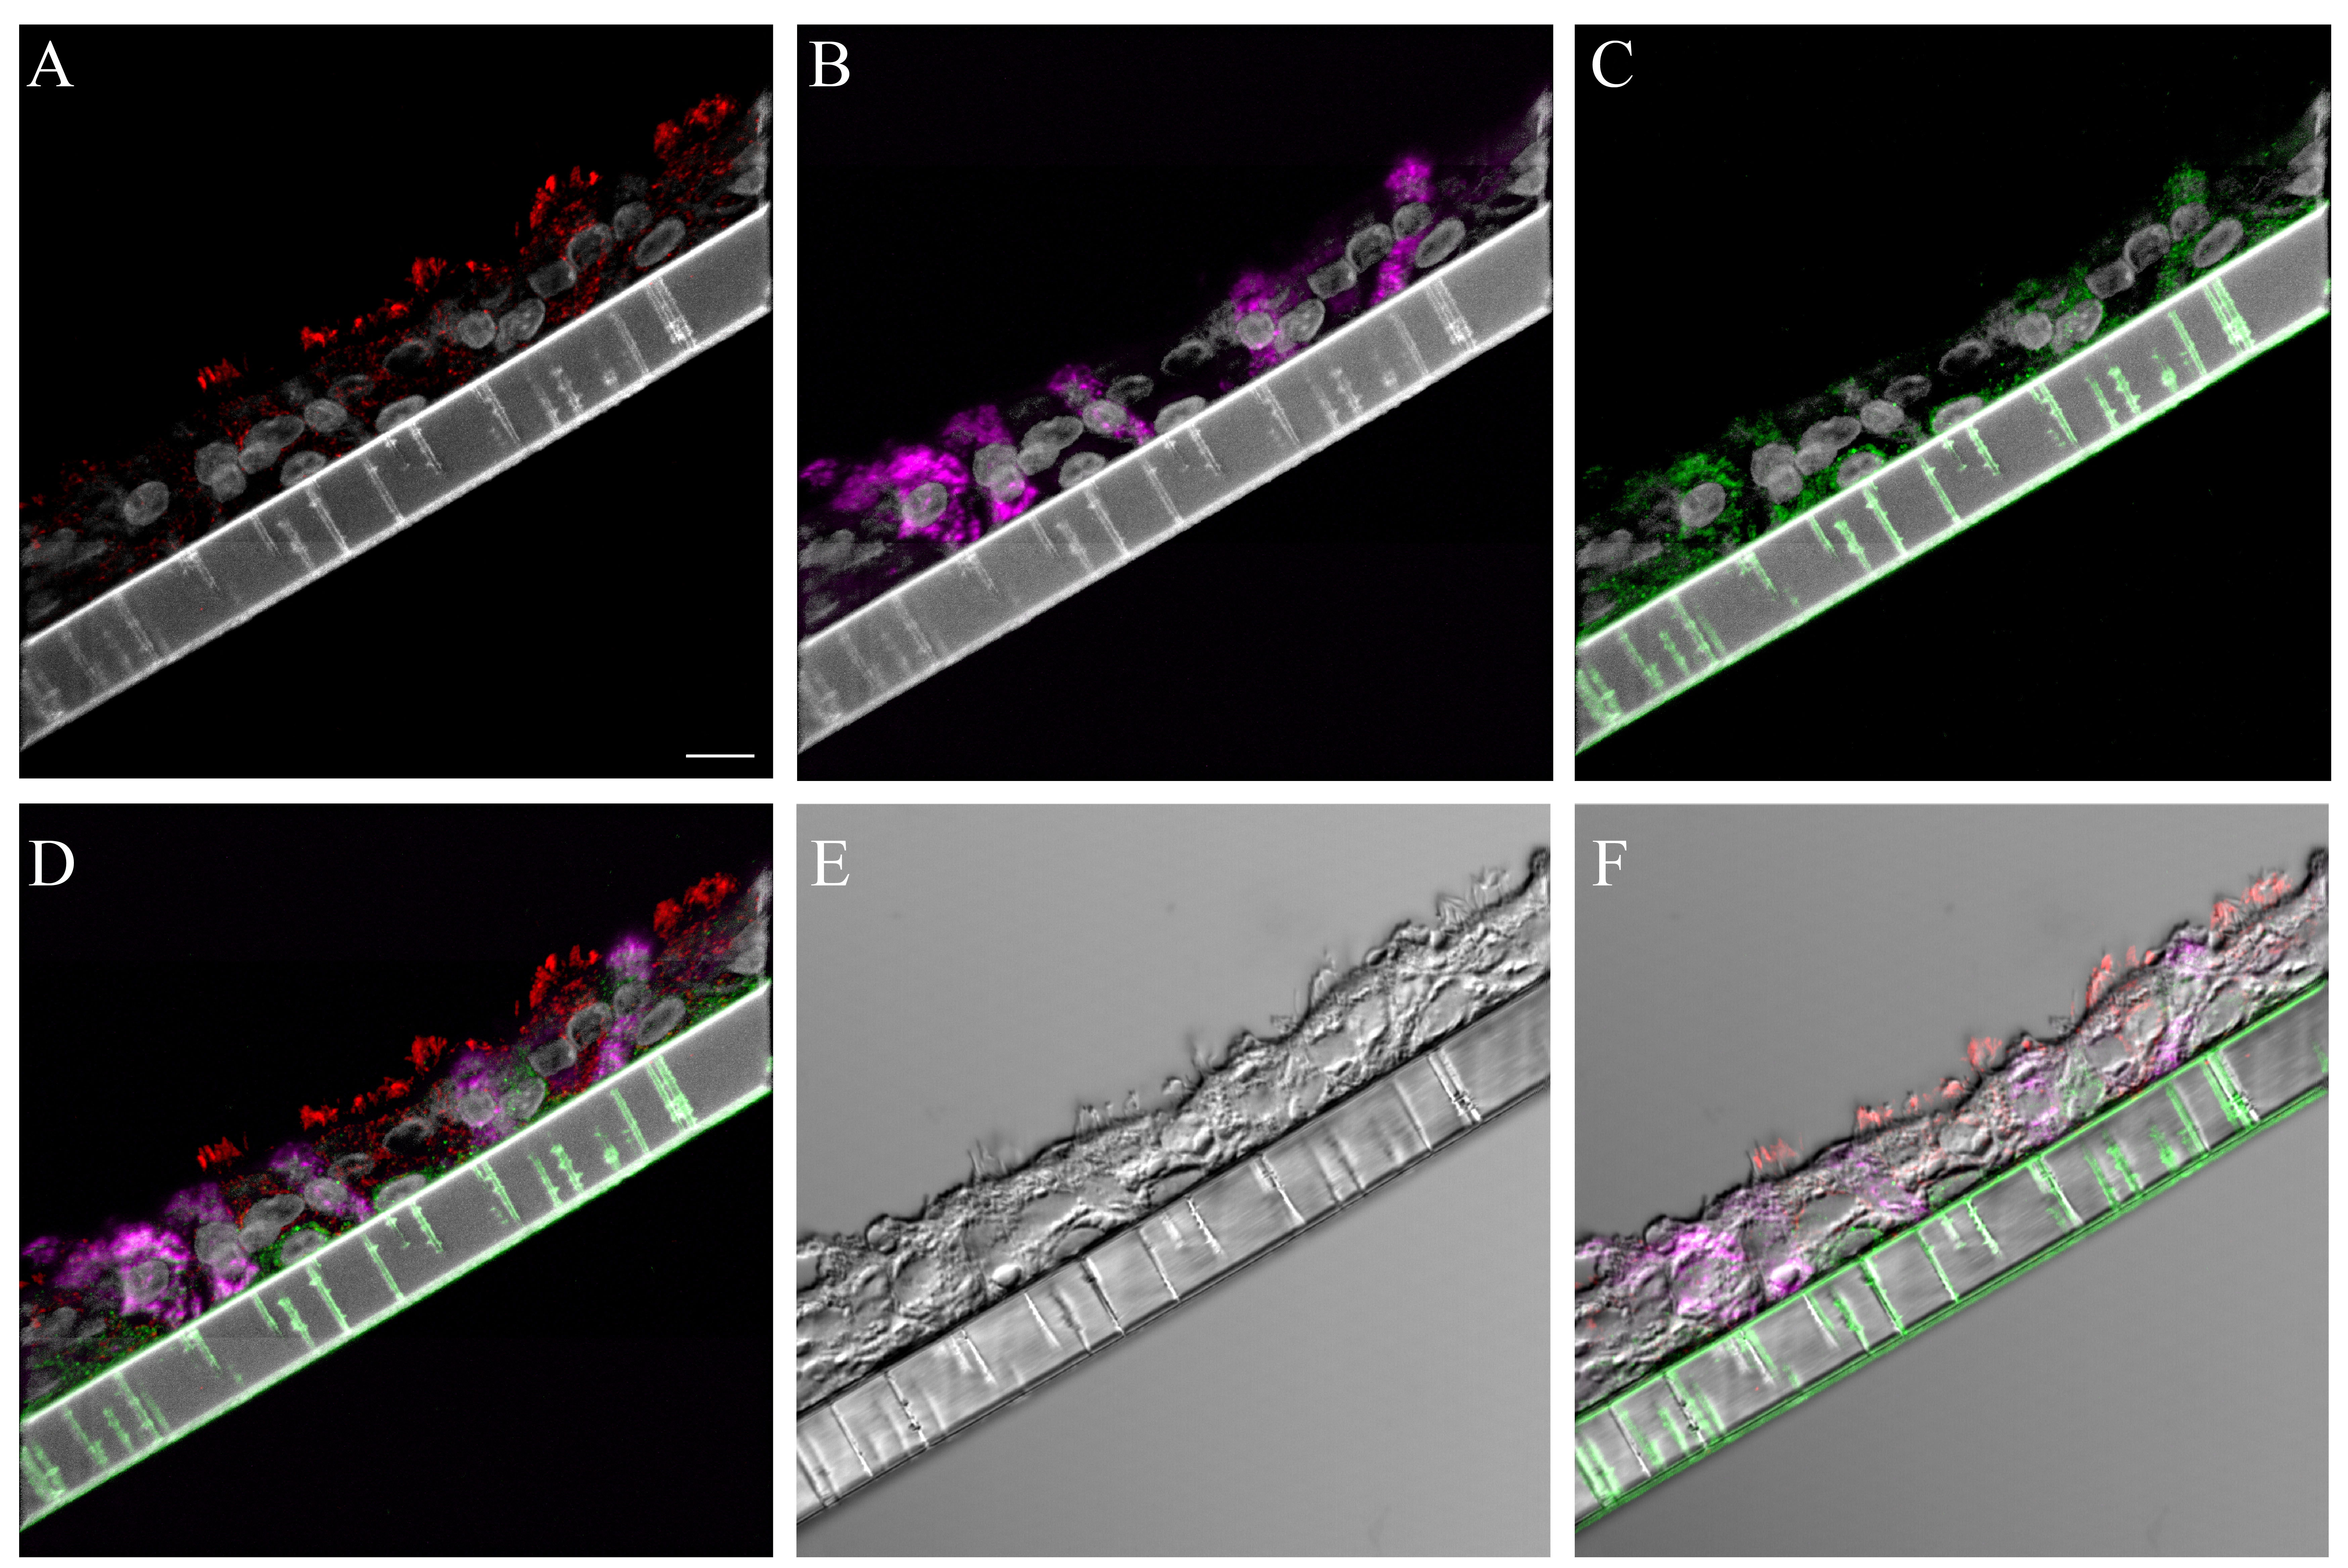
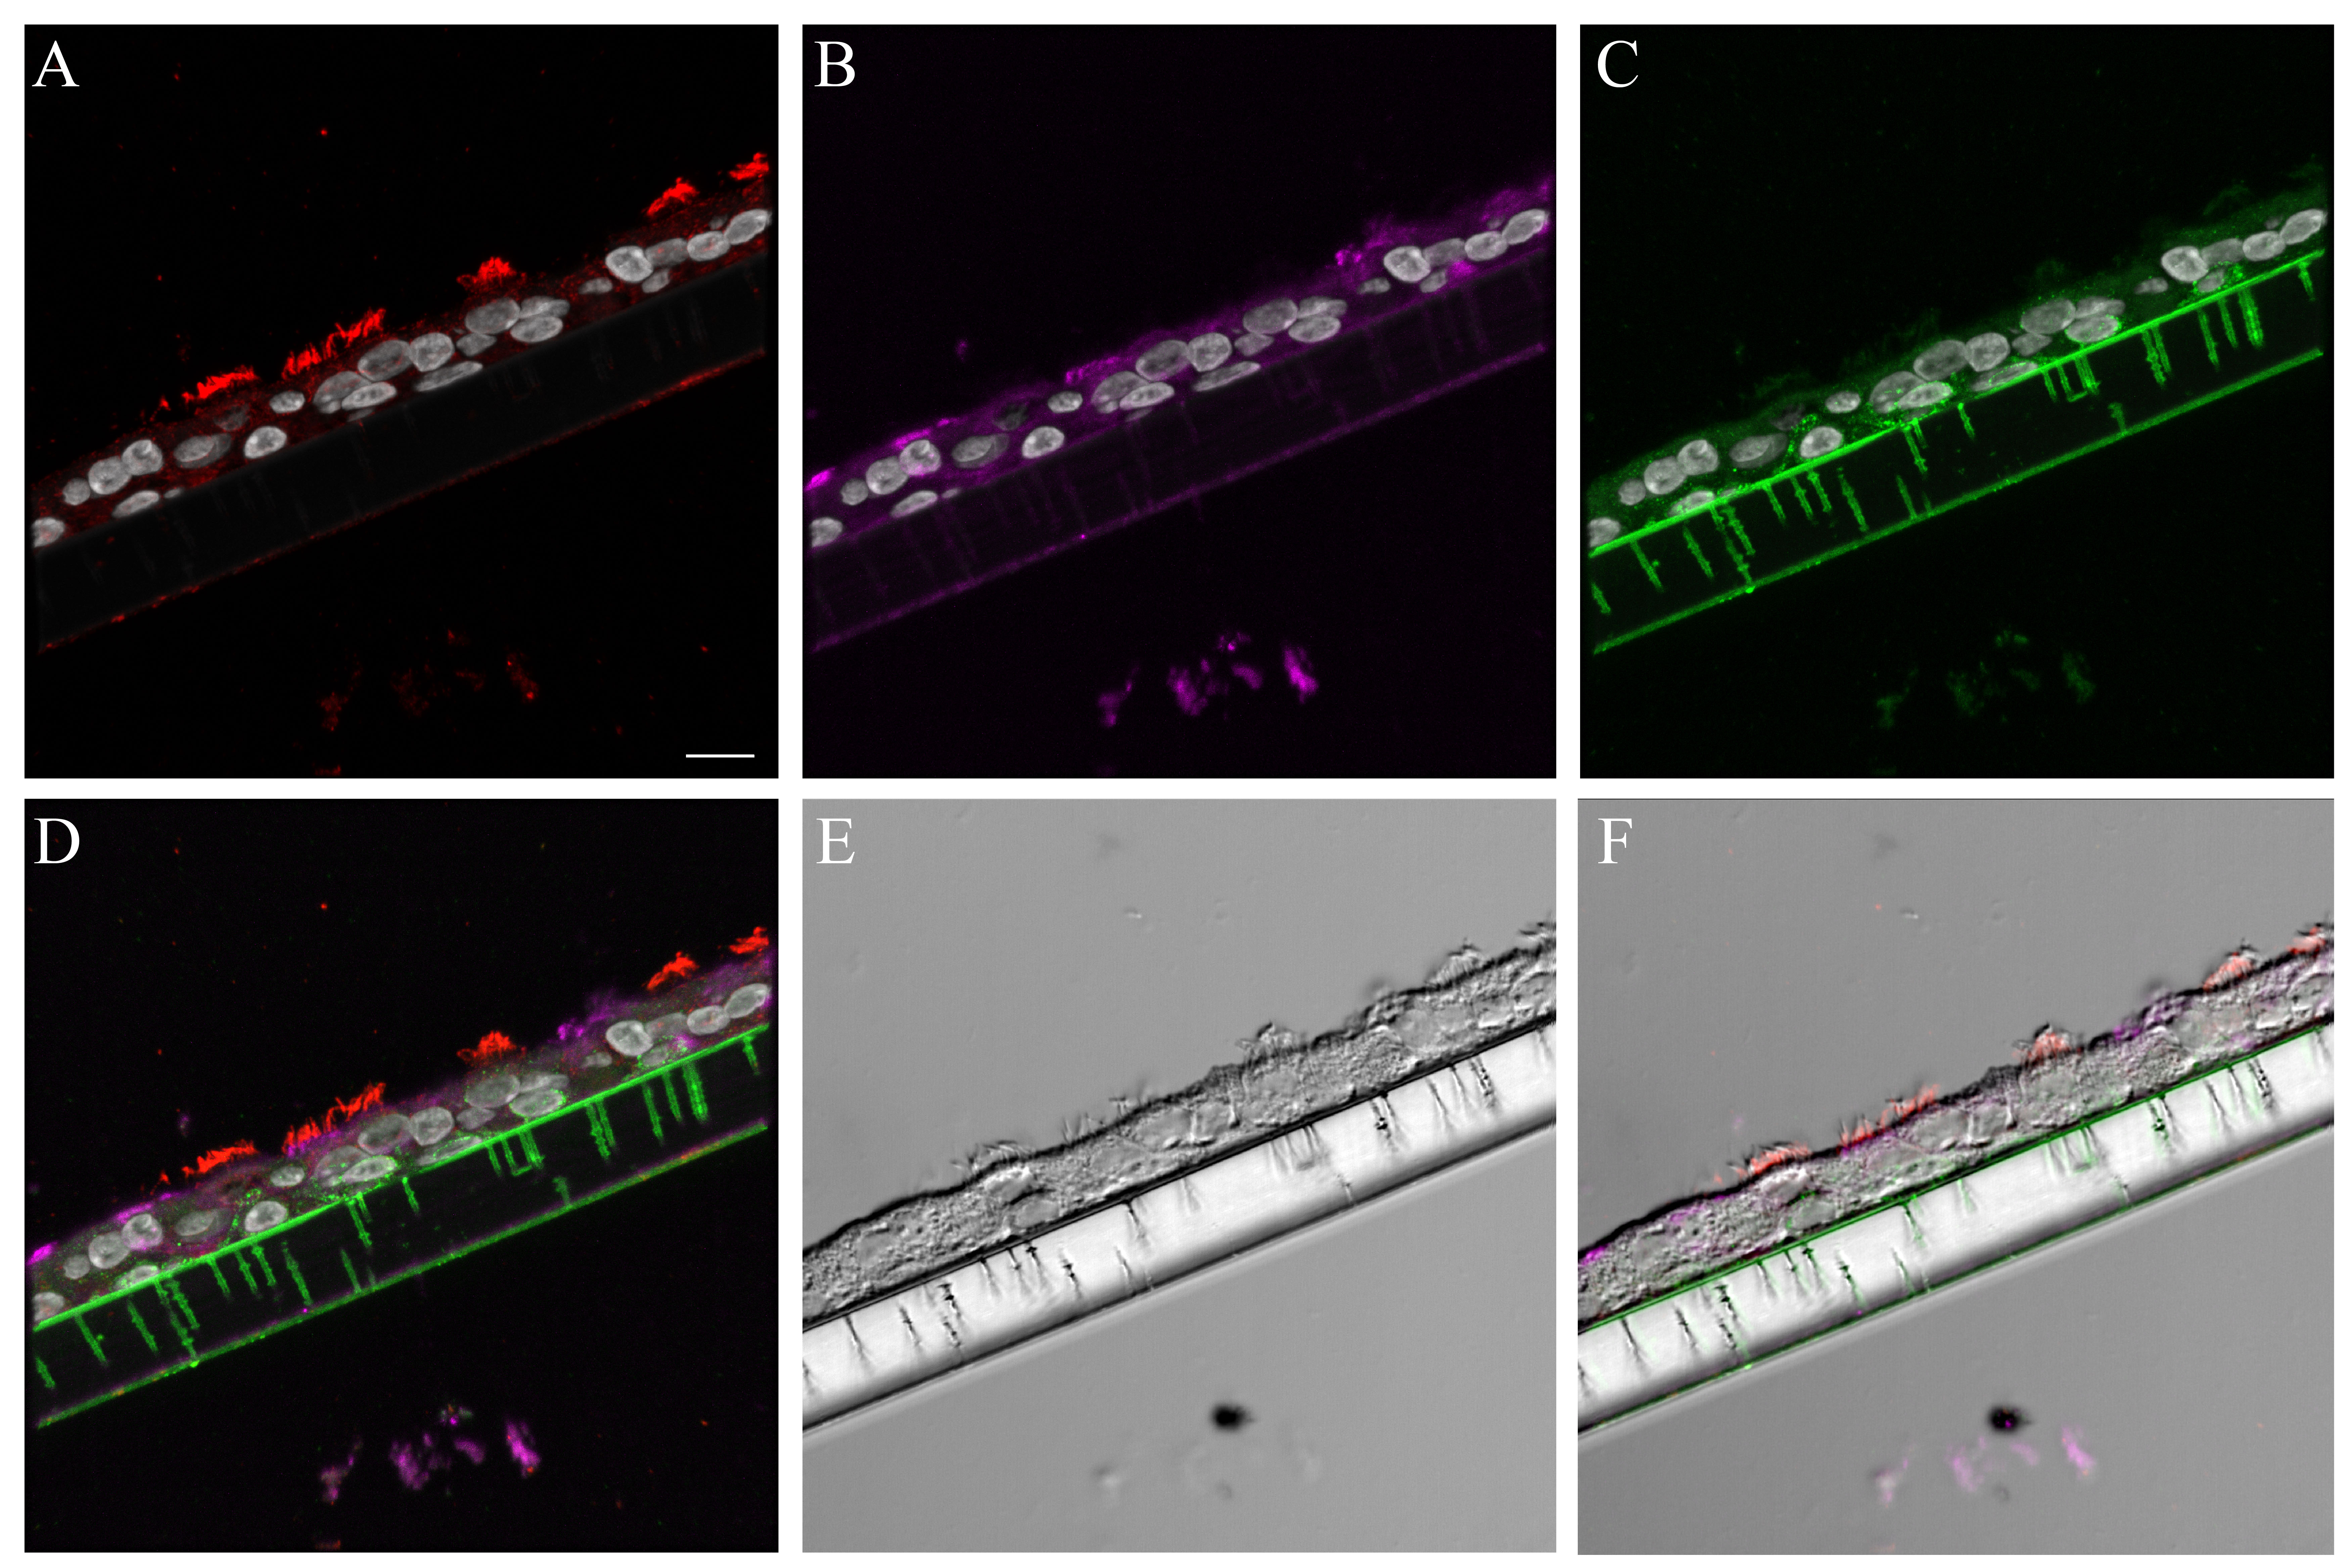
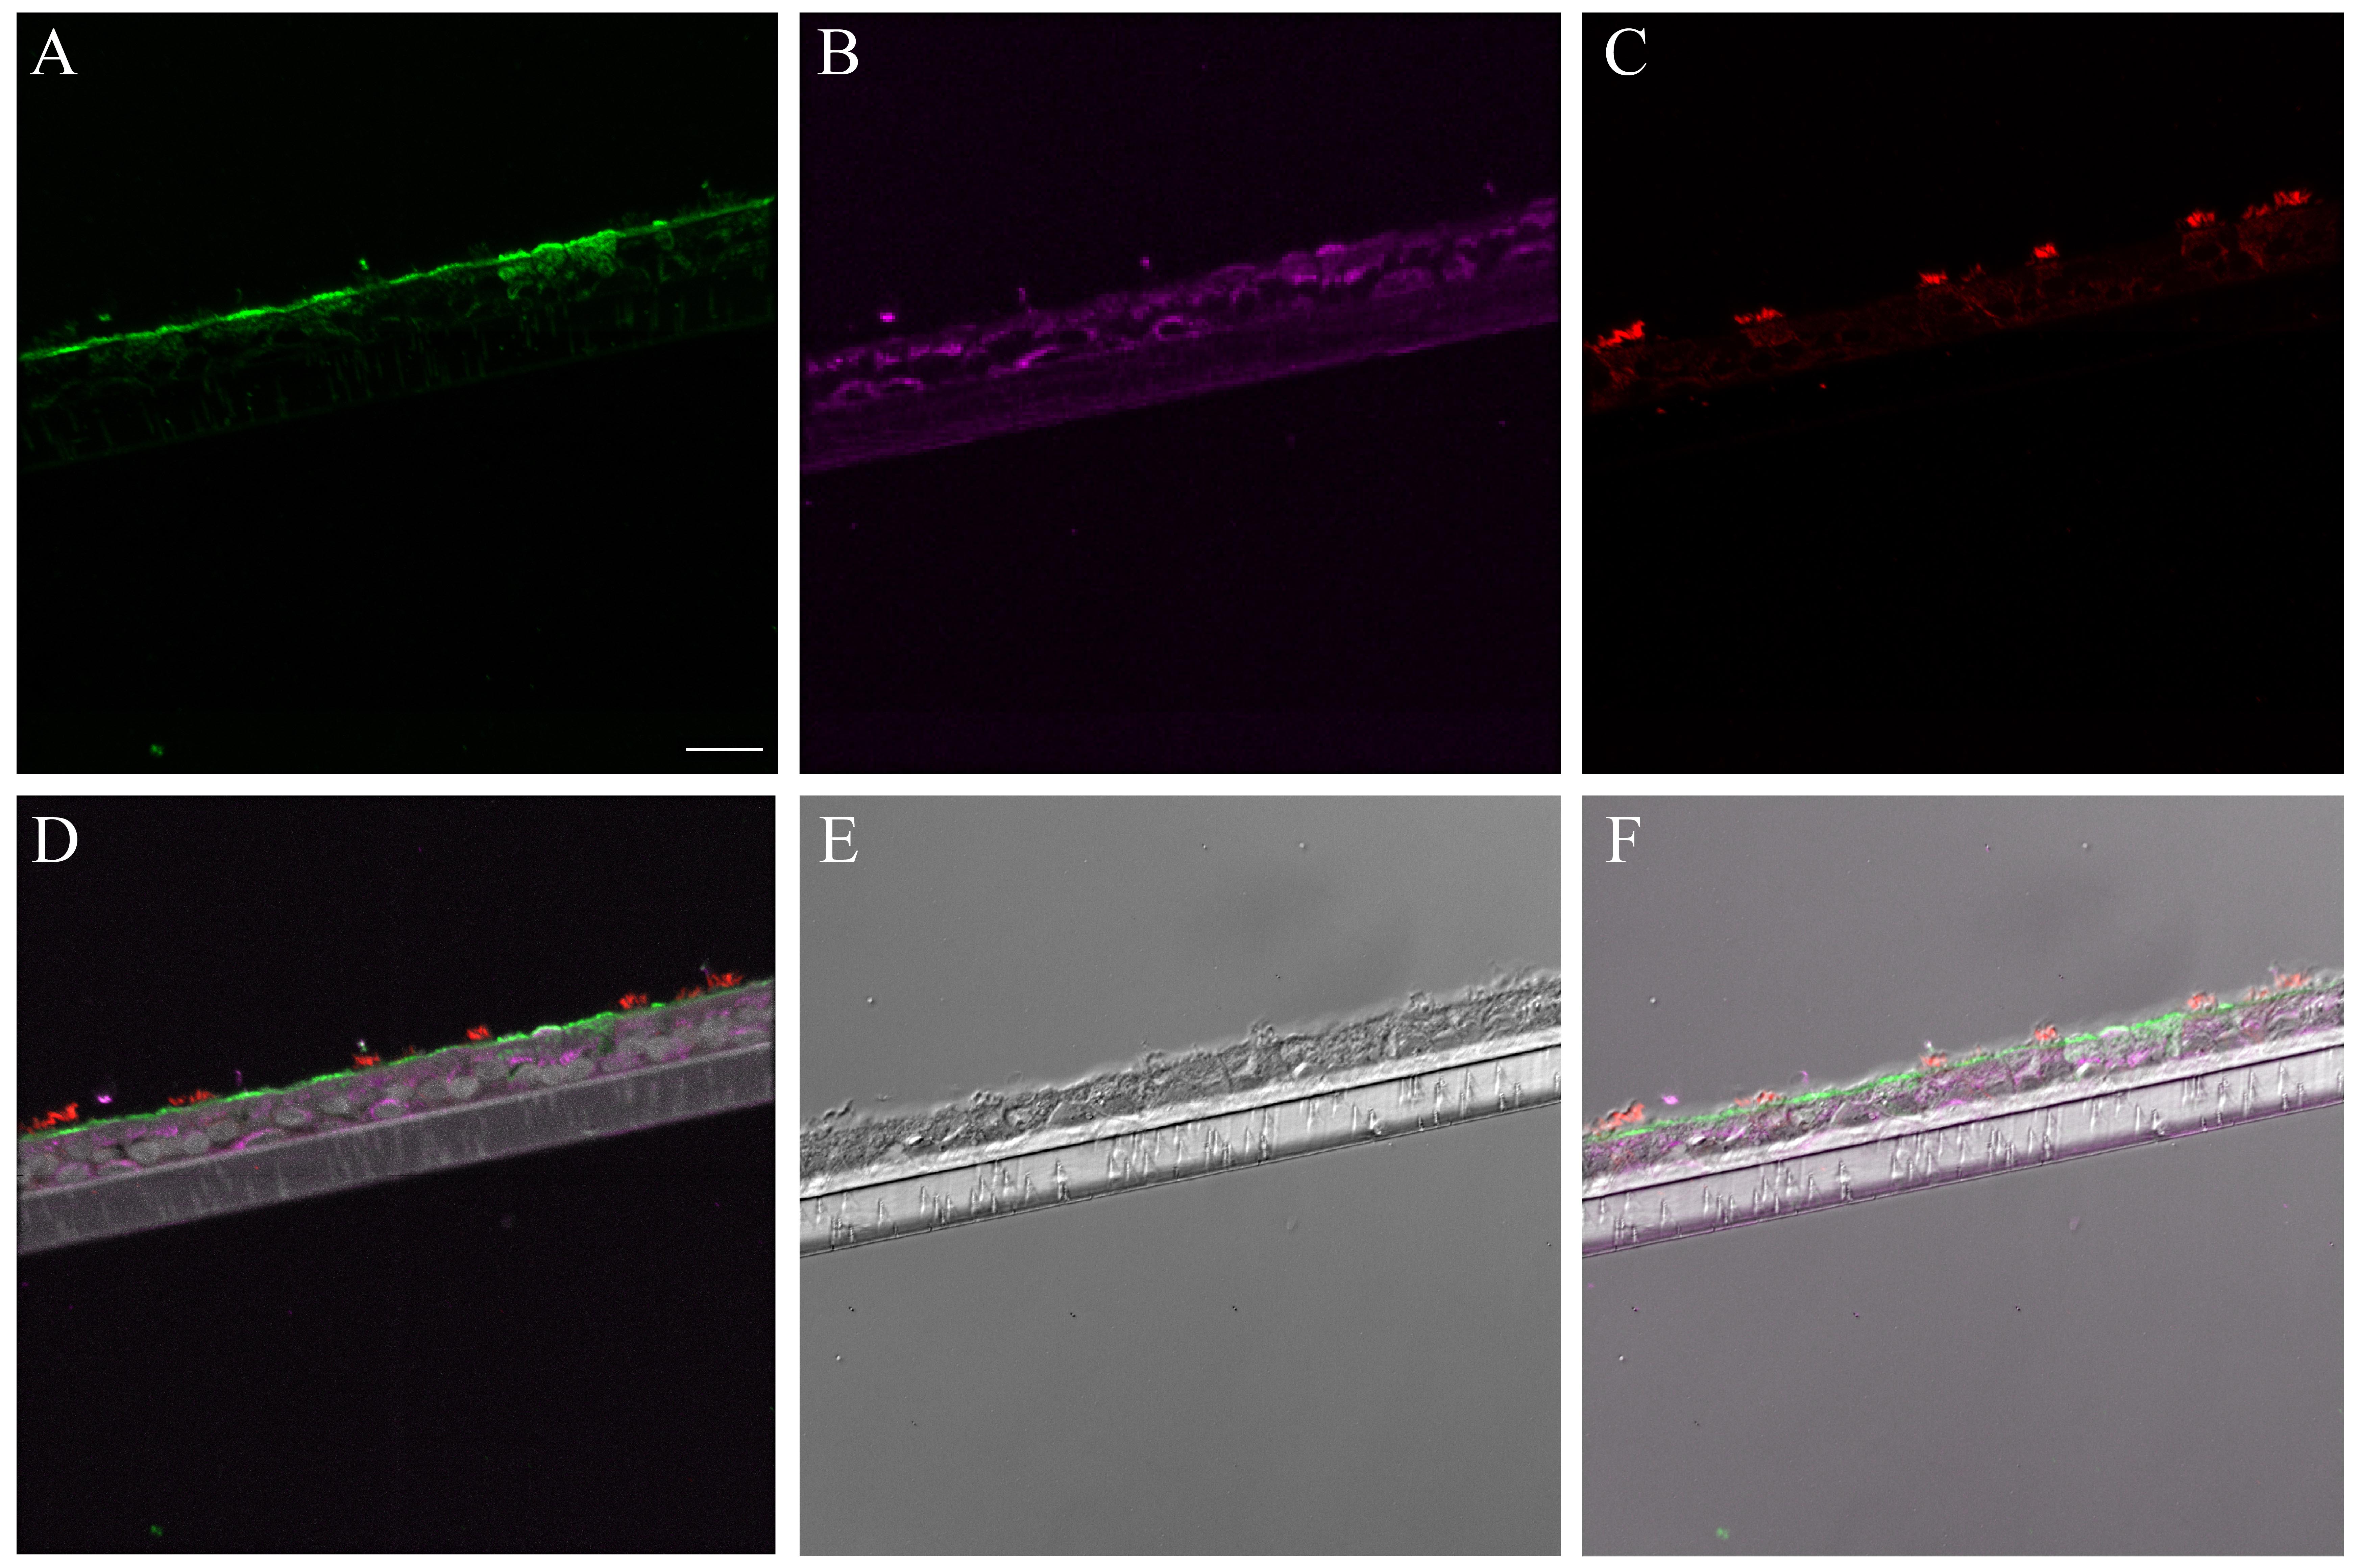
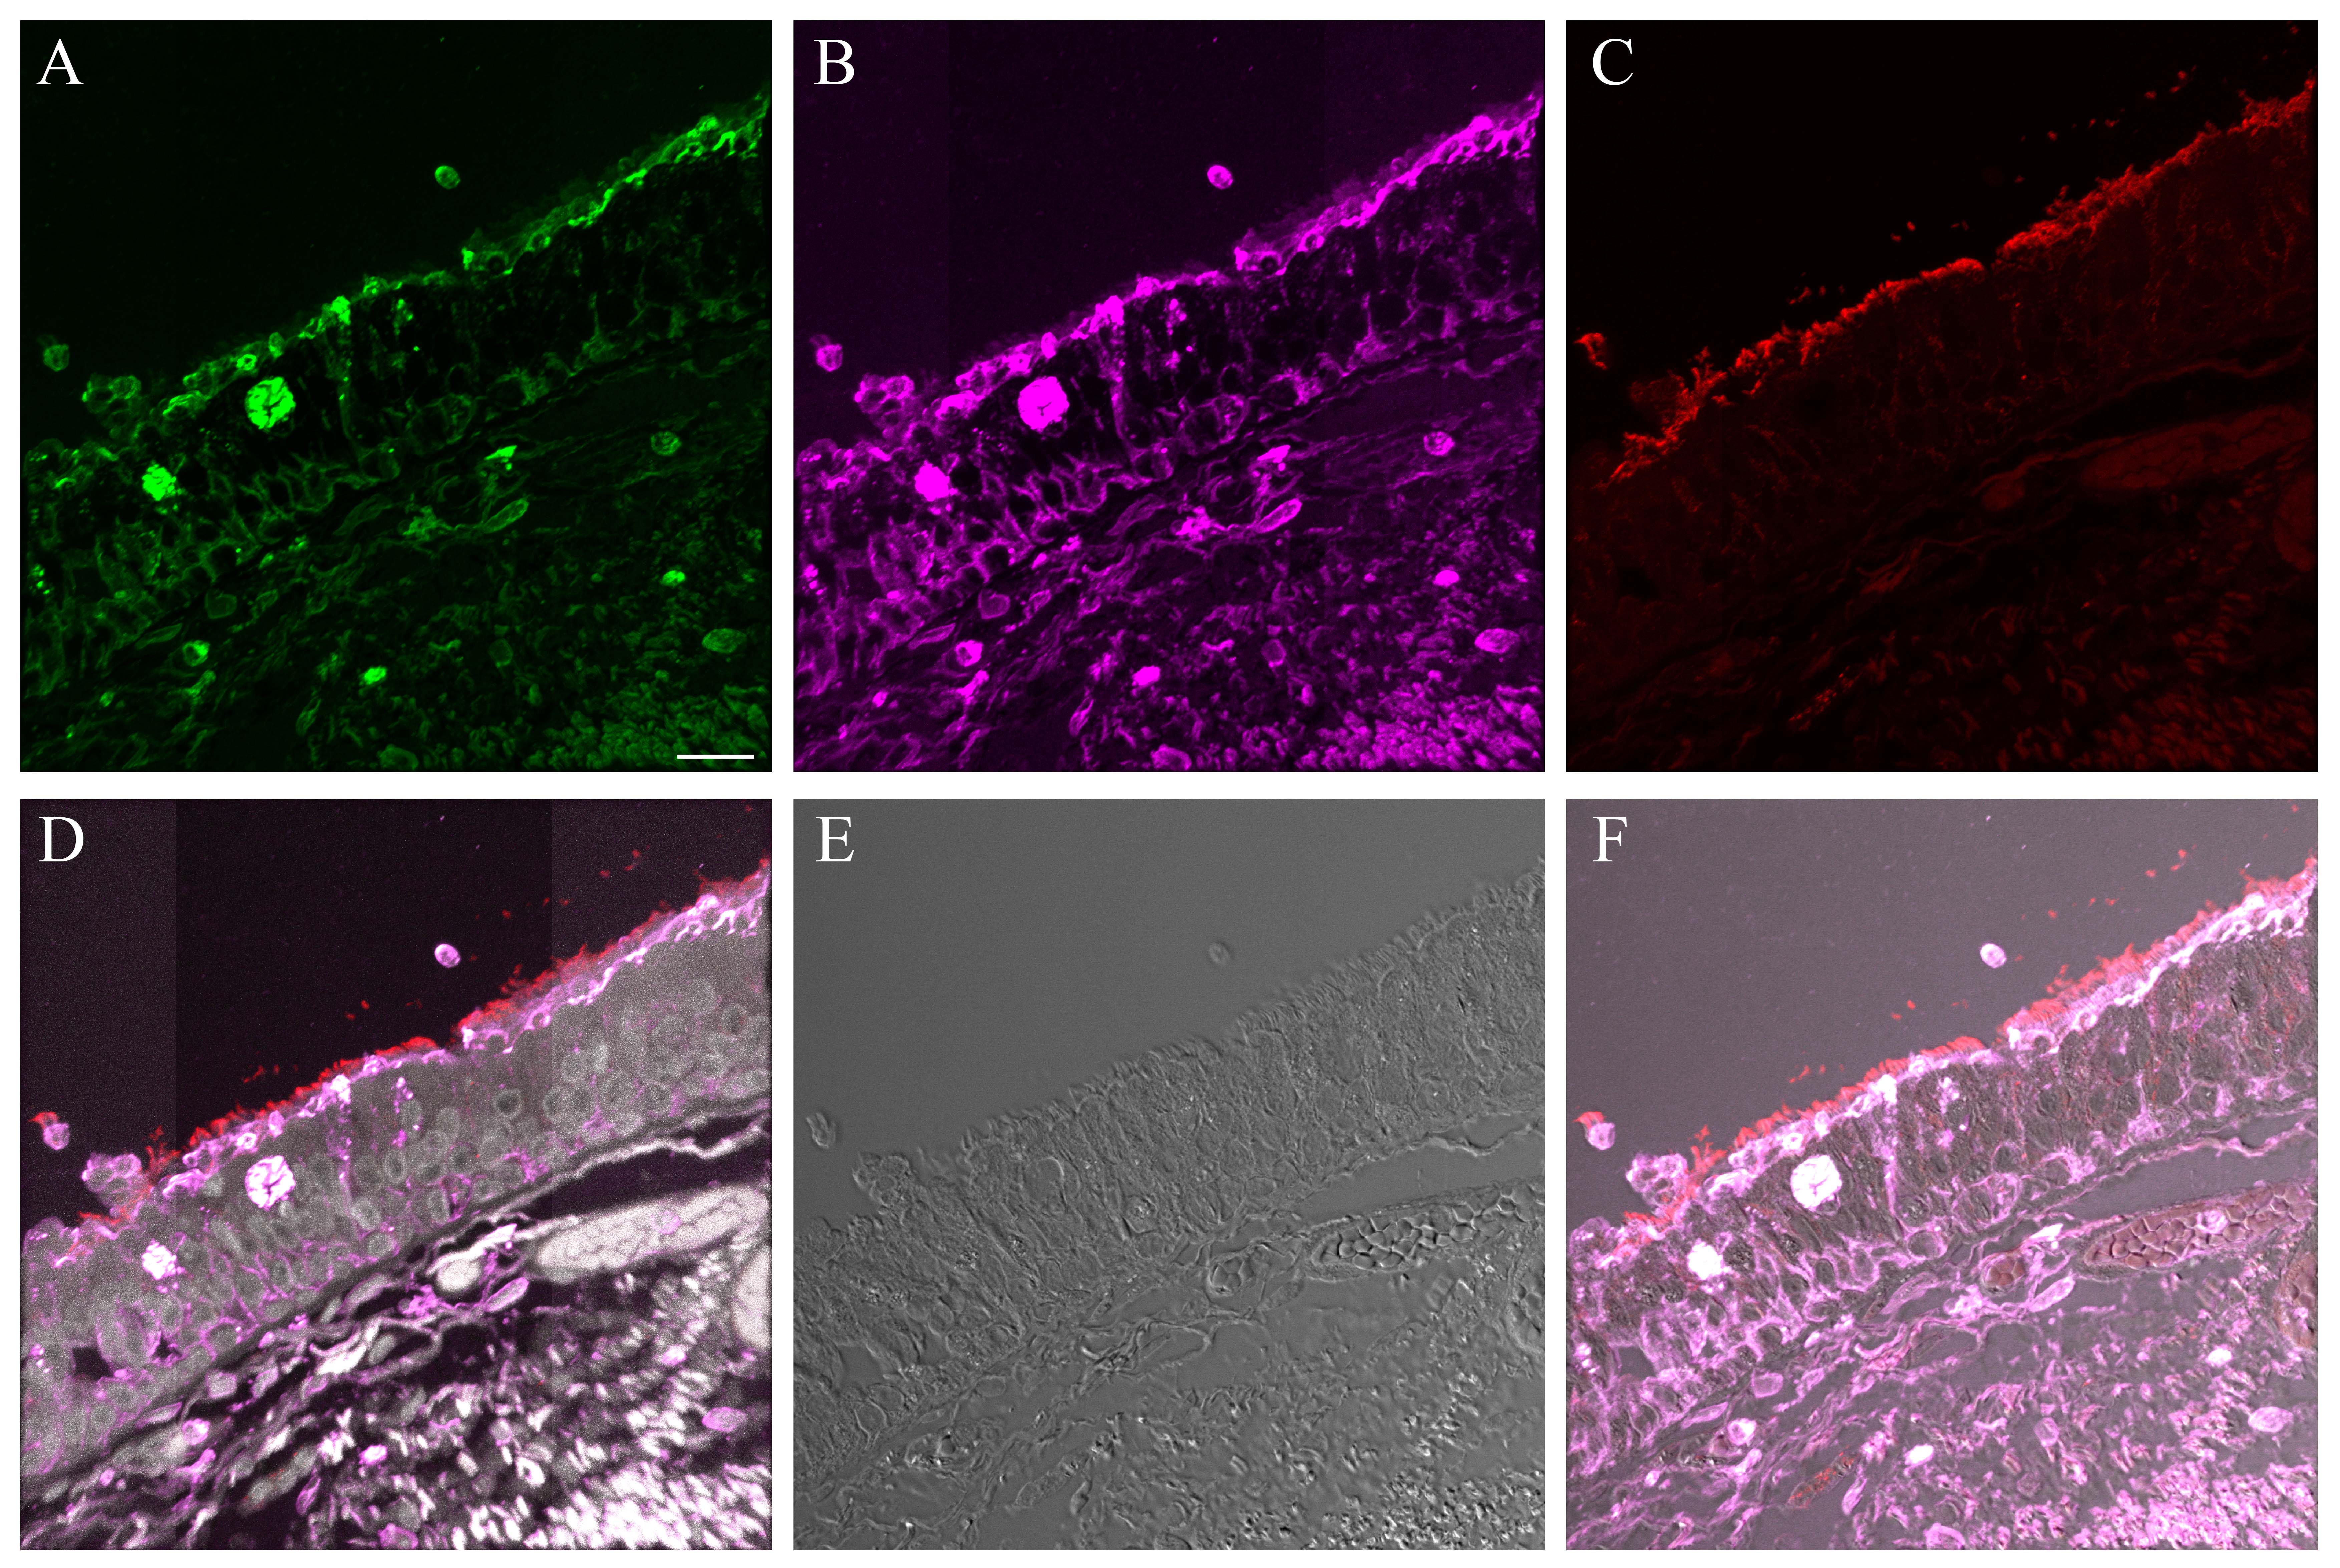
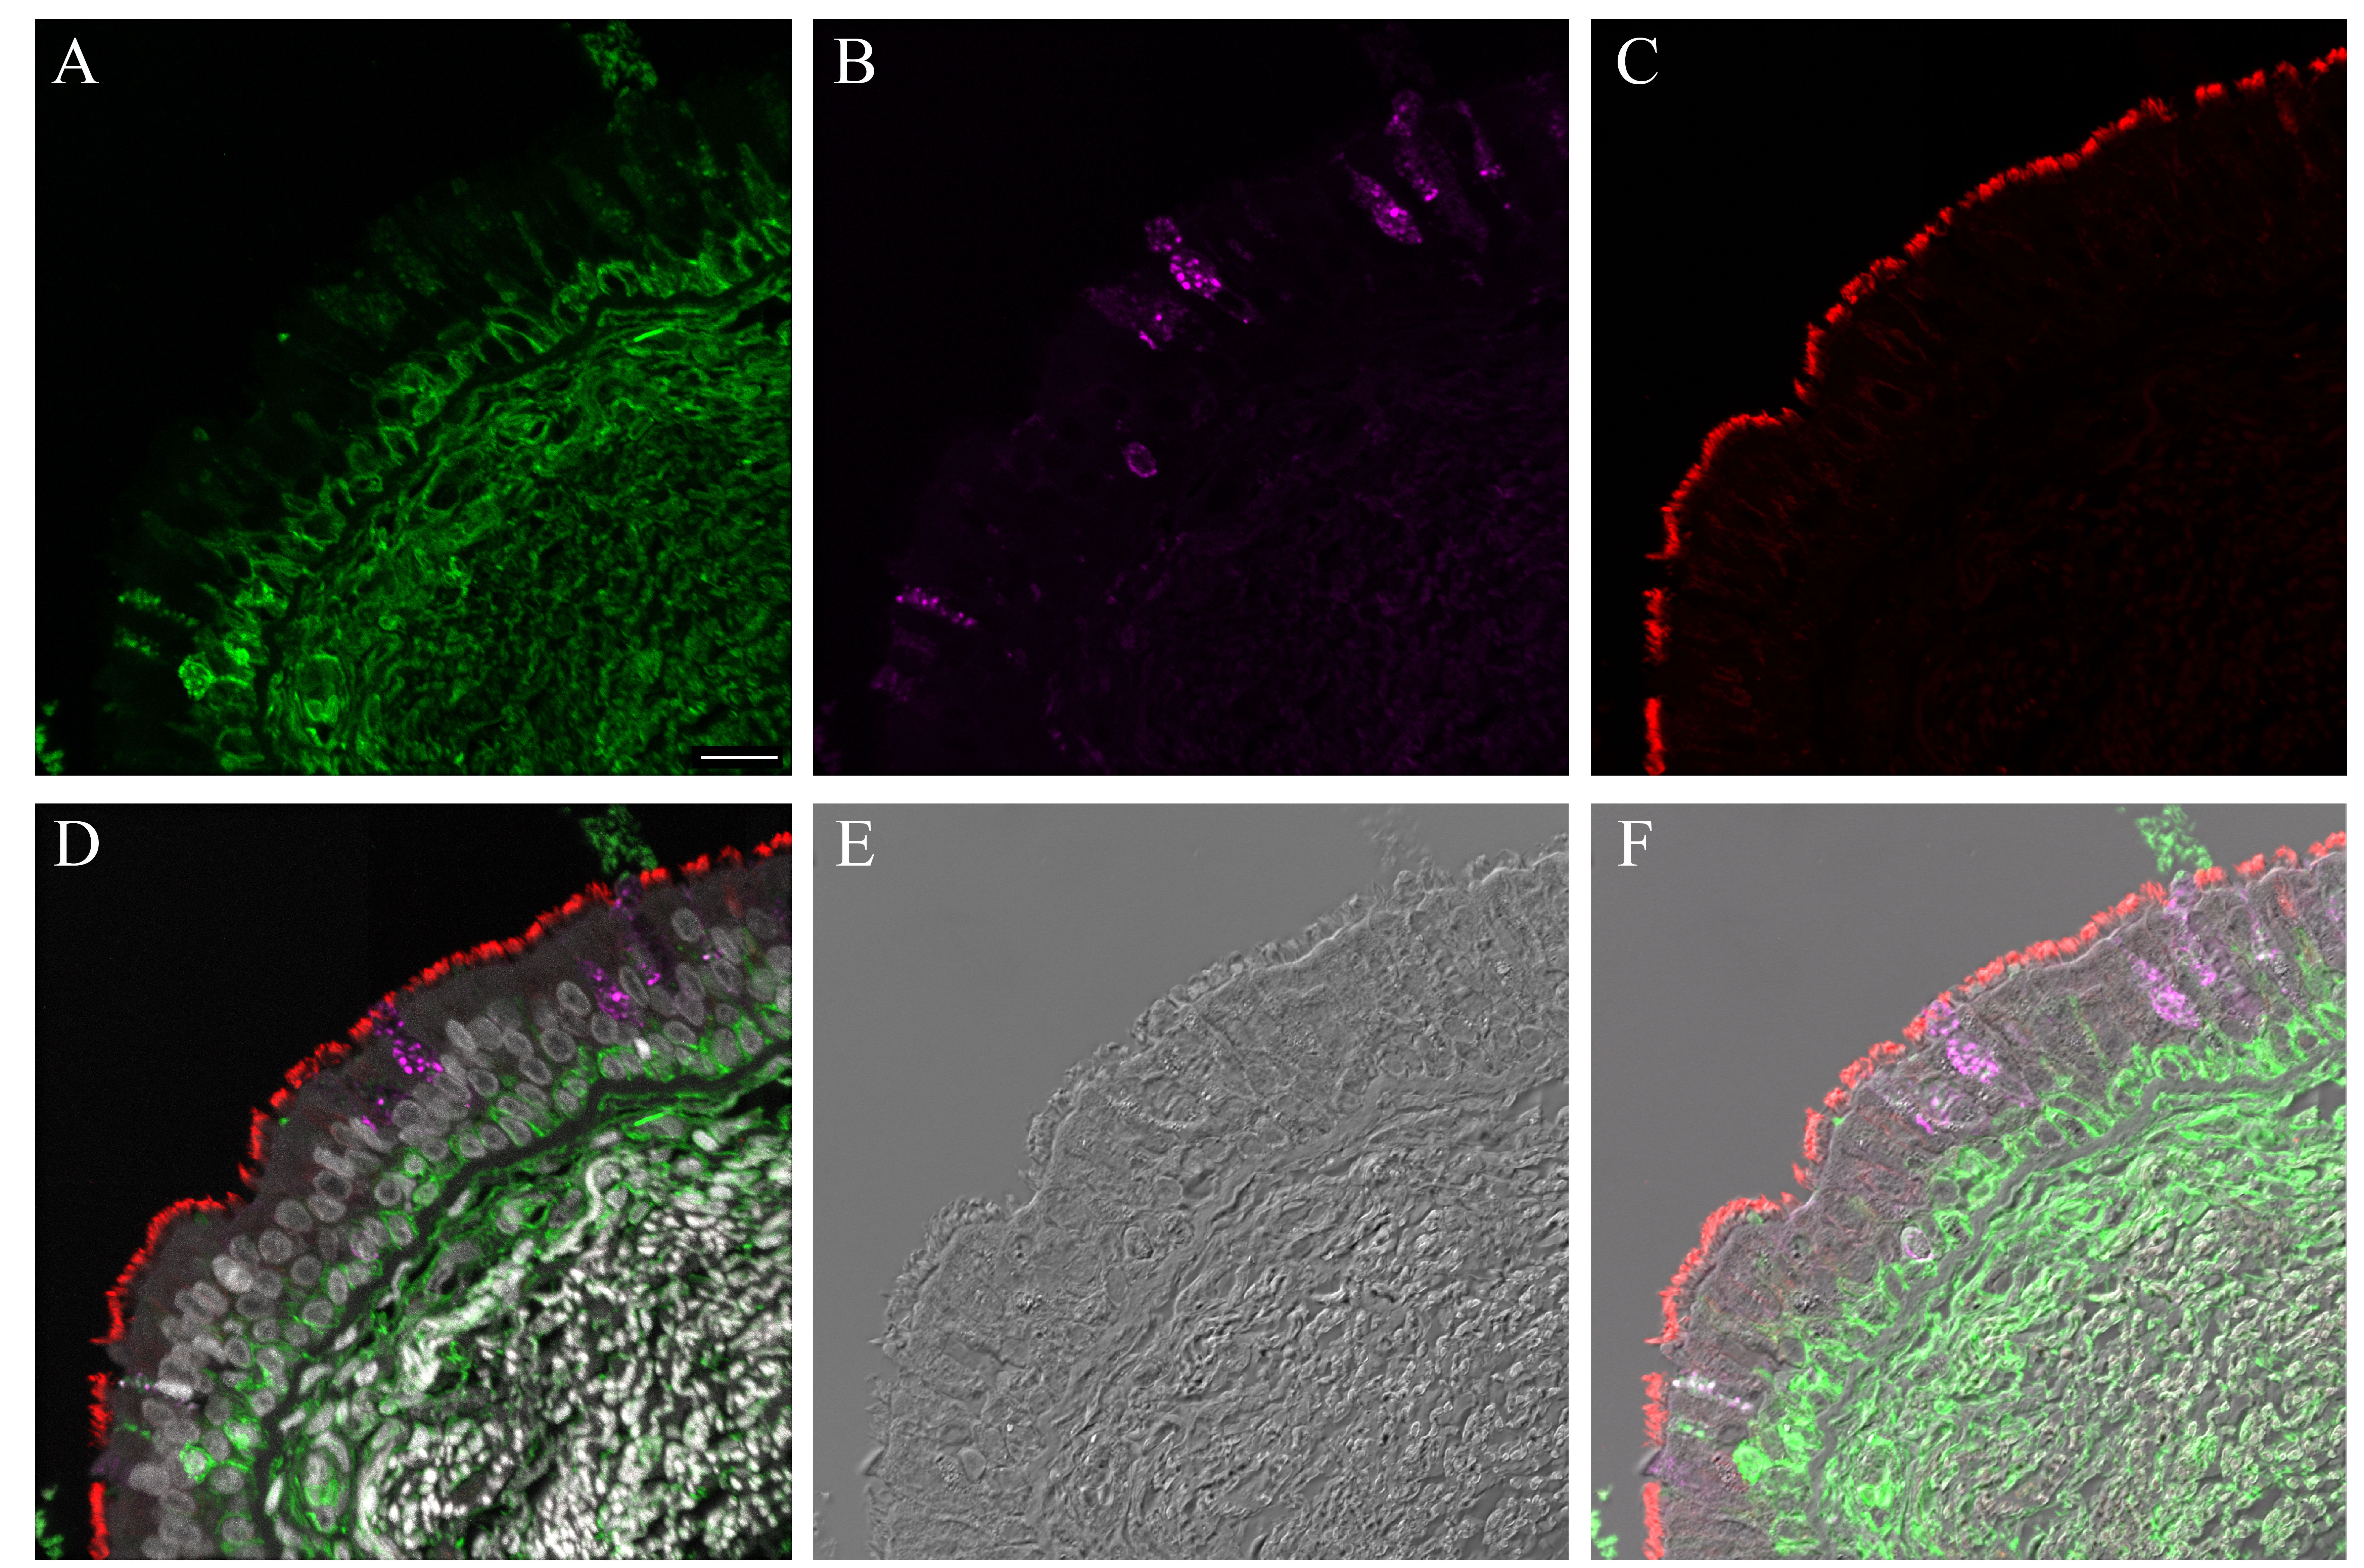
The binding pattern for bioconjugated influenza virus, NY312-AF594, to NHBEs was similar to that observed for the human respiratory tissues. The bioconjugated virus bound to the apical aspect of both ciliated and goblet cells as well as the goblet cell mucins exposed by sample sectioning (Fig. 4). Individual marker images, merges, DIC and fluorescence merges with DIC overlay images are shown in Supplemental Figures S17–S18. Pre-treatment of tissues with neuraminidase practically eliminated the NY312-AF594 that bound the NHBE cells and tissues (data not shown). Additionally, in order to confirm that SNA and the NY312-AF594 competed for the same receptors, we labeled NHBE cells and distal tracheal tissue with SNA and NY312-AF594 in the reverse order. We found that when the bioconjugated virus was bound first the level of SNA that bound second was less and vice versa (Fig. S19).
Figure 4.

NY312-AF594 binding of normal human bronchial epithelial (NHBE) cells and distal trachea. Leica SP8 confocal maximum projection images of full thickness z-stacks of immunofluorescence-labeled, formalin-fixed, paraffin-embedded cells and tissues. All imaging was done with a 40× oil objective at zoom 1.5, 2048×2048 pixels. (Row 1, A–C) NY312-AF594 bound to NHBE cells with apical cell markers. (Row 2, D–F) NY312-AF594 bound to human distal trachea with apical cell markers. Column 1 NY312-AF594 only, Column 2 cell type markers only, Column 3 merge. The pseudo-colors are NY312-AF594 (green), goblet cells (magenta), ciliated cells (red), and nuclei (gray). Yellow indicates co-localization between NY312-AF594 and the ciliated cell marker. White indicates co-localization between NY312-AF594 and the goblet cell marker. Scale, 10 µm.
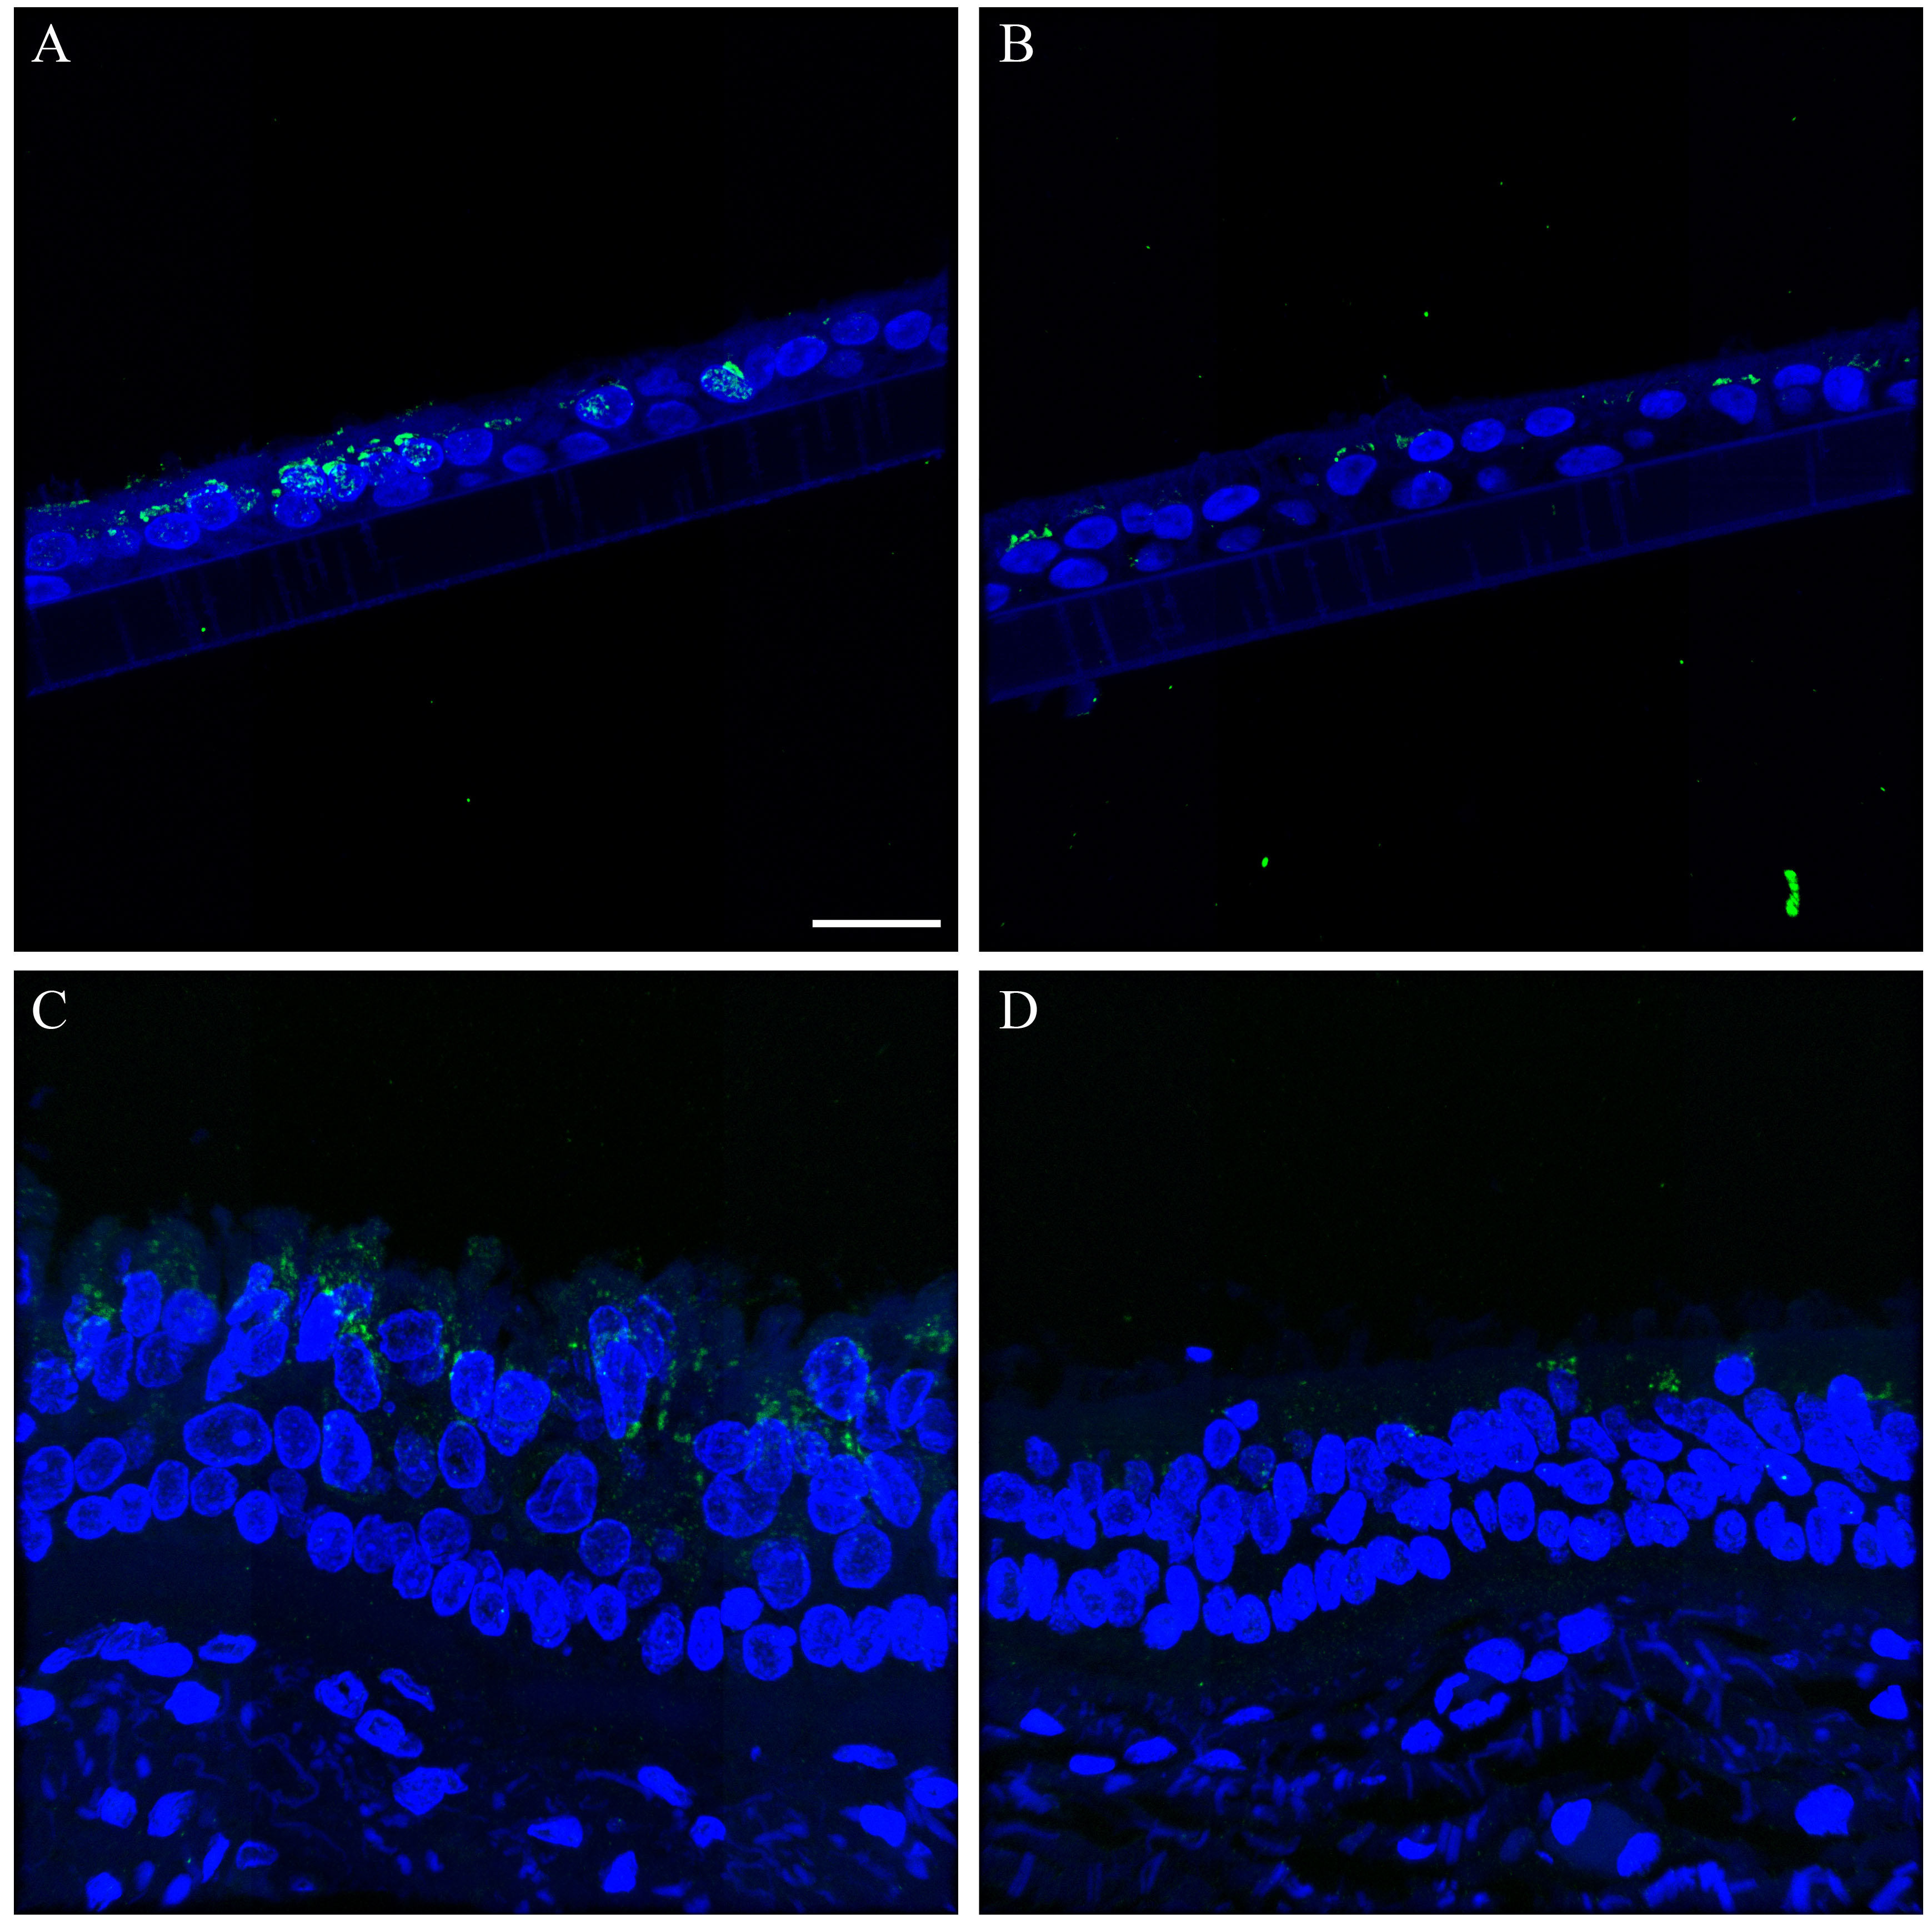
Comparison of Pandemic 2009 virus infections of NHBEs to 2009 Pandemic Autopsy Tissue
The histopathology of H&E-stained NHBE sections for the 4, 8, 24, 48, and 72-hr time-points was similar for the NY312 and CA04 infections. At 4 hr post-infection, the cells were still within the normal limits (data not shown). At 8 hr, multifocally, there was increased cytoplasmic vacuolation within the apical epithelial cells as well as increased paracellular lucency between the cells (Fig. 5A). At 24 hr post-infection, this paracellular lucency increased, and the apical surface of the epithelial layer became uneven, which we interpreted as cell loss (Fig. 5B). Occasional pyknotic nuclei as well as apoptotic cell bodies were also seen. At 48 hr, the NHBE epithelial layer height was markedly attenuated where it was still attached (Fig. 5C). This pattern increased by 72 hr, when fewer cells remained attached to the membrane (Fig. 5D). Detached cell clumps did not always have visible cytopathological changes. The replication kinetics showed that the virus titers for NY312 and CA04 were similar at matched time-points (Fig. 5E).
Figure 5.
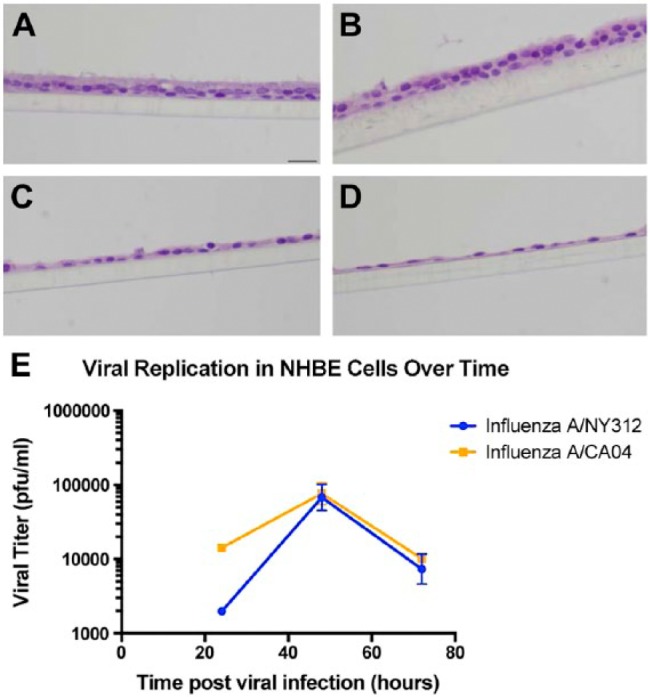
NY312 and CA04 NHBE infections. (A–D) Hematoxylin and eosin-stained sections of differentiated normal human bronchial epithelial (NHBE) cells infected with NY312 for (A) 8 hr, (B) 24 hr, (C) 48 hr and (D) 72 hr post-infection respectively. Scale, 20 µm. (E) The replications kinetics for NY312 and CA04 NHBE infections were similar. Each point represents the average across three technical replicates for a virus at one time-point post-infection; bars are the standard error.
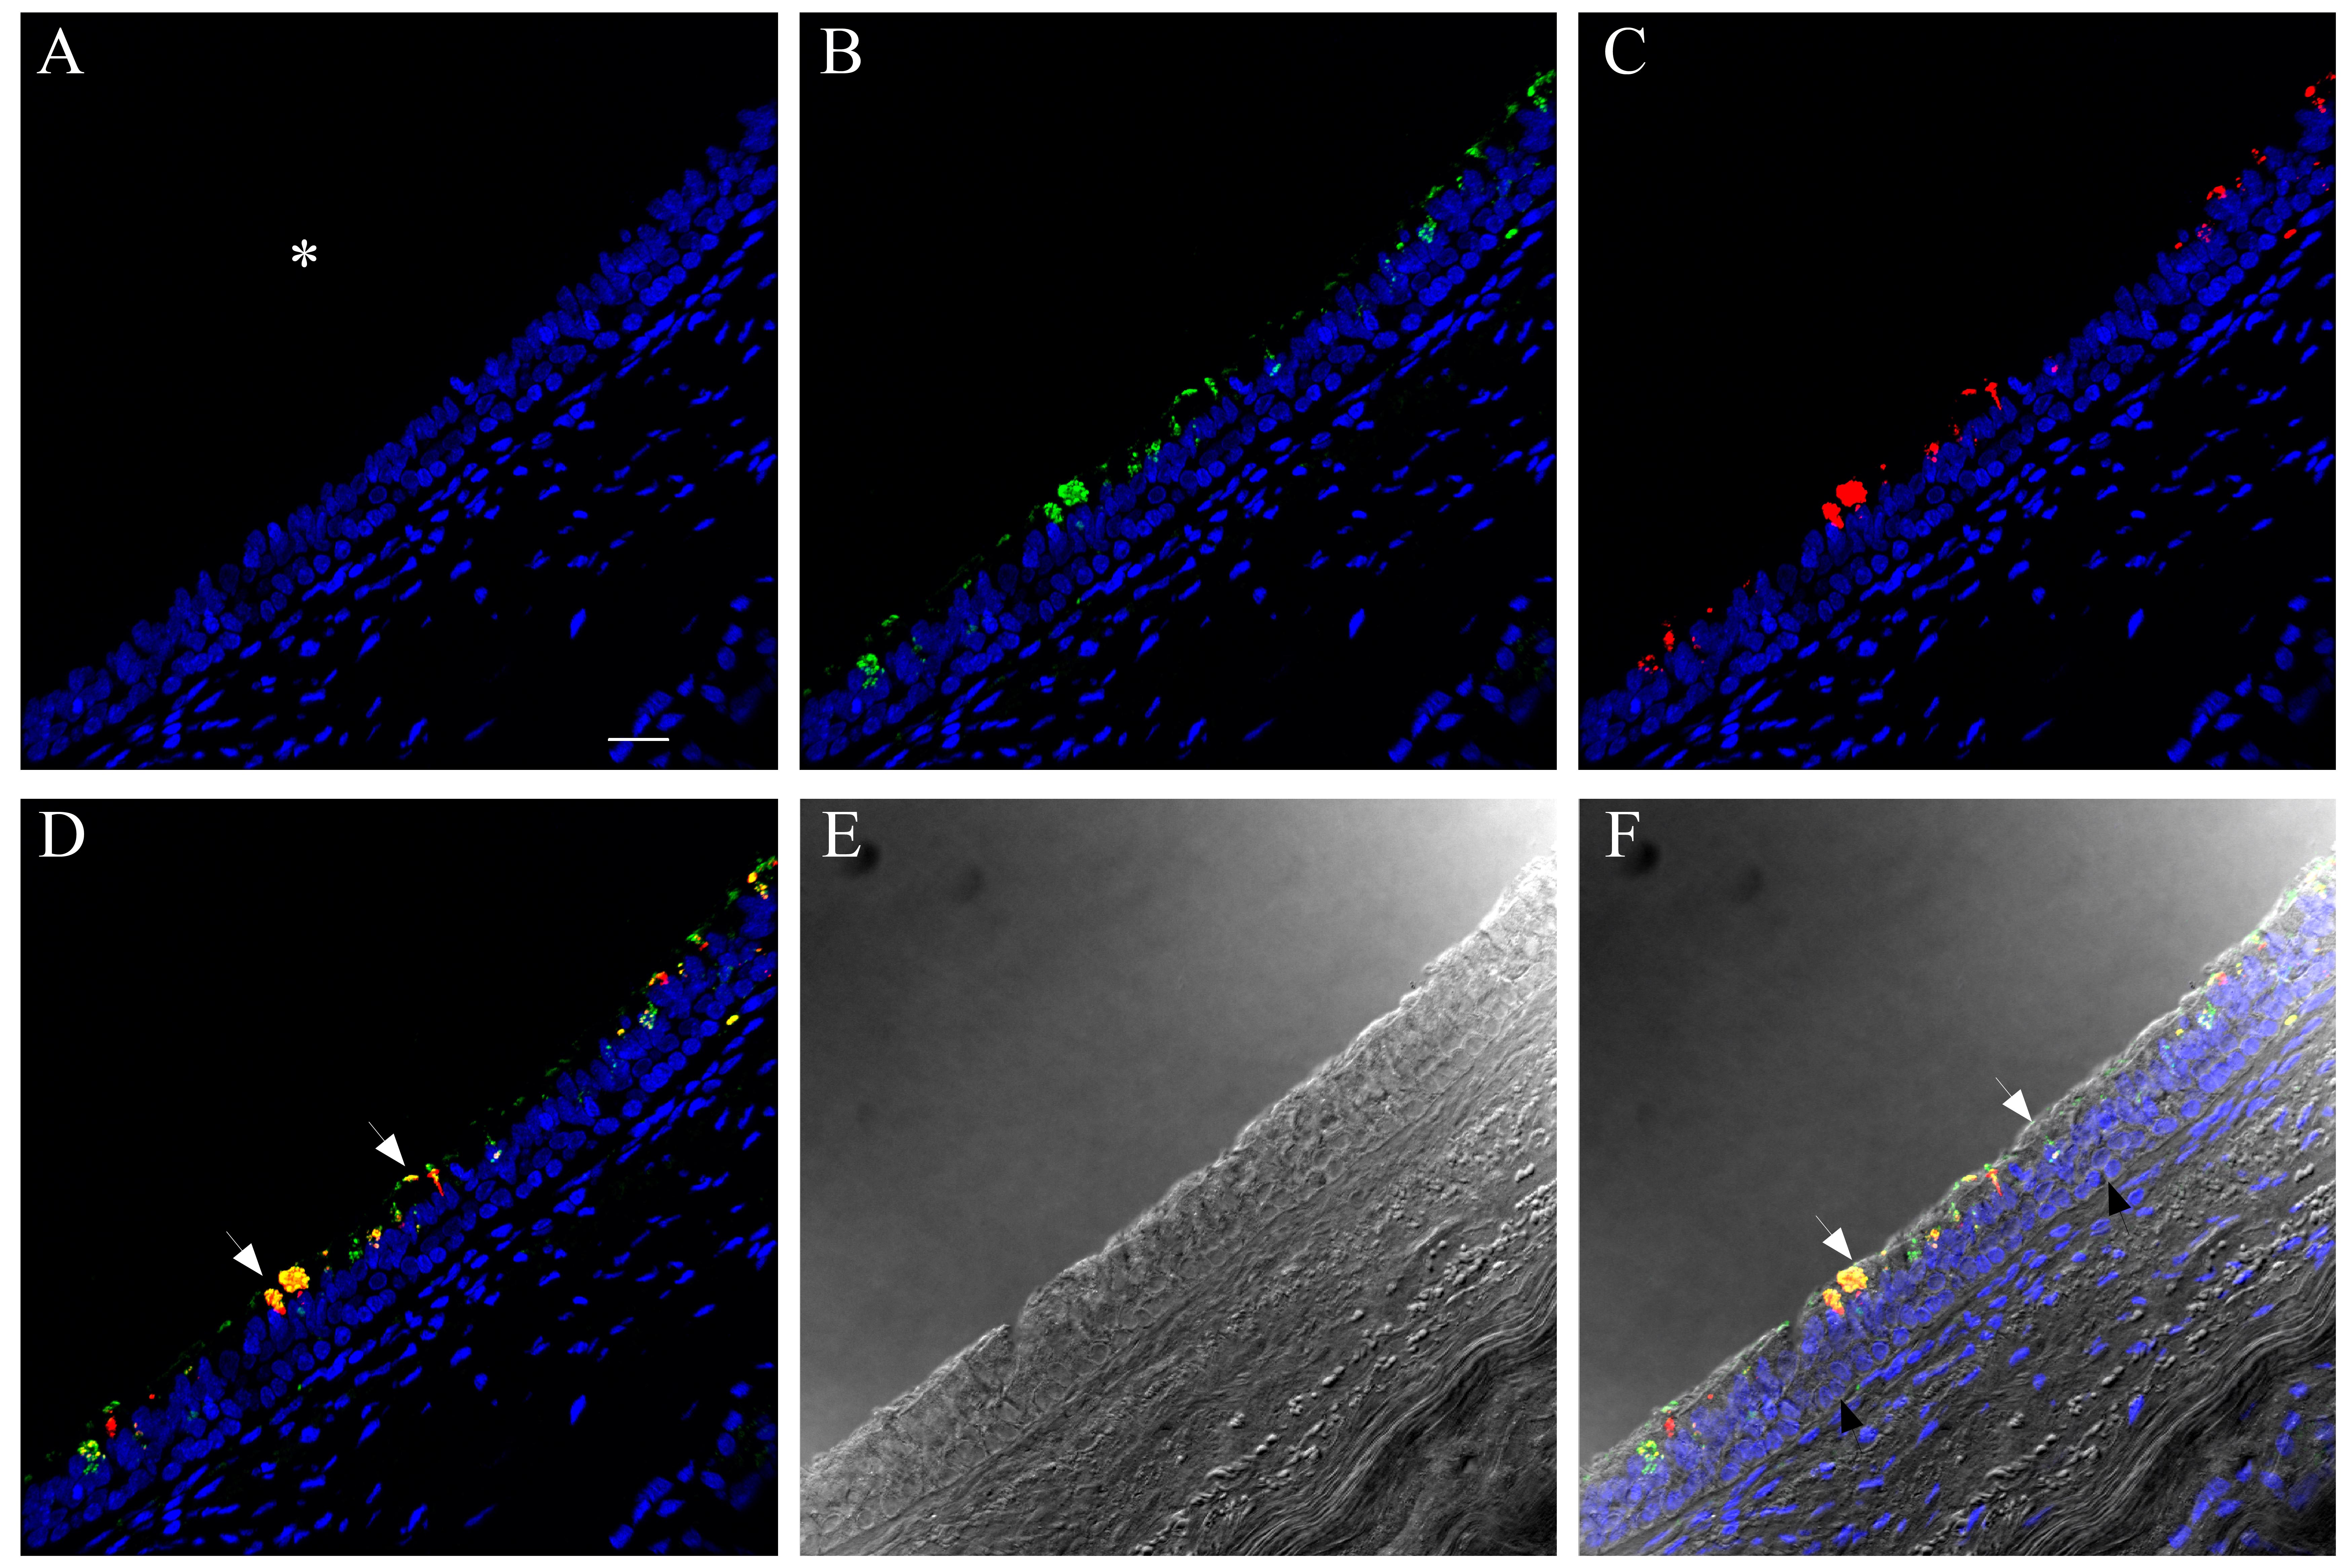
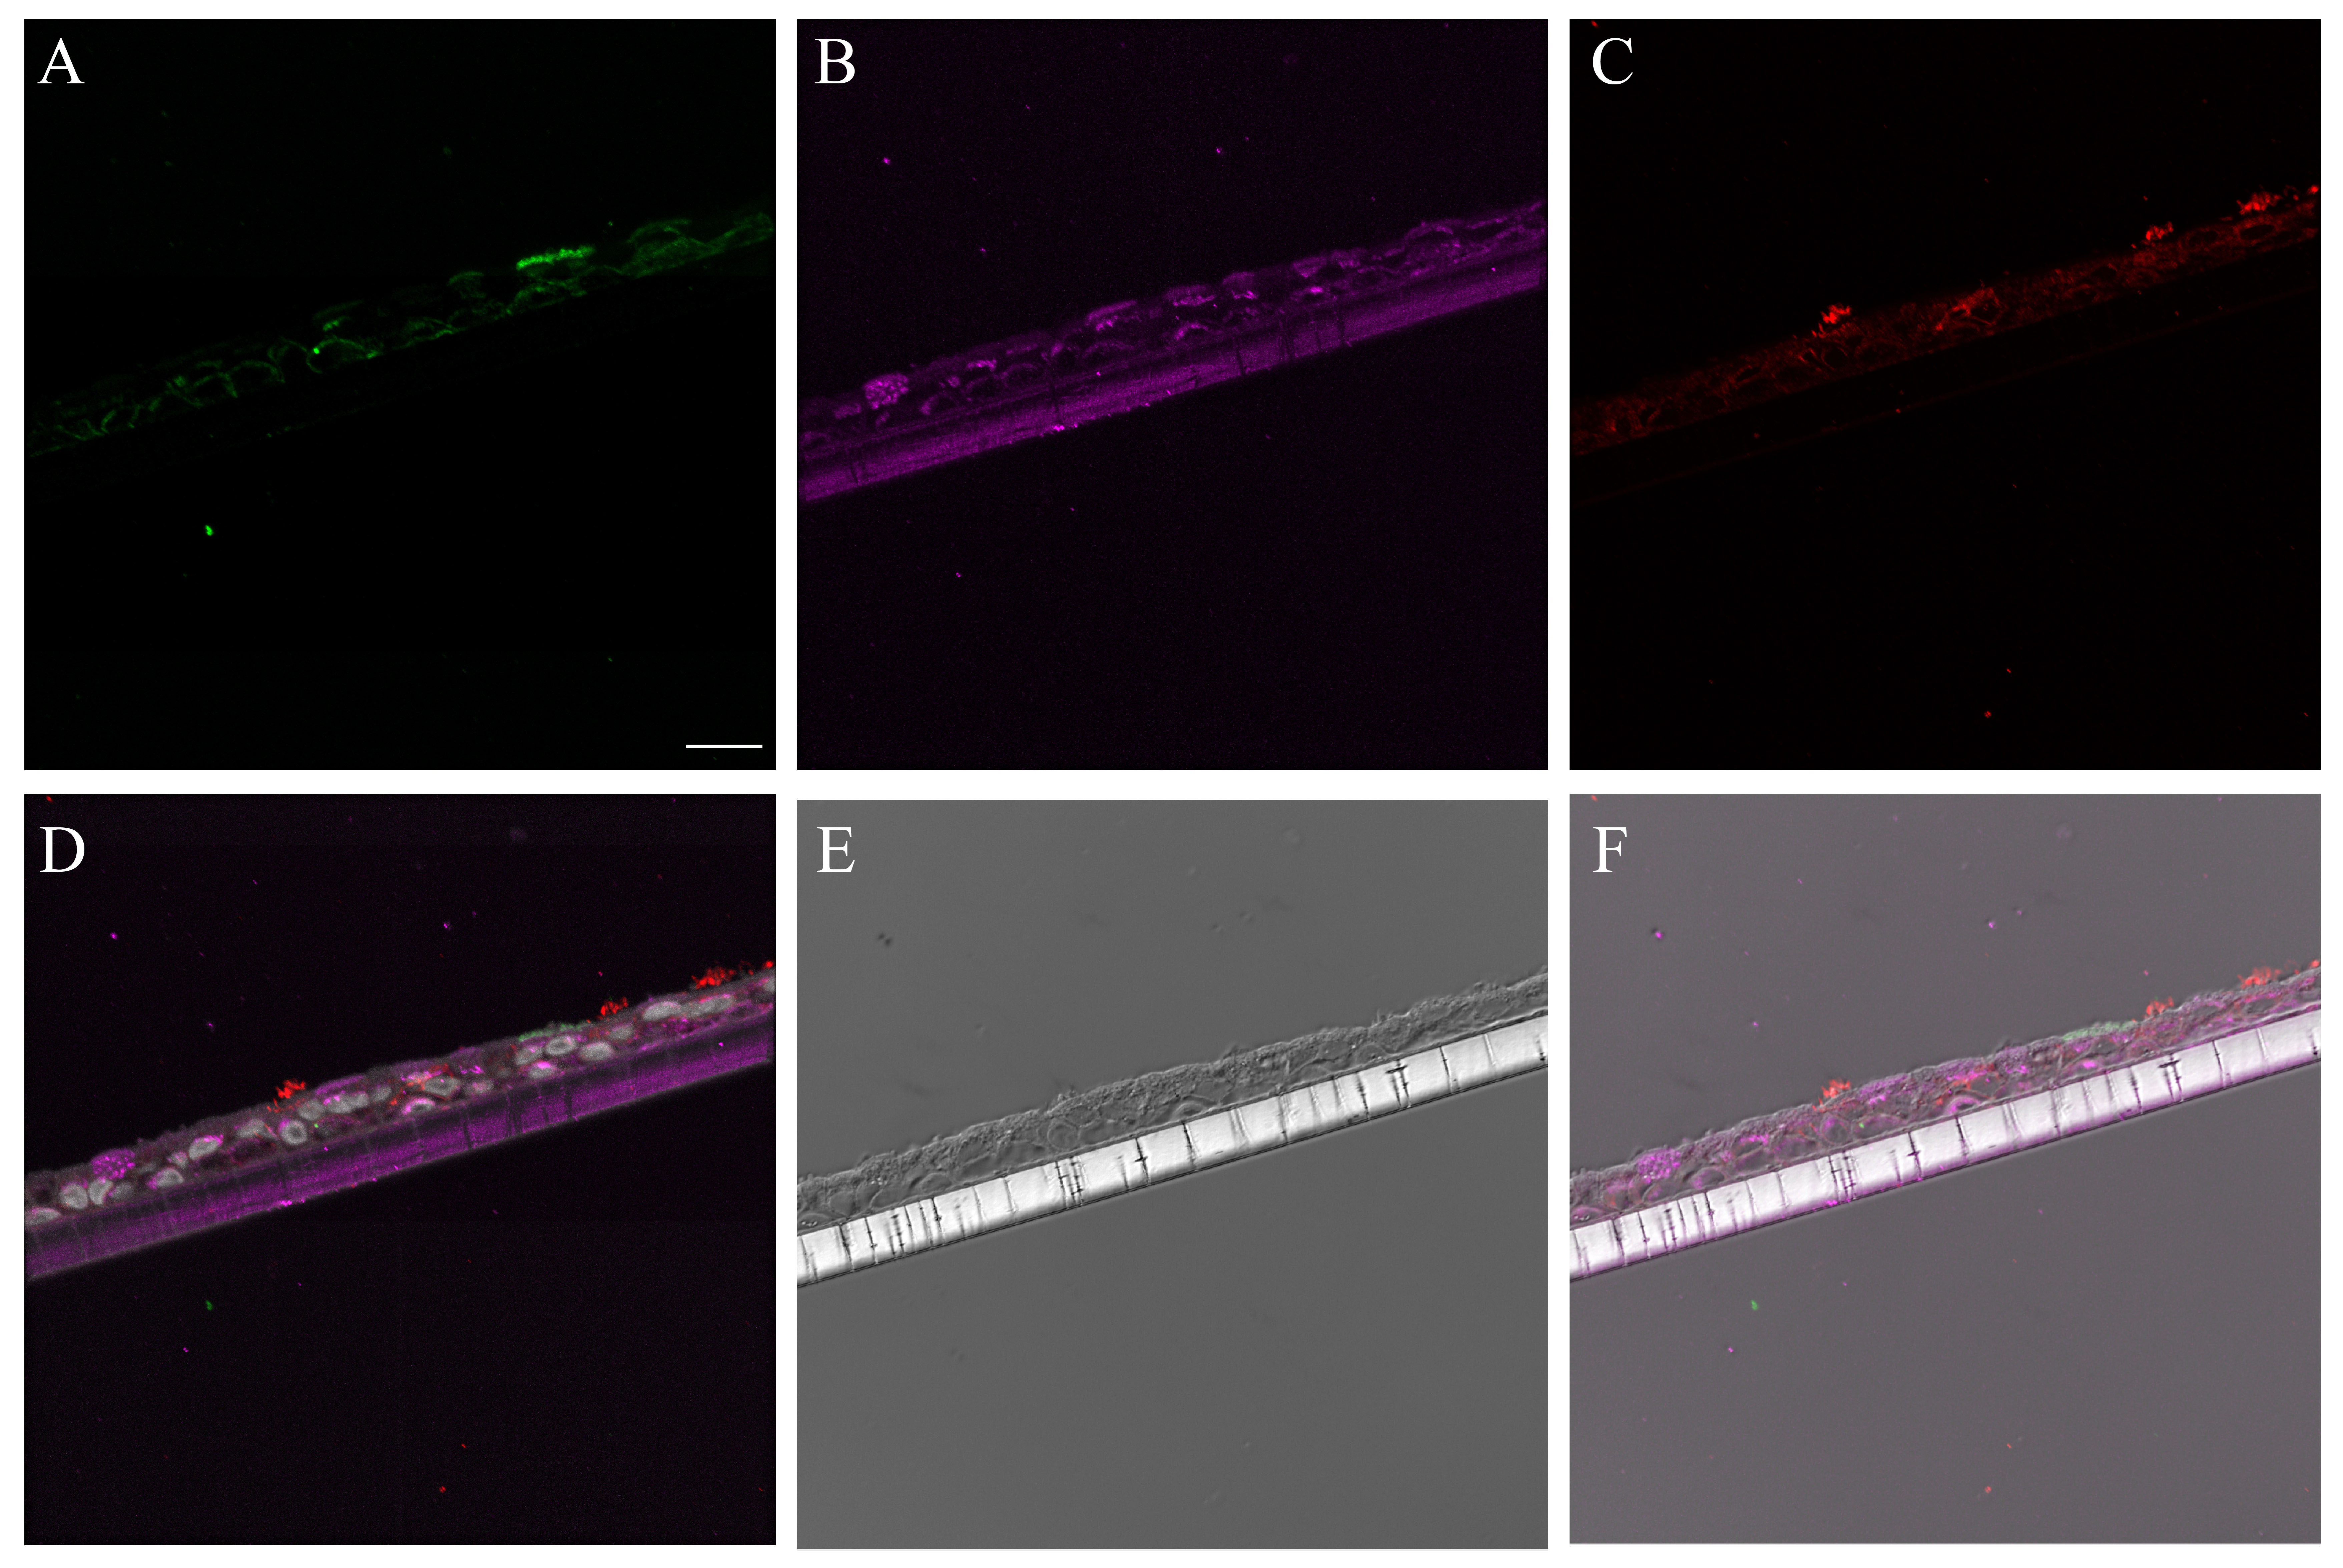
We also compared influenza antigen and cell type (ciliated, goblet and basal cell) co-localization at the 24- and 48-hr post-infection time-points for the CA04-infected NHBEs to human trachea from an autopsy case in which the patient died from an uncomplicated pandemic 2009 influenza infection (Gill et al. 2010). At the 24-hr post-infection time-point, influenza antigen-positive goblet and ciliated cells were observed (Figs. 6, S20). Both cytoplasmic and nuclear labeling was present. Due to a small amount of non-specific background labeling, not all of the cytoplasmic signal could be interpreted as influenza antigen (Fig. S21). A similar influenza antigen-labeling pattern was also present at the 48-hr post-infection time-point. However, by that time-point, labeling of NHBE basal cells for influenza antigen (including their nuclei) was seen. The basal cells in the autopsy tracheal tissue were rarely positive for influenza antigen (Figs. 6, S22). The 72-hr post-infection time-point NHBE cells could not be examined by immunofluorescence due to frequent cell loss from slides during protocols.
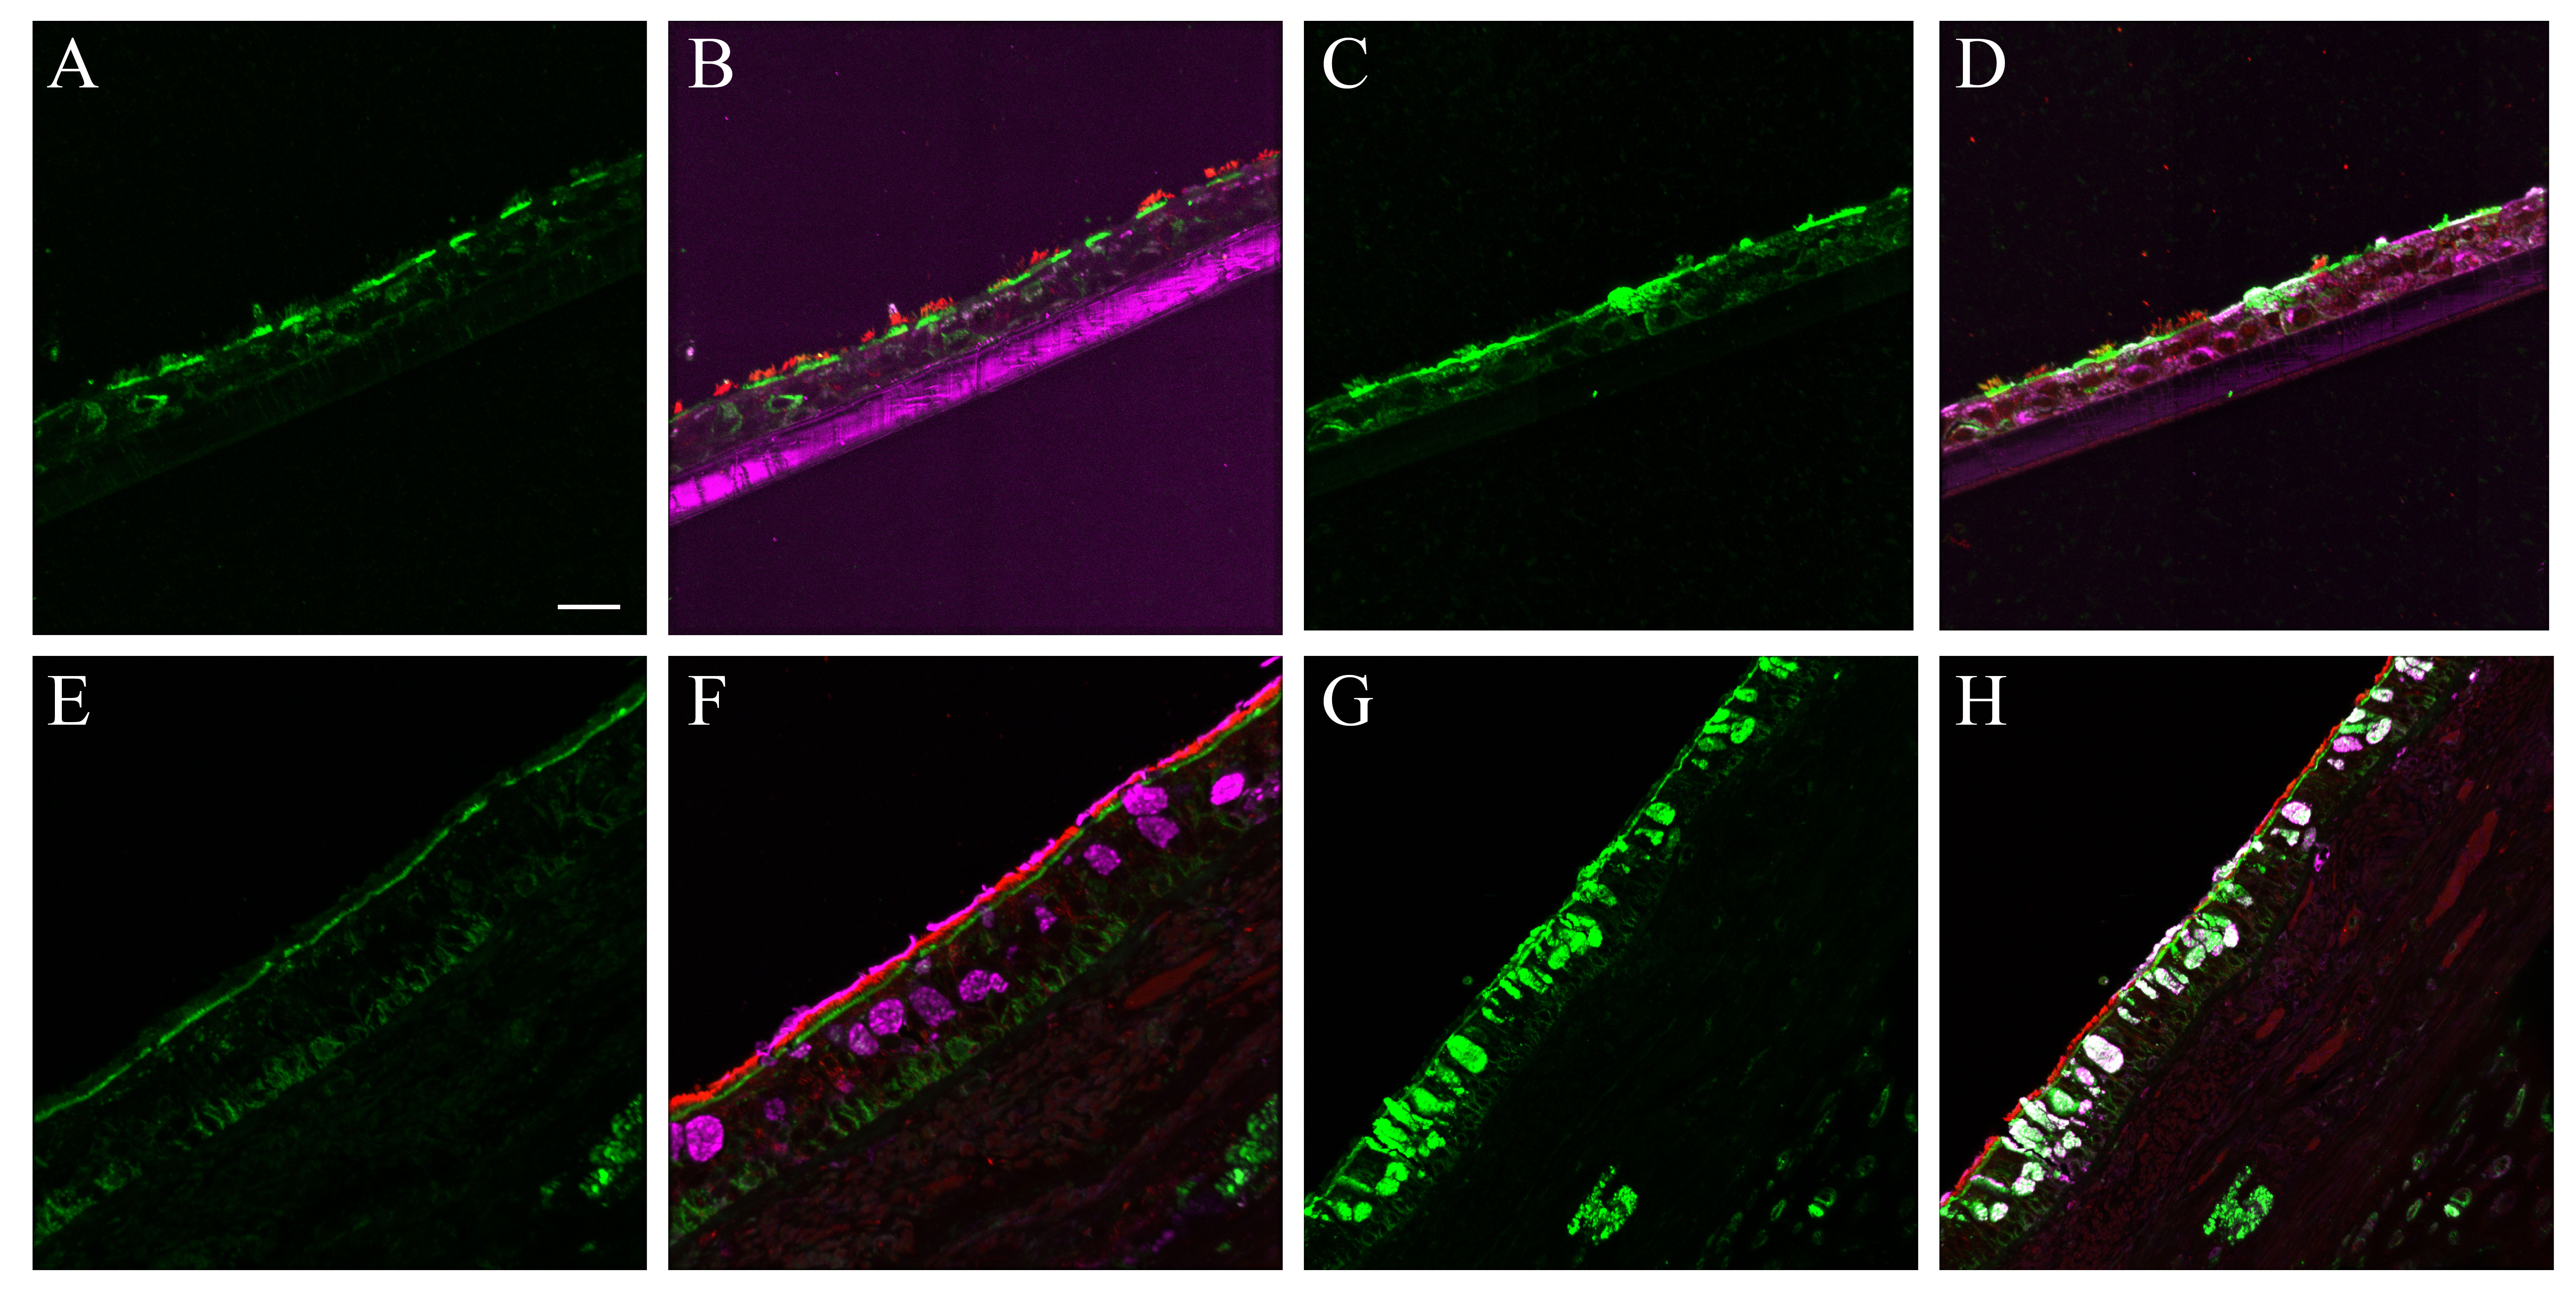
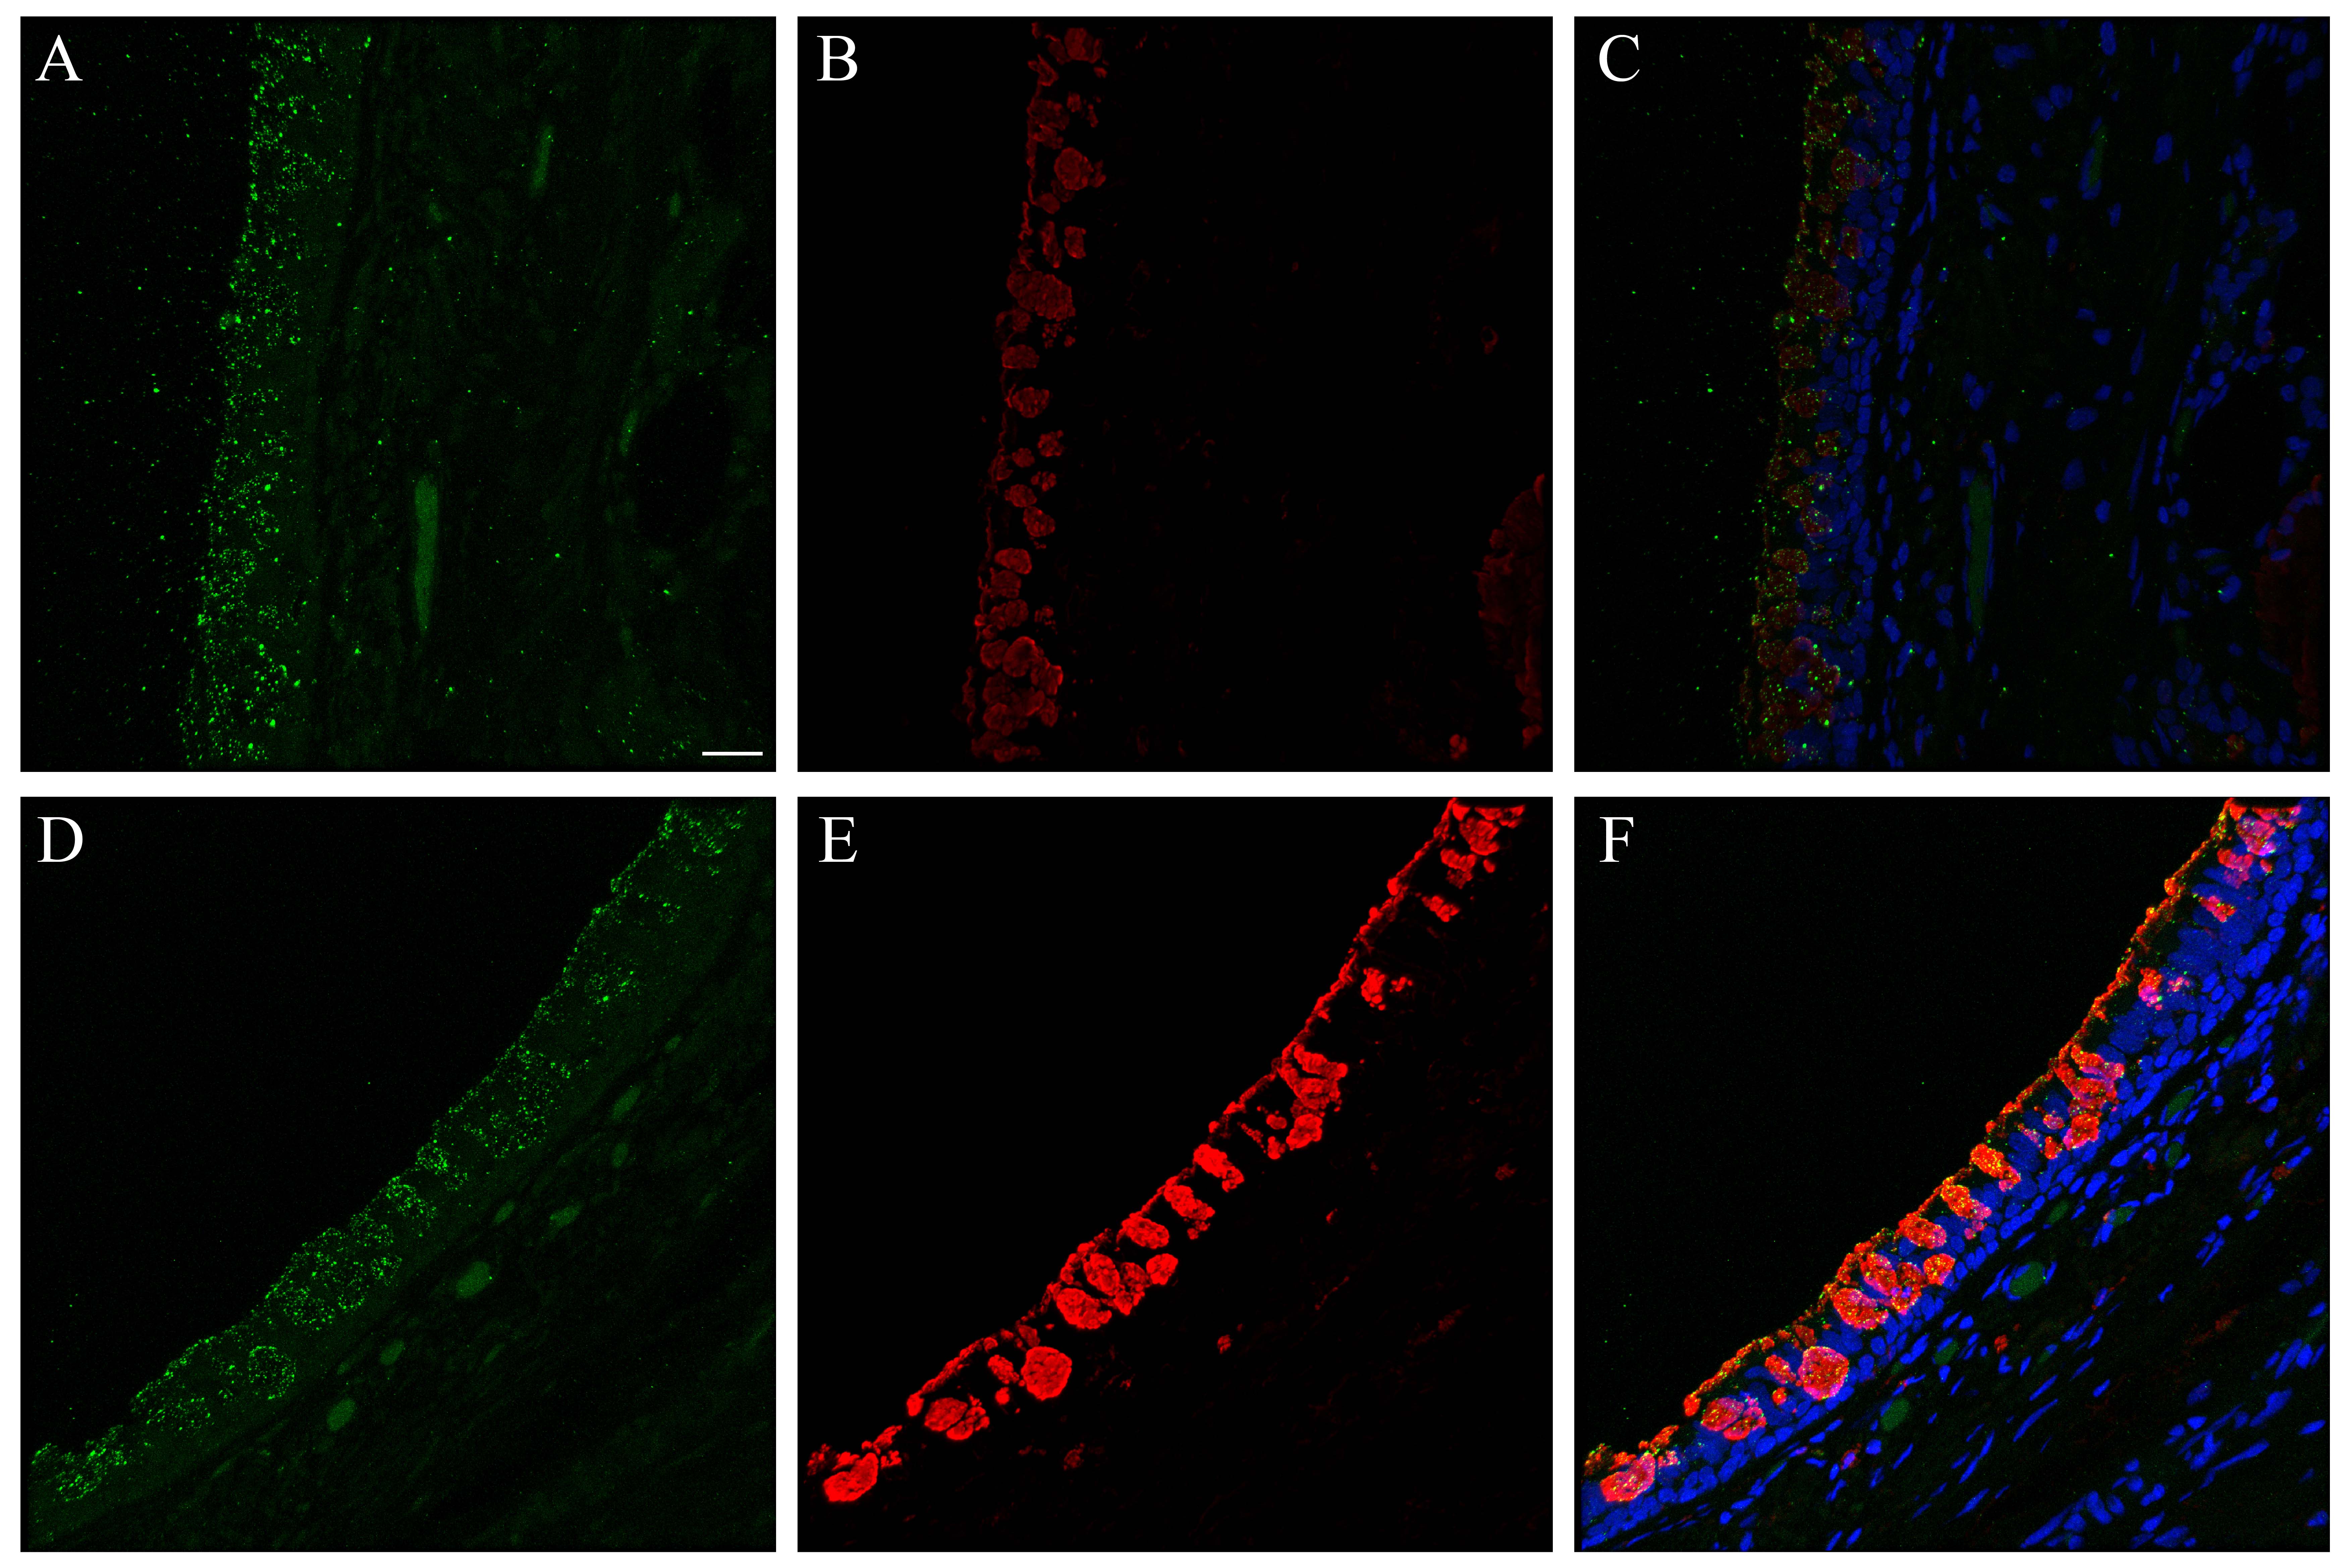
Figure 6.

Comparison of influenza antigen distribution by cell type. Pandemic 2009 influenza-infected normal human bronchial epithelial (NHBE) cells and human trachea. Leica SP8 laser confocal maximum projection images of full thickness z-stacks of immunofluorescence-labeled, formalin-fixed, paraffin-embedded NHBE cells and human trachea. All imaging was done with a 40× oil objective at zoom 1.5, 2048×2048 pixels. The pseudo-colors are influenza antigen (green), goblet cells (magenta), ciliated cells (red) and basal cells (blue). Yellow indicates co-localization between influenza antigen and the ciliated cell marker. White indicates co-localization between influenza antigen and the goblet cell marker. Cyan indicates co-localization between influenza antigen and the basal cell marker. (Row 1; A) Ca04-infected NHBE cell layer at 24 hr post-infection. (Row 1; B) Trachea from an autopsy of an individual who died from infection with a 2009 pandemic virus strain. (Row 2) Infected NHBE cells: (C) influenza antigen labeling only, followed by influenza antigen merged with ciliated, goblet and basal cell markers individually (D–F). (Row 3) Infected human trachea: (G) influenza antigen labeling only, followed by influenza antigen merged with ciliated, goblet and basal cell markers individually (H–I). Scale, 10 µm.
Discussion
Overall, the NHBE model is a useful in vitro option for modeling influenza A virus infections, particularly at early infection time-points. Since it is a primary cell line, differentiable into a pseudostratified epithelium, it facilitates close inspection of virus–epithelial cell interactions in three-dimensions. In this manner and because it is derived from normal, non-cancerous human cells, the NHBE model is a better choice than immortalized carcinoma-derived lung cell lines currently in wide use in influenza research, such as the human lung carcinoma cell line, A549. Our results show that the epithelial cell types and their distribution resembled that of source tissue samples with some differences. There was formation of a pseudostratified epithelium complete with apical tight junctional collar formation. Influenza A viral receptor lectin distribution patterns fairly closely resembled those of source tissue, and the interaction with influenza virus was similar. However, our observations raised concerns regarding the integrity of NHBE systems at later time-points in infection studies with pathogenic viruses. These issues appear to be due to differences in the basal aspects of the NHBE pseudostratified epithelial architecture. Future work should examine methods of strengthening the paracellular interactions and basal attachment of NHBE cells so that they can more closely model infections at later time-points. Such in vitro system enhancement might also encourage fuller development of the pseudostratified epithelium, seen as both increases in height and ciliated surface density.
Mature trachea and carina epithelium contained neuroendocrine cells as well as occasional CD68-positive cells, interpreted as macrophages and dendritic cells. Our NHBE microarray data analysis results were generally consistent with an absence of both neuroendocrine cells and professional immune cells, specifically macrophages and dendritic cells, in the differentiated NHBE sample analyzed. The presence of ENO2 expression was surprising, since it is associated specifically with neuron/neuroendocrine tissues (Ho et al. 2010), and thus, we could not rule out the presence of neuroendocrine progenitor cells. However, the absence of CHGA, SYP and NCAM1 transcripts in our microarray data, the lack of pyramidal-shaped cells morphologically consistent with mature neuroendocrine cells, and the negative immunofluorescence staining for chromagranin A all suggest that mature neuroendocrine cells were absent. Additionally, we saw no dendritic cells or macrophages. Confirmation of the absence of these cell types is significant to downstream cytokine analysis of interest in influenza experimental studies focused on host responses to infection. Our findings were also consistent with the morphological reviews of these cells by LONZA during their quality control process (vendor communication). An extensive flow cytometric analysis of NHBE cells might reveal further information.
Because we had previously observed an up-regulation in genes that localize to club (Clara) cells—specifically, multiple secretoglobins (club cell secretory proteins) and CYP2B6 (a member of the cytochrome p450 family) in the differentiated NHBEs when compared to the undifferentiated ones—we conducted further investigations seeking club cells in the differentiated NHBEs (Hukkanen et al. 2002; Martinez-Anton et al. 2013; Mori et al. 1996; Wong et al. 2009). Our immunofluorescence for anti-CC10 was consistently negative on our FFPE differentiated NHBE cells and human distal trachea samples. In contrast, FFPE human lung tissue consistently demonstrated the presence of positive cells. Histologically, we observed no cells that were morphologically consistent with club cells (non-ciliated, dome-shaped but non-mucin-producing) (Pack et al. 1981). Using TEM, we saw variation in the intracytoplasmic granule morphology and cytoplasmic electron lucency of non-ciliated cells (Fig. 2E). Club cell secretory granules reportedly contain abundant endoplasmic reticulum and are smaller in number and size than those of mucous cells (Bedetti et al. 1987; Gruenert et al. 1995). We found no cells that were clear, morphological matches. The occasional non-ciliated morphologically divergent cells may have been less common “brush cells,” cholinergic chemosensory cells, pre-ciliated or other less well-defined cell types (Brand-Saberi and Schafer 2014). Immunoelectron microscopy techniques might provide further clarity. Therefore, whereas the transcripts for multiple club cell-related proteins were present, protein products were not detectable by immunofluorescence assay and morphological support was lacking. Perhaps our cell culture microenvironment failed to support full differentiation of club cells. Regardless, we show that NHBEs are consistent with their source tissue because club cells are rarely found above the level of the terminal bronchioles in humans and are absent in their bronchi (Boers et al. 1999).
Jacalin, Artocarpus integrifolia lectin, is isolated from jackfruit seeds and is specific for O-glycosidically linked oligosaccharides (Lee et al. 2013). Previously, it has been used to identify goblet cells in both NHBE cells and tracheal tissue, where we and others have shown it to label equivalently to Muc5Ac in these cells (Fig. S1) (Chandrasekaran et al. 2008; Martinez-Anton et al. 2013; Vermeer et al. 2003). In our hands, CK5 consistently labeled all cells at the basal aspect of the NHBE epithelium that have a round, non-apical cell morphology and are also CK8 negative, consistent with a basal cell (data not shown). Together, the markers we chose for goblet, ciliated and basal cells worked well in combination with lectins, other antibodies of interest and viruses, enabling the localization of each cell type.
As in our previous study (Martinez-Anton et al. 2013), we found that NHBE cells formed a pseudostratified epithelium by day 28 post-confluence. Here, we determined that NHBE epithelial height was on average significantly shorter than that of the distal trachea and carina tissues (Fig. S6). Additionally, the lawn of the cilia produced by NHBE ciliated cells failed to cover the apical aspect of the epithelium, as it consistently does in well-preserved source tissue sections (Fig. 1). Whether this is due to failure of the pseudostratified epithelium to fully develop or greater development of the goblet cells with respect to that of the ciliated cells is open to debate. However, the shorter NHBE epithelium height, decreased cilia density overall, and presence of a larger apical surface area of goblet cells, appreciable by both LM and EM, suggests the former (Figs. S6, 1, 2A–2C, 2E–2F) (Arenberg 1972; Menscher 2013; Roessler et al. 1991). Our findings also correlate with microarray evidence that ciliated cell density is reduced in air-liquid cultures such as that of the NHBE system as compared with the large airway bronchoscopy brushings of healthy non-smokers (Dvorak et al. 2011). Bronchoscopy brushing epithelial cells differ from NHBE cells in that they have not undergone a de-differentiation and re-differentiation process and they are sourced from living humans rather than cadavers. Brushing cells more closely correlate with their source tissue, whereas primary cell lines often lose flexibility, such as the ability to form new pseudostratifed epithelia from frozen, reconstituted cells. NHBE cilia appeared to be morphologically normal in size and structure on EM but were subjectively less dense in number per cell (Fig. 2E–2H). Cilia density variances might be assessed further in a study wherein the microenvironment is manipulated in order to enhance further development of the pseudostratified epithelium.
The apical tight junctional collar of the NHBE epithelium resembled that of the source tissue (Fig. 2G–2H), including the presence of desmosomes, as seen previously (Chopra et al. 1987). This validates the measurement of resistance during manipulation of NHBE cells to determine when the cell layer is compromised (LeSimple et al. 2010).
Our findings were most divergent from that of source tissue at the basal aspect of the NHBE epithelia. Compared with source tissue samples, in H&E slides of the NHBEs, we observed increased lucency between basal cells and the basal aspects of apical cells, both goblet and ciliated. Using TEM, the differences in the spacing of these paracellular interactions were more apparent, with an obvious increase in clear space between cells. Paracellular contact between cells was less common in the NHBE samples as compared with that of the source tissue samples (Fig. 2I–2J). We observed the usual basal lamina formation and hemidesmosomal (fibrillar adhesion) attachment of the carina and distal tracheal epithelium to the submucosa. In contrast, inspection of the same location in the NHBE cultures revealed little to no attachment for the NHBE cells. TEM analysis also showed no evidence of the rat-tail collagen that had been applied to the membranes. Our immunofluorescence labeling for anti-collagen I on NHBE samples was also negative. Interestingly, the lamellipodia of the NHBE cells were frequently observed inside membrane pores (Fig. 2I). These findings demonstrated that, at a minimum, the basal plasma membranes of some NHBE cells were forming focal complexes with extracellular matrix or membrane substance (Berrier and Yamada, 2007; Hermann et al. 2014).
As evidenced in this study (Fig. 5) and various others (Brookes et al. 2011; Chan et al. 2010; Ilyushina et al. 2012a; Ilyushina et al. 2008; Ilyushina et al. 2012b; Mok et al. 2011; Oshansky et al. 2011; Scull et al. 2009; Song et al. 2009; Steel et al. 2008; Suksatu et al. 2009; Triana-Baltzer et al. 2010), NHBE cells support human influenza A infections. Early stages of NHBE infections closely paralleled the infection pattern seen in autopsy material (Fig. 6). However, at later infection time-points, NHBE cell loss was rapid, and these detached cells lacked the morphological cell changes consistent with cell damage or death. Our observations regarding the minimal basilar attachment of differentiated NHBE epithelia may explain the presence of otherwise normal looking detached individual cells and clumps of cells intermixed with obviously affected cells that showed signs of reversible cell damage and cell death.
Limitations in epithelial integrity attributable to their in vitro microenvironment would therefore be of concern when cell layer loss is used as a metric in a study. If NHBE cells were more firmly attached, they might have recovered from infection. A closer examination of these later infection time-points will likely reveal that cell loss is due to both infection and the stability of epithelial adhesion to the membrane. Separation of influenza A virulence-associated changes in epithelial cell adhesion from in vitro system-associated limitations might provide a better understanding of focal complex and focal adhesion formation in the NHBE system (Berrier and Yamada, 2007). Similar work assessing the role of Staphylococcus aureus hemolysin A in primary and immortalized human airway epithelia revealed that hemolysin A induces alterations in cell shape, causes the formation of paracellular gaps, and prevents maturation of focal complexes into focal adhesions (Hermann et al. 2014). Perhaps research progress in human skin equivalents, wherein pro-collagen type 1 secretion by human fibroblasts co-cultured with epithelial cells outperforms rat-tail collagen-based systems, might inform ways to improve the NHBE system (El Ghalbzouri et al. 2009; Kamolz et al. 2005). A co-culture system of NHBEs with normal human lung fibroblasts was previously used to examine basal cell and subepithelial matrix homeostasis (Thompson et al. 2006b). Alternatively, changing the preparation of the membranes might encourage better adhesion of the NHBE cells, thus attaining greater epithelial height and further cellular differentiation, particularly of the ciliated cells.
We examined our tissues and cells for α2,3 linkage N-acetylneuraminic (sialic) acids with Maackia amurensis and, for α2,6 linkages with Sambucus nigra (SNA) (Chan et al. 2013; Nicholls et al. 2007). Maackia amurensis leukoagglutinin (MAA I or MAL) preferably binds Siaα2-3Galβ1-4GlcNAc in N-linked or core 2 O-linked sialic acids as well as unsialylated glycan, SO4-3-Galβ1-4GlcNAc (Geisler and Jarvis 2011). Maackia amurensis hemagglutinin (MAA II and MAH) preferably binds Siaα2-3Galβ1-3(+Siaα2-6)GalNAc in O-linked sialic acids as well as SO4-3-Galβ1-4GlcNAc (Geisler and Jarvis 2011). Data from the Consortium for Functional Glycomics (http://www.functionalglycomics.org/)—corresponding to the binding of these lectins to defined glycan arrays—confirmed these binding specificities and, additionally, revealed that MAA I can bind α2,8 linkage N-acetylneuraminic (Sialic) acids and that MAA II can bind all structures containing SO4-3-Galβ (Geisler and Jarvis 2011). Therefore, we avoided using Maackia amurensis lectins from vendors where these two isoforms are mixed together in undefined ratios. We also selected an NA that is purportedly efficacious at removing α2,3, α2,6, and α2,8 linkage N-acetylneuraminic (Sialic) acids. In retrospect, the additional use of an α2,3-specific sialidase may have eased our data interpretation. However, NA from Clostridium perfringens cleaves α2,3 sialic acids most efficiently.
Our findings were similar to those of others in that the NHBE cells, trachea and carina were labeled predominantly with SNA and MAA I, and rarely with MAA II (Figs. 3, S16) (Chan et al. 2013). We attributed the post-NA treatment MAA I signal to the non-sialic acid moieties to which this lectin also binds (Fig. S16) (Geisler and Jarvis 2011; Nicholls et al. 2007). However, we were surprised by the overall signal intensity increase after NA treatment. Prior lectin blotting work has shown a reduction in MAA I and elimination of MAA II signals after α2,3 sialidase treatment (Geisler and Jarvis 2011). Perhaps the action of the NA resulted in direct exposure of additional Galβ1-4GlcNAc, which is a secondary target of MAA I but not MAA II (Geisler and Jarvis 2011). We also concluded that our targets were not SO4-3-Galβ1-4GlcNAc-rich, due to the lack of post-NA treatment binding of MAA II. In summary, both our cells and tissues displayed predominantly α2,6 linkage sialic acids.
Only signal present at the apical aspect of an epithelial cell with a luminal presence represents a sialic acid that might function as an influenza receptor. Therefore, we discounted signals that were internalized in the cells or from cells lacking contact with the lumen. Reports in the literature for sialic acid distribution by cell type in NHBE cells vary. They include α2,3 linkage primarily expressed on ciliated cells (Matrosovich et al. 2004); α2,6 on both ciliated and goblet cells, in the absence of α2,3 O-linkage sialic acids (Chan et al. 2010; Ibricevic et al. 2006); and dual expression of both linkage types on individual cells (Kogure et al. 2006). Our co-labeling with sialic acid receptor lectins and apical epithelial cell type markers revealed that there was rare labeling of NHBE goblet cells with MAA II, contrary to the sparse labeling of ciliated cells previously reported with this lectin (Figs. 3, S12) (Chan et al. 2010). This co-localization of Jacalin with MAA II correlates well with the affinity of both lectins for O-linked glycans. MAA I predominantly labeled ciliated cells (Fig. S16), whereas SNA labeled both goblet and ciliated cells (Figs. 3 and S8). The use of Concanavalin, a lectin with affinity for N-linked glycans, might act as a confirmatory step in future work (de Graaf and Fouchier 2014).
We found that our trachea and carina samples either rarely labeled positively with MAA II (Figs. S14, S15) or it labeled low numbers of goblet cells as well as cross sections of some goblet cells (Fig. S13). The latter is consistent with mucus being α2,3 sialic acid-rich, as previously reported (Baum and Paulson 1990). Interestingly, the first trachea sample also had some mucus globules that were strongly SNA positive (Fig. S9). SNA labeling otherwise matched that seen for the NHBE cells (Fig. S9–S11). MAA I labeling of the trachea was faint but relatively widespread across both cell types (Fig. S16). We hypothesize that perhaps this correlates with a residual mucus layer. We attributed differences in the two human donor’s tissues’ receptor lectin labeling to individual variation between healthy subjects. A study that included a larger number of human samples from a greater area of the respiratory tree might determine the normal range in the observed labeling variances. Therefore, in general, differentiated NHBE cells displayed influenza receptor lectins similar to their source tissues.
Since NY312 has an α2,6 sialic acid binding preference, the NY-312-AF594 virus binding provided a confirmatory assay for the SNA binding. The results were as predicted with SNA and NY312-AF594 competing for the same receptors (Figs. 3, 4, S19). Fluorochrome-conjugated viruses have been used in influenza research before (Brandenburg and Zhuang 2007;Couceiro et al. 1993;Yoshimura and Ohnishi 1984). In particular, as prepared here, they would be useful for comparing the binding patterns of influenza virus receptor binding domain variants. This might include competitive binding between two viruses if each virus was bioconjugated with a different fluorochrome, an examination of binding and entry in live cell imaging studies, and examination of the early stages in the viral life cycle via supra-resolution microscopy.
Histological changes attributable to influenza infection were visible in apical cells as early as 8 hr post-infection (Fig. 5). At 24-hr post-infection, the infected NHBE cells demonstrated similar influenza antigen distribution patterns to those found in autopsy tissues. Both apical cell types—ciliated and goblet—had nuclear and cytoplasmic influenza antigen labeling (Fig. 6). This pattern commenced at the 8 hr time-point and increased steadily over time (data not shown). These patterns were also similar to those we have seen in many mouse and ferret studies.
At 48 hr, and more so, at 72 hr post-infection, NHBE basal cells were also infected. Additionally, many individual and cell clumps were detached from the membrane. We attributed the absence of cytological signs of pathology in many of these cells to potential pseudostratified epithelia integrity issues. Additionally, the abundance of basal cell influenza antigen-positive cells at these later time-points may be artificially increased due to these same issues.
Despite the extensive literature available on NHBEs, including their use for influenza A research, we believe that our work adds value in its side-by-side comparison of NHBEs to their source tissue. Due to cost restrictions, we used only a single donor’s NHBE cells. Consequently, even though we used multiple technical replicates throughout this study, future studies using additional donors’ cells would enhance this research by incorporating individual human variance. Our study highlights both strengths and limitations of the NHBE model for influenza research and identifies potential methods for addressing some of these limitations. Many of these findings translate to use of the model’s model for other tracheobronchial mucosal infection studies and more general respiratory research.
Supplementary Material
Supplementary Material
Supplementary Material
Supplementary Material
Supplementary Material
Supplementary Material

Supplementary Material
Supplementary Material
Supplementary Material
Supplementary Material
Supplementary Material
Supplementary Material
Supplementary Material
Supplementary Material
Supplementary Material
Supplementary Material
Supplementary Material
Supplementary Material
Supplementary Material
Supplementary Material
Supplementary Material
Supplementary Material
Supplementary Material
Acknowledgments
The authors would like to acknowledge Larry Lantz of the NIAID Research Technology Branch (RTB) Custom Antibodies Section, NIAID for his assistance in the characterization of Jacalin-680 and the conjugation of influenza viruses with AF594 SE as well as the staff at the NIAID RTB Bioimaging Section for their assistance with confocal microscopy and image post-processing. Additionally, we would like to thank Raymond J. Pickles, University of North Carolina for thoughtful discussion about the labeling differences between anti-α- and anti-β-tubulins. We thank Louis Schwartzman, VPES, LID, NIAID for his assistance with batch production of NY312 virus. We thank Sandra Horton and her staff at the North Carolina State University College of Veterinary Medicine Histopathology Laboratory for their sectioning of tissue and embedded NHBE cell sections for immunofluorescence and histological analysis. This work was supported by the Intramural Research Program of the National Institute of Allergy and Infectious Diseases, National Institute of Health. ASD and JKT are further thankful for the support of the NIH Comparative Molecular Pathology Research Training Program. This work was done in partial fulfillment of A. Sally Davis’ dissertation work towards a PhD in Comparative Biomedical Sciences at the North Carolina State University College of Veterinary Medicine.
Footnotes
Supplementary material for this article is available on the Journal of Histochemistry & Cytochemistry Web site at http://jhc.sagepub.com/supplemental.
Declaration of Conflicting Interests: The authors declared no potential conflicts of interest with respect to the research, authorship, and/or publication of this article.
Funding: The authors disclosed receipt of the following financial support for the research, authorship, and/or publication of this article: This work was supported by the Intramural Research Program of the National Institute of Allergy and Infectious Diseases, National Institute of Health. ASD and JKT are further thankful for the support of the NIH Comparative Molecular Pathology Research Training Program.
References
- Arenberg IK. (1972). Scanning electron microscopy in otorhinolaryngologic research, 1970. Arch Otolaryngol 95:477-483. [DOI] [PubMed] [Google Scholar]
- Ayora-Talavera G, Shelton H, Scull MA, Ren J, Jones IM, Pickles RJ, Barclay WS. (2009). Mutations in H5N1 influenza virus hemagglutinin that confer binding to human tracheal airway epithelium. PLoS One 4:e7836. [DOI] [PMC free article] [PubMed] [Google Scholar]
- Balish AL, Katz JM, Klimov AI. (2013). Influenza: Propagation, quantification, and storage. Curr Protoc Microbiol Chapter 15:Unit 15G.11. [DOI] [PubMed] [Google Scholar]
- Baum LG, Paulson JC. (1990). Sialyloligosaccharides of the respiratory epithelium in the selection of human influenza virus receptor specificity. Acta Histochem Suppl 40:35-38. [PubMed] [Google Scholar]
- Bedetti CD, Singh J, Singh G, Katyal SL, Wong-Chong ML. (1987). Ultrastructural localization of rat clara cell 10 kD secretory protein by the immunogold technique using polyclonal and monoclonal antibodies. J Histochem Cytochem 35:789-794. [DOI] [PubMed] [Google Scholar]
- Berrier AL, Yamada KM. (2007). Cell-matrix adhesion. J Cell Physiol 213:565-573. [DOI] [PubMed] [Google Scholar]
- Boers JE, Ambergen AW, Thunnissen FB. (1999). Number and proliferation of clara cells in normal human airway epithelium. Am J Respir Crit Care Med 159:1585-1591. [DOI] [PubMed] [Google Scholar]
- Brand-Saberi BE, Schafer T. (2014). Trachea: Anatomy and physiology. Thorac Surg Clin 24:1-5. [DOI] [PubMed] [Google Scholar]
- Brandenburg B, Zhuang X. (2007). Virus trafficking - learning from single-virus tracking. Nat Rev Microbiol 5:197-208. [DOI] [PMC free article] [PubMed] [Google Scholar]
- Brookes DW, Miah S, Lackenby A, Hartgroves L, Barclay WS. (2011). Pandemic H1N1 2009 influenza virus with the H275Y oseltamivir resistance neuraminidase mutation shows a small compromise in enzyme activity and viral fitness. J Antimicrob Chemother 66:466-470. [DOI] [PMC free article] [PubMed] [Google Scholar]
- Budowsky EI, Smirnov Yu A, Shenderovich SF. (1993). Principles of selective inactivation of viral genome. VIII. The influence of beta-propiolactone on immunogenic and protective activities of influenza virus. Vaccine 11:343-348. [DOI] [PubMed] [Google Scholar]
- Chan RW, Chan MC, Nicholls JM, Malik Peiris JS. (2013). Use of ex vivo and in vitro cultures of the human respiratory tract to study the tropism and host responses of highly pathogenic avian influenza A (H5N1) and other influenza viruses. Virus Res 178:133-145. [DOI] [PMC free article] [PubMed] [Google Scholar]
- Chan RW, Yuen KM, Yu WC, Ho CC, Nicholls JM, Peiris JS, Chan MC. (2010). Influenza H5N1 and H1N1 virus replication and innate immune responses in bronchial epithelial cells are influenced by the state of differentiation. PLoS One 5:e8713. [DOI] [PMC free article] [PubMed] [Google Scholar]
- Chandrasekaran A, Srinivasan A, Raman R, Viswanathan K, Raguram S, Tumpey TM, Sasisekharan V, Sasisekharan R. (2008). Glycan topology determines human adaptation of avian H5N1 virus hemagglutinin. Nat Biotech 26:107-113. [DOI] [PubMed] [Google Scholar]
- Chopra DP, Sullivan J, Wille JJ, Siddiqui KM. (1987). Propagation of differentiating normal human tracheobronchial epithelial cells in serum-free medium. J Cell Physiol 130:173-181. [DOI] [PubMed] [Google Scholar]
- Couceiro JN, Paulson JC, Baum LG. (1993). Influenza virus strains selectively recognize sialyloligosaccharides on human respiratory epithelium; the role of the host cell in selection of hemagglutinin receptor specificity. Virus Res 29:155-165. [DOI] [PubMed] [Google Scholar]
- de Graaf M, Fouchier RA. (2014). Role of receptor binding specificity in influenza A virus transmission and pathogenesis. EMBO J 33:823-841. [DOI] [PMC free article] [PubMed] [Google Scholar]
- Dvorak A, Tilley AE, Shaykhiev R, Wang R, Crystal RG. (2011). Do airway epithelium air-liquid cultures represent the in vivo airway epithelium transcriptome? Am J Respir Cell Mol Biol 44:465-473. [DOI] [PMC free article] [PubMed] [Google Scholar]
- El Ghalbzouri A, Commandeur S, Rietveld MH, Mulder AA, Willemze R. (2009). Replacement of animal-derived collagen matrix by human fibroblast-derived dermal matrix for human skin equivalent products. Biomaterials 30:71-78. [DOI] [PubMed] [Google Scholar]
- Gaush CR, Smith TF. (1968). Replication and plaque assay of influenza virus in an established line of canine kidney cells. Appl Microbiol 16:588-594. [DOI] [PMC free article] [PubMed] [Google Scholar]
- Geisler C, Jarvis DL. (2011). Effective glycoanalysis with Maackia amurensis lectins requires a clear understanding of their binding specificities. Glycobiology 21:988-993. [DOI] [PMC free article] [PubMed] [Google Scholar]
- Gill JR, Sheng ZM, Ely SF, Guinee DG, Beasley MB, Suh J, Deshpande C, Mollura DJ, Morens DM, Bray M, Travis WD, Taubenberger JK. (2010). Pulmonary pathologic findings of fatal 2009 pandemic influenza A/H1N1 viral infections. Arch Pathol Lab Med 134:235-243. [DOI] [PMC free article] [PubMed] [Google Scholar]
- Goldstein MA, Tauraso NM. (1970). Effect of formalin, beta-propiolactone, merthiolate, and ultraviolet light upon influenza virus infectivity chicken cell agglutination, hemagglutination, and antigenicity. Appl Microbiol 19:290-294. [DOI] [PMC free article] [PubMed] [Google Scholar]
- Gray TE, Guzman K, Davis CW, Abdullah LH, Nettesheim P. (1996). Mucociliary differentiation of serially passaged normal human tracheobronchial epithelial cells. Am J Respir Cell Mol Biol 14:104-112. [DOI] [PubMed] [Google Scholar]
- Gruenert DC, Finkbeiner WE, Widdicombe JH. (1995). Culture and transformation of human airway epithelial cells. Am J Physiol 268:L347-360. [DOI] [PubMed] [Google Scholar]
- Hackett TL, Knight DA. (2007). The role of epithelial injury and repair in the origins of asthma. Curr Opin Allergy Clin Immunol 7:63-68. [DOI] [PubMed] [Google Scholar]
- Hermann I, Rath S, Ziesemer S, Volksdorf T, Dress RJ, Gutjahr M, Muller C, Beule AG, Hildebrandt JP. (2014). Staphylococcus aureus-hemolysin a disrupts cell-matrix adhesions in human airway epithelial cells. Am J Respir Cell Mol Biol. [DOI] [PubMed] [Google Scholar]
- Ho JA, Chang HC, Shih NY, Wu LC, Chang YF, Chen CC, Chou C. (2010). Diagnostic detection of human lung cancer-associated antigen using a gold nanoparticle-based electrochemical immunosensor. Anal Chem 82:5944-5950. [DOI] [PubMed] [Google Scholar]
- Howe D, Shannon JG, Winfree S, Dorward DW, Heinzen RA. (2010). Coxiella burnetii phase i and ii variants replicate with similar kinetics in degradative phagolysosome-like compartments of human macrophages. Infect Immun 78:3465-3474. [DOI] [PMC free article] [PubMed] [Google Scholar]
- Hukkanen J, Pelkonen O, Hakkola J, Raunio H. (2002). Expression and regulation of xenobiotic-metabolizing cytochrome p450 (cyp) enzymes in human lung. Crit Rev Toxicol 32:391-411. [DOI] [PubMed] [Google Scholar]
- Ibricevic A, Pekosz A, Walter MJ, Newby C, Battaile JT, Brown EG, Holtzman MJ, Brody SL. (2006). Influenza virus receptor specificity and cell tropism in mouse and human airway epithelial cells. J Virol 80:7469-7480. [DOI] [PMC free article] [PubMed] [Google Scholar]
- Ilyushina NA, Bovin NV, Webster RG. (2012a). Decreased neuraminidase activity is important for the adaptation of H5N1 influenza virus to human airway epithelium. J Virol 86:4724-4733. [DOI] [PMC free article] [PubMed] [Google Scholar]
- Ilyushina NA, Govorkova EA, Gray TE, Bovin NV, Webster RG. (2008). Human-like receptor specificity does not affect the neuraminidase-inhibitor susceptibility of H5N1 influenza viruses. PLoS Pathog 4:e1000043. [DOI] [PMC free article] [PubMed] [Google Scholar]
- Ilyushina NA, Ikizler MR, Kawaoka Y, Rudenko LG, Treanor JJ, Subbarao K, Wright PF. (2012b). Comparative study of influenza virus replication in MDCK cells and in primary cells derived from adenoids and airway epithelium. J Virol 86:11725-11734. [DOI] [PMC free article] [PubMed] [Google Scholar]
- Jagger BW, Memoli MJ, Sheng ZM, Qi L, Hrabal RJ, Allen GL, Dugan VG, Wang R, Digard P, Kash JC, Taubenberger JK. (2010). The PB2-E627K mutation attenuates viruses containing the 2009 H1N1 influenza pandemic polymerase. mBio 18 May 2010;1(1): e00067-10. [DOI] [PMC free article] [PubMed] [Google Scholar]
- Kamolz LP, Luegmair M, Wick N, Eisenbock B, Burjak S, Koller R, Meissl G, Frey M. (2005). The Viennese culture method: Cultured human epithelium obtained on a dermal matrix based on fibroblast containing fibrin glue gels. Burns 31:25-29. [DOI] [PubMed] [Google Scholar]
- Kesimer M, Kirkham S, Pickles RJ, Henderson AG, Alexis NE, Demaria G, Knight D, Thornton DJ, Sheehan JK. (2009). Tracheobronchial air-liquid interface cell culture: A model for innate mucosal defense of the upper airways? Am J Physiol Lung Cell Mol Physiol 296:L92-l100. [DOI] [PMC free article] [PubMed] [Google Scholar]
- Kogure T, Suzuki T, Takahashi T, Miyamoto D, Hidari KI, Guo CT, Ito T, Kawaoka Y, Suzuki Y. (2006). Human trachea primary epithelial cells express both sialyl(alpha2-3)gal receptor for human parainfluenza virus type 1 and avian influenza viruses, and sialyl(alpha2-6)gal receptor for human influenza viruses. Glycoconj J 23:101-106. [DOI] [PubMed] [Google Scholar]
- Lee CS, Muthusamy A, Abdul-Rahman PS, Bhavanandan VP, Hashim OH. (2013). An improved lectin-based method for the detection of mucin-type O-glycans in biological samples. Analyst 138:3522-3529. [DOI] [PubMed] [Google Scholar]
- Lesimple P, Liao J, Robert R, Gruenert DC, Hanrahan JW. (2010). Cystic fibrosis transmembrane conductance regulator trafficking modulates the barrier function of airway epithelial cell monolayers. J Physiol 588:1195-1209. [DOI] [PMC free article] [PubMed] [Google Scholar]
- Lopez-Souza N, Favoreto S, Wong H, Ward T, Yagi S, Schnurr D, Finkbeiner WE, Dolganov GM, Widdicombe JH, Boushey HA, Avila PC. (2009). In vitro susceptibility to rhinovirus infection is greater for bronchial than for nasal airway epithelial cells in human subjects. J Allergy Clin Immunol 123:1384-1390.e1382. [DOI] [PMC free article] [PubMed] [Google Scholar]
- Martinez-Anton A, Sokolowska M, Kern S, Davis AS, Alsaaty S, Taubenberger JK, Sun J, Cai R, Danner RL, Eberlein M, Logun C, Shelhamer JH. (2013). Changes in microRNA and mRNA expression with differentiation of human bronchial epithelial cells. Am J Respir Cell Mol Biol 49:384-395. [DOI] [PMC free article] [PubMed] [Google Scholar]
- Matrosovich MN, Matrosovich TY, Gray T, Roberts NA, Klenk HD. (2004). Human and avian influenza viruses target different cell types in cultures of human airway epithelium. Proc Natl Acad Sci U S A 101:4620-4624. [DOI] [PMC free article] [PubMed] [Google Scholar]
- Menscher A. (2013). ‘Chapter 17. The respiratory system’ in Junqueira’s Basic Histology: Text and Atlas. 13th edition, China: McGraw-Hill Medical. [Google Scholar]
- Mok CK, Yen HL, Yu MY, Yuen KM, Sia SF, Chan MC, Qin G, Tu WW, Peiris JS. (2011). Amino acid residues 253 and 591 of the PB2 protein of avian influenza virus A H9N2 contribute to mammalian pathogenesis. J Virol 85:9641-9645. [DOI] [PMC free article] [PubMed] [Google Scholar]
- Mori M, Tezuka F, Chiba R, Funae Y, Watanabe M, Nukiwa T, Takahashi T. (1996). Atypical adenomatous hyperplasia and adenocarcinoma of the human lung: Their heterology in form and analogy in immunohistochemical characteristics. Cancer 77:665-674. [PubMed] [Google Scholar]
- Nicholls JM, Bourne AJ, Chen H, Guan Y, Peiris JS. (2007). Sialic acid receptor detection in the human respiratory tract: Evidence for widespread distribution of potential binding sites for human and avian influenza viruses. Respir Res 8:73. [DOI] [PMC free article] [PubMed] [Google Scholar]
- Oshansky CM, Pickens JA, Bradley KC, Jones LP, Saavedra-Ebner GM, Barber JP, Crabtree JM, Steinhauer DA, Tompkins SM, Tripp RA. (2011). Avian influenza viruses infect primary human bronchial epithelial cells unconstrained by sialic acid alpha2,3 residues. PLoS One 6:e21183. [DOI] [PMC free article] [PubMed] [Google Scholar]
- Pack RJ, Al-Ugaily LH, Morris G. (1981). The cells of the tracheobronchial epithelium of the mouse: A quantitative light and electron microscope study. J Anat 132:71-84. [PMC free article] [PubMed] [Google Scholar]
- Pezzulo AA, Starner TD, Scheetz TE, Traver GL, Tilley AE, Harvey BG, Crystal RG, Mccray PB, Jr., Zabner J. (2011). The air-liquid interface and use of primary cell cultures are important to recapitulate the transcriptional profile of in vivo airway epithelia. Am J Physiol Lung Cell Mol Physiol 300:L25-31. [DOI] [PMC free article] [PubMed] [Google Scholar]
- Qi L, Kash JC, Dugan VG, Wang R, Jin G, Cunningham RE, Taubenberger JK. (2009). Role of sialic acid binding specificity of the 1918 influenza virus hemagglutinin protein in virulence and pathogenesis for mice. J Virol 83:3754-3761. [DOI] [PMC free article] [PubMed] [Google Scholar]
- Roessler F, Grossenbacher R, Stanisic M, Walt H. (1991). Correlative histological and ultrastructural study of unusual changes in human tracheobronchial epithelium. Laryngoscope 101:473-479. [DOI] [PubMed] [Google Scholar]
- Scull MA, Gillim-Ross L, Santos C, Roberts KL, Bordonali E, Subbarao K, Barclay WS, Pickles RJ. (2009). Avian influenza virus glycoproteins restrict virus replication and spread through human airway epithelium at temperatures of the proximal airways. PLoS Pathog 5:e1000424. [DOI] [PMC free article] [PubMed] [Google Scholar]
- Shelton H, Ayora-Talavera G, Ren J, Loureiro S, Pickles RJ, Barclay WS, Jones IM. (2011). Receptor binding profiles of avian influenza virus hemagglutinin subtypes on human cells as a predictor of pandemic potential. J Virol 85:1875-1880. [DOI] [PMC free article] [PubMed] [Google Scholar]
- Song H, Wan H, Araya Y, Perez DR. (2009). Partial direct contact transmission in ferrets of a mallard H7N3 influenza virus with typical avian-like receptor specificity. Virol J 6:126. [DOI] [PMC free article] [PubMed] [Google Scholar]
- Steel J, Burmakina SV, Thomas C, Spackman E, Garcia-Sastre A, Swayne DE, Palese P. (2008). A combination in-ovo vaccine for avian influenza virus and Newcastle disease virus. Vaccine 26:522-531. [DOI] [PMC free article] [PubMed] [Google Scholar]
- Suksatu A, Sangsawad W, Thitithanyanont A, Smittipat N, Fukuda MM, Ubol S. (2009). Characteristics of stork feces-derived H5N1 viruses that are preferentially transmitted to primary human airway epithelial cells. Microbiol Immunol 53:675-684. [DOI] [PubMed] [Google Scholar]
- Suzuki Y. (2005). Sialobiology of influenza: Molecular mechanism of host range variation of influenza viruses. Biol Pharm Bull 28:399-408. [DOI] [PubMed] [Google Scholar]
- Thompson CI, Barclay WS, Zambon MC, Pickles RJ. (2006a). Infection of human airway epithelium by human and avian strains of influenza A virus. J Virol 80:8060-8068. [DOI] [PMC free article] [PubMed] [Google Scholar]
- Thompson HG, Mih JD, Krasieva TB, Tromberg BJ, George SC. (2006b). Epithelial-derived TGF-Beta 2 modulates basal and wound-healing subepithelial matrix homeostasis. Am J Physiol Lung Cell Mol Physiol 291:L1277-1285. [DOI] [PubMed] [Google Scholar]
- Triana-Baltzer GB, Babizki M, Chan MC, Wong AC, Aschenbrenner LM, Campbell ER, Li QX, Chan RW, Peiris JS, Nicholls JM, Fang F. (2010). Das181, a sialidase fusion protein, protects human airway epithelium against influenza virus infection: An in vitro pharmacodynamic analysis. J Antimicrob Chemother 65:275-284. [DOI] [PMC free article] [PubMed] [Google Scholar]
- Vermeer PD, Harson R, Einwalter LA, Moninger T, Zabner J. (2003). Interleukin-9 induces goblet cell hyperplasia during repair of human airway epithelia. Am J Respir Cell Mol Biol 28:286-295. [DOI] [PubMed] [Google Scholar]
- Wan H, Perez DR. (2007) Amino acid 226 in the hemagglutinin of H9N2 influenza viruses determines cell tropism and replication in human airway epithelial cells. J Virol 81:5181-5191 [DOI] [PMC free article] [PubMed] [Google Scholar]
- Wong AP, Keating A, Waddell TK. (2009). Airway regeneration: The role of the clara cell secretory protein and the cells that express it. Cytotherapy 11:676-687. [DOI] [PubMed] [Google Scholar]
- Yoshimura A, Ohnishi S. (1984). Uncoating of influenza virus in endosomes. J Virol 51:497-504 [DOI] [PMC free article] [PubMed] [Google Scholar]
- Zhang L, Bukreyev A, Thompson CI, Watson B, Peeples ME, Collins PL, Pickles RJ. (2005). Infection of ciliated cells by human parainfluenza virus type 3 in an in vitro model of human airway epithelium. J Virol 79:1113-1124. [DOI] [PMC free article] [PubMed] [Google Scholar]
Associated Data
This section collects any data citations, data availability statements, or supplementary materials included in this article.
Supplementary Materials