

Abstract
Objectives
The primary purpose of this study was to determine if acceleration metrics derived from monitoring outside of treatment are responsive to change in upper extremity (UE) function. The secondary purposes were two-fold: The first was to compare metric values during task-specific training and while in the free-living environment. The second was to establish metric associations with an in-clinic measure of movement capabilities.
Design
Before-After Observational Study
Setting
Inpatient Hospital (primary purpose); Outpatient Hospital (secondary purpose)
Participants
Individuals (n=8) with UE hemiparesis < 30 days post stroke (primary purpose); Individuals (n=27) with UE hemiparesis ≥ 6 months post stroke (secondary purpose).
Methods
The inpatient sample was evaluated for UE movement capabilities and monitored with wrist-worn accelerometers for 22 hours outside of treatment before and after multiple sessions of task-specific training. The outpatient sample was evaluated for UE movement capabilities and monitored during a single session of task-specific training and the subsequent 22 hours outside of clinical settings.
Main Outcome Measures
Action Research Arm Test and acceleration metrics quantified from accelerometer recordings.
Results
Five metrics improved in the inpatient sample, along with UE function as measured on the ARAT: use ratio, magnitude ratio, variation ratio, median paretic UE acceleration magnitude, and paretic UE acceleration variability. Metric values were greater during task-specific training than in the free-living environment, and each metric was strongly associated with ARAT score.
Conclusions
Multiple metrics that characterize different aspects of UE movement are responsive to change in function. Metric values are different during training than in the free-living environment, providing further evidence that what the paretic UE does in the clinic may not generalize to what it does in everyday life.
Keywords: Stroke, Paresis, Rehabilitation, Accelerometry, Neurology
Upper extremity (UE) hemiparesis following stroke is one of the leading causes of disability with only a small percentage of survivors recovering sufficiently to engage in their professional and private lives as they did before stroke onset.1–3 At the present time, however, there is a limited ability to objectively evaluate UE function in the free-living environment (i.e., outside of clinical settings). This is problematic because a major purpose of rehabilitation and the associated healthcare costs is to enhance everyday function and independent living. Furthermore, it is routinely assumed that improvements observed in the clinic generalize to the free-living environment, but there is evidence to suggest that this assumption may not always hold true.4
Body-worn sensors, such as accelerometers, non-invasively measure movement production outside of clinical settings. The lack of a discernible difference in signals resulting from task-specific (e.g., reaching or grasping) and non task-specific UE movement (e.g., arm swing during gait) limits what can be understood regarding qualitative aspects of UE motor behavior. To overcome this limitation, some recent approaches have incorporated machine learning,5 spectral analysis,6 and other techniques7 to probe task-specific UE behaviors. Progress has been limited, however, due to the considerable intra- and inter-individual variability in human movement.8,9 Diminishing time available for the delivery of rehabilitation services10 also limits the practicality of working with sophisticated data sets in clinical practice.
Another previously used methodology involves transforming the signals recorded in the free-living environment into metrics that correlate with clinical scales of UE function. For example, the absolute duration of paretic UE movement11 and the ratio of movement between paretic and non-paretic UEs12,13 correlate with commonly used clinical assessments of UE function. The advantage of this approach is that the metrics are readily quantifiable and derived from wireless devices that are minimally invasive. Existing metrics pertain solely to the duration of paretic UE movement during the monitoring period. It is possible that other movement characteristics can be captured using these devices, providing greater insight into UE motor behavior in the free-living environment. A deeper understanding of what patients do in their everyday lives may afford clinicians a means to objectively evaluate function, set benchmarks for treatment, as well as develop and adapt rehabilitation protocols on an individual basis.
To this end, recent work has established the convergent validity of metrics that capture different aspects of how UE movement occurs during task-specific behaviors.14 Whether these metrics are responsive to change in UE function outside of treatment settings is not known. It is also not understood how metric values during motor retraining compare with values captured while in the free-living environment. Thus, the primary purpose of the current study was to further examine the validity of these metrics by assessing their responsiveness to change in UE function. The secondary purposes were two-fold: The first was to compare metric values during task-specific training and while in the free-living environment. The second was to establish metric associations with a widely used clinical scale of UE function. Based on previous findings,14 it was hypothesized that ratio and paretic UE metrics, particularly those related to acceleration variability, would be responsive to changes in UE function following treatment and exhibit a strong association with ARAT score. It was also hypothesized that metric values would be higher during task-specific training than in the free-living environment.
Methods
Participants
To determine responsiveness to change in UE function, metric values were derived from monitoring outside of treatment at a pre-test and post-test that took place before and after multiple sessions of high-repetition, task-specific training in an inpatient sample (≤ 30 days post stroke, n=8). The outpatient sample (≥ 6 months post stroke, n=27) was recruited as part of an ongoing clinical trial (NCT 01146379). Participants in this sample were monitored during a single training session and in the free-living environment to compare metric values in both contexts and establish metric associations with ARAT score. Inclusion and exclusion criteria for each sample are shown in Table 1. All participants provided informed consent according to procedures approved by the Institutional Review Boards at Northwestern University (inpatient sample) and Washington University (outpatient sample).
Table 1.
Inclusion and exclusion criteria for inpatient and outpatient samples.
| Inclusion Criteria | Inpatient | Outpatient |
|---|---|---|
| Motricity Index score of 42–93. | X | |
| Action Research Arm Test score of 10–49. | X | |
| Diagnosis of ischemic or hemorrhagic stroke with residual UE paresis, as determined by a stroke neurologist. | X | X |
| Sufficient cognitive function to follow commands, as indicated by a score of 0–1 on the NIHSS. | X | X |
| ≥ 18 years of age. | X | X |
| Exclusion Criteria | Inpatient | Outpatient |
|---|---|---|
| Severe hemispatial neglect, as indicated by a score of 2 on the NIHSS Extinction and Inattention subtest. | X | |
| Psychiatric diagnosis. | X | |
| Other neurological diagnoses. | X | |
| History of neurosurgical intervention. | X | |
| Currently pregnant. | X | X |
| History of stroke > 1 week prior to the current index stroke affecting the same side of the body. | X |
Procedure
Participants in both samples engaged in individualized, task-specific training according to a previously established protocol.15,16 Tasks used for training were identified by participants as being meaningful to them and requiring improvement to enhance their independence and performance in daily living. Inpatient and outpatient participants completed an average of 13 and 28 sessions, respectively. All participants were monitored via wireless devices containing a tri-axial, solid-state digital accelerometera (dimensions: 4.6cm × 3.3cm × 1.5 cm, weight: 19 grams, range: +/−8 g) strapped to the dorsal side of both wrists just proximal to the radial and ulnar styloid. Inpatient participants were monitored for 22 hours following the pre-test and post-test. The outpatient sample was monitored during the 24th training session and subsequent 22 hours. The 24th treatment session was chosen because participants were familiar with procedures and accustomed to wearing the devices at this point in the overall trial. All participants reported that the monitoring period was representative of a typical day. Paretic UE function was evaluated before and after the intervention for the inpatient sample and just prior to the 24th training session for the outpatient sample. UE function was evaluated with the ARAT, a test consisting of 19 items divided into four subscales: grasp, grip, pinch, and gross movement. The ARAT was chosen because this clinical assessment is a valid and reliable test of UE function,17–19 sensitive to change in function following stroke,18–22 and widely used in clinical trials.23,24 The intra- and inter-rater reliability of the ARAT is established.25 Moreover, the ARAT is strongly correlated with other accepted measures of UE function.26,27 Blinded raters evaluated UE function for the outpatient sample; a separate rater that was not blinded performed evaluations for the inpatient sample.
Data Processing
Accelerations were sampled at 30 Hz in all three cardinal planes. Due to manufacturer specifications, accelerations registered as activity counts (0.016318 m/s2 per count) and were binned into 1-second epochs. Accelerations resulting from non task-specific UE movement (e.g., arm swing during gait) are included in recordings, but previous work has demonstrated that walking time has a negligible influence on the overall amount of activity recorded during monitoring.12 Accelerations in each plane were smoothed using a five-second running average and combined into a single value for each UE by summing the squares of the accelerations in each plane and taking the square root of the resulting value (= √(x2 + y2 + z2). Custom software was written in MATLAB (Mathworks, Inc. R2012a, Natick, MA) to calculate multiple metrics.14 These metrics were calculated for inpatient and outpatient samples as well as a group of neurologically-intact controls (unpublished data). Distributions of metric values were examined in all groups. Metrics that displayed minimal overlap with the control sample were selected for analysis. These metrics were classified into three categories: 1) ratio of movement characteristics between paretic and non-paretic UEs; 2) paretic UE movements; and 3) movements characteristics of both UEs combined. Definitions of the selected metrics and the formulae used to calculate them are presented in Table 2.
Table 2.
Description and formulae used to calculate acceleration metrics.
|
Combined Acceleration: prior to quantifying individual metrics, epochs where no acceleration occurred in both UEs were removed. Thus, metrics characterize how movement occurs, not how often movement occurs, and are uninfluenced by inactivity. Next, the accelerations in each cardinal plane (x, y, z) were combined into a single value that is calculated as follows:
| |||
|
Ratio Acceleration Metrics: these metrics reflect movement characteristics of the paretic UE normalized to the non-paretic UE. Normalization of movement characteristics between UEs is relevant because most goal-directed UE behavior involves both UEs. Higher ratio values indicate that paretic UE movement characteristics more closely approximate or surpass those of the non-paretic UE during the monitoring period. Use Ratio: percentage of time the paretic UE is active relative to the total duration of time the non-paretic UE is active. The threshold for an UE to be considered active was ≥ 0.02 m/s2.14 Values near 1.0 indicate that both UEs are active for the same amount of time during the monitoring period. Values less than 1.0 indicate the paretic UE is active for a lesser duration of time than the non-paretic UE. The inverse is indicated when values are greater than 1.0. Use ratios are in the 0.3 – 0.5 range in persons with stroke and 0.8 – 1.0 in controls (i.e., non-dominant/dominant) during monitoring in free living. | |||
|
Paretic Acceleration Metrics: these metrics reflect movement characteristics of the paretic UE. The median acceleration is indicative of the typical acceleration over the entire monitoring period and is reported because outlier accelerations render the mean less representative of the typical acceleration over the monitoring period. Acceleration variability is indicative of the average distance the paretic UE acceleration is from the mean acceleration over the monitoring period.
| |||
|
Bilateral Acceleration Metrics: these metrics reflect acceleration characteristics of the paretic UE and non-paretic UE combined. UE accelerations for individual epochs are summed together before calculating the median and standard deviation over the monitoring period.
|
Statistical Analyses
In the inpatient sample, paired-samples t-tests were used to test for differences in ARAT score and acceleration metrics before and after the intervention. Effect sizes (d), using the single sample method, were calculated to evaluate responsiveness to change.28 The metrics that were responsive to change in function in the inpatient sample were examined further in the outpatient sample. Repeated-measures multivariate analysis of variance (MANOVA) was used to test for differences between the metrics in task-specific training and in the free-living environment because of collinearity among metrics. Spearman correlations were then used to determine the strength of associations between ARAT taken in clinic and the metrics quantified from the free-living environment in the outpatient sample. Spearman correlations were chosen because the ARAT is scored on an ordinal scale.29 Based on sample size, correlation coefficients greater than 0.48 were significant at the p < 0.01 level. The magnitude of the correlation coefficient was considered strong at 0.60 or greater.30 All statistical procedures were conducted using SPSS version 20 (IBM Statistics), and alpha level was set at 0.05 a priori.
Results
Participant demographics for both samples are shown in Table 3. Both samples consisted of mostly male, middle-aged adults approximately half of which had mild-to-moderate paresis on their dominant side. The percentage of the 22-hour monitoring period that the UEs were active was similar in both samples (inpatient pre-test = 37 ± 12%, inpatient post-test = 41 ± 11%, outpatient = 42 ± 12%) and is comparable to self-reported activity in neurologically intact adults (~51%).31 Minimal disparity in activity between individuals with and without UE impairment reinforces the importance of examining metrics that characterize how movement happens and not only how often movement happens. Inpatient and outpatient samples were also similar in the percentage of the monitoring period that the paretic UE was active (inpatient pre-test = 19 ± 9%, inpatient post-test = 27 ± 9%, outpatient = 27 ± 12%).
Table 3.
Inpatient and outpatient sample characteristics.
| Inpatient (n=8) | Outpatient (n=27) | |||
|---|---|---|---|---|
| Mean ± SD or n | Range or % | Mean ± SD or n | Range or % | |
| Age (years) | 56 ± 10.4 years | 34–68 | 62 ± 9.4 | 46–81 |
| Gender | 6 male | 75% | 20 male | 74% |
| 2 female | 25% | 7 female | 26% | |
| Stroke Type | 7 Ischemic | 88% | 22 Ischemic | 82% |
| 1 Hemorrhagic | 12% | 2 Hemorrhagic | 7% | |
| Chronicity | 14 ± 6.4 days | 7–24 | 31 ± 47.5 months | 6–221 |
| Dominant Side | 5 Right | 63% | 21 Right | 78% |
| 3 Left | 37% | 6 Left | 22% | |
| Dominant Side Paretic | 2 Right | 25% | 14 Right | 52% |
| 2 Left | 25% | 3 Left | 11% | |
| ARAT Score | 23.4 ± 13.2 | 8–46 | 33.2 ± 14.2 | 10–57 |
| Motricity Index Score | 64 ± 8.2 | 53–79 | 77.9 ± 15 | 50–100 |
Inpatient Sample: Responsiveness to Change
UE function, as measured on the ARAT, improved significantly in the inpatient sample ( pre = 23.4, post = 36.4, t(7) = −4.91, p < .01). Five acceleration metrics also improved significantly: 1) use ratio (t(7) = −4.8, p < .01, d = 1.7); 2); 2) magnitude ratio (t(7) = −3.3, p = .01, d = 1.2); 3) variation ratio ( , p = .03, d = 1.0); 4) median paretic UE acceleration magnitude (t(7) = −2.8, p = .03, d = 1.0); 5) paretic UE acceleration variability (t(7) = −2.7, p = .03, d = 1.0). The values for all metrics at the pre-test and post-test are shown in Table 4.
Table 4.
Pre-test and post-test metric values (Mean ± SD) for the inpatient sample.
| Metric Category | Pre-Test | Post-Test |
|---|---|---|
| Ratio | ||
| * Use (%) | 0.54 ± 0.18 | 0.86 ± 0.28 |
| * Magnitude (%) | 0.24 ± 0.32 | 0.71 ± 0.65 |
| * Variation (%) | 0.60 ± 0.23 | 0.80 ± 0.22 |
| Paretic | ||
| * Median (m/s2) | 0.05 ± 0.09 | 0.23 ± 0.21 |
| * Variability (m/s2) | 0.53 ± 0.16 | 0.72 ± 0.19 |
| Bilateral | ||
| Median (m/s2) | 1.0 ± 0.2 | 1.1 ± 0.2 |
| Variability (m/s2) | 1.2 ± 0.3 | 1.3 ± 0.2 |
p < .05
Outpatient Sample: Metric Values in Task-Specific Training and the Free-Living Environment
In the outpatient sample, all five metric values were significantly higher during task-specific training than in the free-living environment (F5, 22 = 22.95, p < .001, η2 = .839): 1) use ratio (p < .001, Figure 1A); 2) magnitude ratio (p = .001, Figure 1B); 3) variation ratio (p < .001, Figure 1C); 4) median paretic UE acceleration magnitude (p < .001, Figure 1D); 5) paretic UE acceleration variability (p < .001, Figure 1E).
Figure 1.
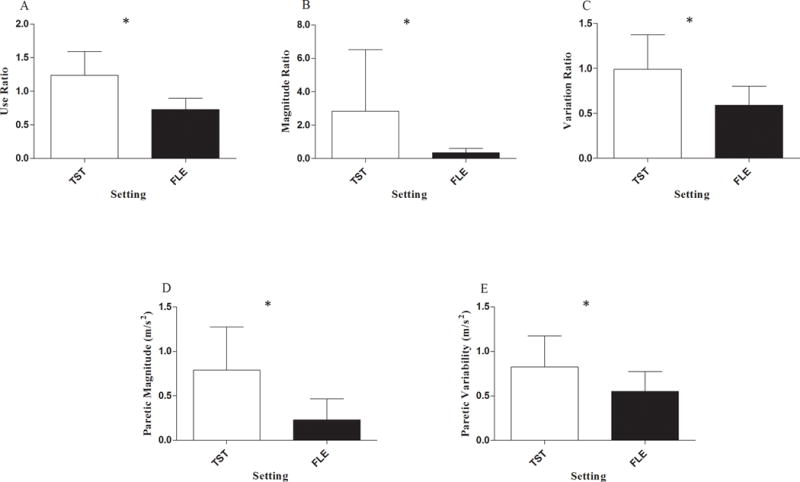
Difference in ratio and paretic UE metric values during task-specific training (TST) and in the free-living environment (FLE) (* p < .001). Group means and standard deviations for: A) use ratio; B) magnitude ratio; C) variation ratio; D) median paretic acceleration magnitude; E) paretic acceleration variability.
Spearman correlations between ARAT score measured in clinic and the metrics quantified from the free-living environment were strong: 1) use ratio (ρ = .79, p < .001, Figure 2A); 2) magnitude ratio (ρ = .83, p <.001, Figure 2B); 3) variation ratio (ρ = .85, p < .001, Figure 2C); 4) median paretic UE acceleration magnitude (ρ = .75, p < .001, Figure 2D); 5) paretic UE acceleration variability (ρ = .73, p < .001, Figure 2E).
Figure 2.
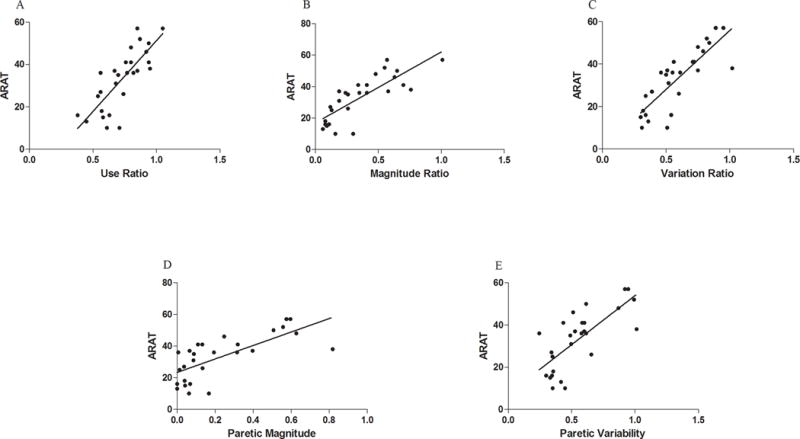
Scatterplots with line of best fit for ARAT score and metrics quantified from free-living environment in the outpatient sample: A) use ratio, ρ = .79; B) magnitude ratio, ρ = .83; C) variation ratio, ρ = .85; D) median paretic acceleration magnitude, ρ = .75; E) paretic acceleration variability, ρ = .73.
Discussion
The primary purpose of this study was to examine the responsiveness of acceleration metrics, quantified outside of treatment, to change in UE function. The secondary purposes were to compare metric values during task-specific training and the free-living environment, as well as establish the relationship between an in-clinic measure of movement capabilities and what the paretic UE actually does in the free-living environment. Findings of the current study demonstrate that multiple acceleration metrics are responsive to change in UE function. These same metrics are driven significantly higher by task-specific training and are strongly associated with an in-clinic measure of movement capabilities.
Five metrics were found to be responsive to improvements in function in the inpatient sample. As hypothesized, all three ratio metrics increased after treatment. Thus, better function is achieved when movement characteristics of the paretic UE more closely approximate or surpass characteristics of the non-paretic UE. Since most UE movement is bilateral in neurologically-intact individuals,31 recovery can be inferred when the paretic UE plays a more active role in UE movement. Stated another way, the paretic UE not only becomes more involved (i.e., use ratio), but its movement becomes more intense (i.e., magnitude ratio) and dynamic (i.e., variation ratio). The use ratio is the only metric that has been examined before in persons within 30 days of stroke, and average values in the current study were less than previously reported estimates (i.e., 0.66)32,33 at the pre-test but greater at the post-test. The median magnitude and variability of the paretic UE acceleration, irrespective of the non-paretic UE acceleration, were also responsive to changes in UE function.
In addition to being responsive to change, metric values are also driven significantly higher in task-specific training. An initial study involving this same outpatient sample examined the stability of the association between metrics and UE function over multiple sessions of task-specific training.14 Use and magnitude ratios were moderately correlated with ARAT during some sessions. Contrary to the strong association based on monitoring from free living reported here, the median paretic acceleration magnitude was not correlated with ARAT during any session of task-specific training. Taken together, previous findings and results reported here indicate that training alters metric values sufficiently to distort the relationship between ARAT score with both the amount and intensity of paretic UE movement. By virtue of the difference between metric values during training and free living, UE movement potential appears to be much greater than previous reports suggest. For example, previous estimates of the use ratio in the free-living environment for persons greater than six months post stroke are on the order of 0.3 – 0.5.13 This range is considerably lower than the 0.8 – 2.3 range observed during task-specific training. Thus, task-specific training engages and drives paretic UE movement higher.
Findings reported here indicate that there is a strong association between the in-clinic measure of movement capabilities and paretic UE movement in the free-living environment. As stated above, differences between the in-clinic and free-living associations likely reflects that training engaged the paretic UE in excess of what it does in the free-living environment, thus, altering the relationship between ARAT score and metric values. Despite the divergent relationship between ARAT and these specific metrics, both the variation ratio and paretic UE acceleration variability had moderate-to-strong associations that were stable over multiple sessions of task-specific training.14 Acceleration variability metrics, therefore, are robust indicators of UE function, irrespective of the context in which monitoring takes place.
Practical applications exist for the results of the current study. Specifically, these findings invite the possibility that an algorithm can be developed to provide feedback about UE function outside of clinical settings during everyday life. A means to access this information would offer clinicians a practical yet objective method for determining whether a patient is responding to treatment. If data transmission and reduction were automated, then biofeedback could be provided to the patient and caregiver, potentially minimizing the incidence of learned non-use.34 Given the disparity between metric values during training and in the free-living environment, providing this feedback may prompt individuals to achieve more of their true movement potential. Such a device is currently in development but is limited to feedback regarding the duration of paretic UE use.35,36 Given that four other metrics were responsive to change in UE function, and each characterizes different aspects of movement, the combination of metrics may provide more information than any individual metric. Indeed, specific combinations of metrics might be individually-tailored such that feedback while in the free-living environment focuses on one or two at a time. Additionally, because metric values appear to be pliant, clinicians may be able to adapt training to promote specific aspects of paretic UE movement (e.g., intensity or variability). Despite differences in the qualitative aspects of movement each metric characterizes, relationships between metrics indicate there may be partial redundancy across them.
An algorithm that can account for different movement characteristics may also have utility in clinical trials investigating the effects of novel treatment strategies. Many of the clinical assessments used to evaluate outcomes, including the ARAT, are scored on ordinal scales. Though ordinal scales structure observation criteria in a way that allows quick test administration, the metrics examined here are scored on a continuous scale, possibly making them more sensitive to movement restoration. Eliminating the need to administer assessments in clinical practice may also prove valuable given the limited time available for treatment.
Study Limitations
Two major limitations of the current study should be taken into consideration when interpreting the results. First, sample sizes were small. Data collected from nearly half of the participants in the inpatient sample could not be used because of miscommunication with the hospital staff. In short, devices were removed for showering and then reapplied to the incorrect extremity or not at all. Similar issues were encountered with participants in the outpatient sample. Sample size aside, addressing both purposes in one sample would allow more definitive conclusions to be reached. Nevertheless, large effect sizes were observed for all metrics exhibiting a change from pre- to post-testing. Thus, it does not appear that the findings reported here are based on spurious data. Future work should quantify these metrics from a larger sample to identify normative values/ranges with the goal of establishing thresholds for normal and pathological function.
A second limitation is that individuals were monitored for only 22 hours which may not be entirely representative of typical paretic UE movement outside of clinical settings. While longer recordings make it more likely that the recorded movements are more representative, this time period was most practical with our patient population. Similar time periods have been used in other studies7,37 and shown to be reliable.31 Future work should attempt to identify the shortest monitoring period necessary to adequately capture what an individual actually does in free living.
Conclusions
In conclusion, metrics quantified outside of treatment that characterize different aspects of movement are responsive to change in UE function. Task-specific training drives paretic UE movement significantly higher than that which occurs in the free-living environment, and the metrics have a strong association with an in-clinic measure of movement capabilities. These findings further support the notion that functional improvements observed in the clinic do not always translate to the free-living environment,4 which is where rehabilitation is intended to exert its effects. Quantifying the metrics inside and outside of clinical settings provides a means to detect this disparity. The findings reported here have the potential to inform and aid clinical practice in restoring UE function in the everyday lives of stroke survivors.
Acknowledgments
Sources of Support:
NIHT32 HD007434 & NIHF32 HD87048 (Urbin), Buchanan Family Research Fellowship (Waddell), & NIHR01 HD068290 (Lang)
Footnotes
Clinical trial registration number:
Suppliers
aActiGraph LLC, 49 East Chase Street, Pensacola, FL 32502.
Email: http://www.actigraphcorp.com/
Phone: 850-332-7900
References
- 1.Kolominsky-Rabas PL, Heuschmann PU. Incidence, etiology and long-term prognosis of stroke. Fortschr Neurol Psyc. 2002;70:657–662. doi: 10.1055/s-2002-35857. [DOI] [PubMed] [Google Scholar]
- 2.Kolominsky-Rabas PL, Weber M, Gefeller O, Neundoerfer B, Heuschmann PU. Epidemiology of ischemic stroke subtypes according to TOAST criteria – Incidence, recurrence, and long-term survival in ischemic stroke subtypes: A population-based study. Stroke. 2001;32:2735–2740. doi: 10.1161/hs1201.100209. [DOI] [PubMed] [Google Scholar]
- 3.Lai SM, Studenski S, Duncan PW, Perera S. Persisting consequences of stroke measured by the Stroke Impact Scale. Stroke. 2002;33:1840–1844. doi: 10.1161/01.str.0000019289.15440.f2. [DOI] [PubMed] [Google Scholar]
- 4.Rand D, Eng JJ. Disparity Between Functional Recovery and Daily Use of the Upper and Lower Extremities During Subacute Stroke Rehabilitation. Neurorehab Neural Re. 2012;26:76–84. doi: 10.1177/1545968311408918. [DOI] [PMC free article] [PubMed] [Google Scholar]
- 5.Preece SJ, Goulermas JY, Kenney LPJ, Howard D, Meijer K, Crompton R. Activity identification using body-mounted sensors-a review of classification techniques. Physiol Meas. 2009;30:R1–R33. doi: 10.1088/0967-3334/30/4/R01. [DOI] [PubMed] [Google Scholar]
- 6.Wade E, Chen C, Winstein CJ. Spectral analyses of wrist motion in individuals poststroke: The development of a performance measure with promise for unsupervised settings. Neurorehab Neural Re. 2014;28:169–178. doi: 10.1177/1545968313505911. [DOI] [PMC free article] [PubMed] [Google Scholar]
- 7.Michielsen ME, Selles RW, Stam HJ, Ribbers GM, Bussmann JB. Quantifying nonuse in chronic stroke patients: A study into paretic, nonparetic, and bimanual upper-limb use in daily life. Arch Phys Med Rehab. 2012;93:1975–1981. doi: 10.1016/j.apmr.2012.03.016. [DOI] [PubMed] [Google Scholar]
- 8.Bailey RR, Klaesner JW, Lang CE. An accelerometry-based methodology for assessment of real-world bilateral upper extremity activity. Plos One. 2014;9 doi: 10.1371/journal.pone.0103135. [DOI] [PMC free article] [PubMed] [Google Scholar]
- 9.Stergiou N, Decker LM. Human movement variability, nonlinear dynamics, and pathology: Is there a connection? Hum Movement Sci. 2011;30:869–888. doi: 10.1016/j.humov.2011.06.002. [DOI] [PMC free article] [PubMed] [Google Scholar]
- 10.O’Brien SR, Xue Y, Ingersoll G, Kelly A. Shorter length of stay is associated with worse functional outcomes for medicare beneficiaries with stroke. Phys Ther. 2013;93:1592–1602. doi: 10.2522/ptj.20120484. [DOI] [PubMed] [Google Scholar]
- 11.Page SJ, Sisto SA, Levine P. Modified constraint-induced therapy in chronic stroke. Am J Phys Med Rehab. 2002;81:870–875. doi: 10.1097/00002060-200211000-00013. [DOI] [PubMed] [Google Scholar]
- 12.Uswatte G, Foo WL, Olmstead H, Lopez K, Holand A, Simms LB. Ambulatory monitoring of arm movement using accelerometry: An objective measure of upper-extremity rehabilitation in persons with chronic stroke. Arch Phys Med Rehab. 2005;86:1498–1501. doi: 10.1016/j.apmr.2005.01.010. [DOI] [PubMed] [Google Scholar]
- 13.Taub E, Uswatte G, Bowman MH, et al. Constraint-induced movement therapycombined with conventional neurorehabilitation techniques in chronic stroke patients with plegic hands: A case series. Arch Phys Med Rehab. 2013;94:86–94. doi: 10.1016/j.apmr.2012.07.029. [DOI] [PMC free article] [PubMed] [Google Scholar]
- 14.Urbin MA, Bailey RR, Lang CE. Validity of body-worn sensor acceleration metric to index upper extremity function in hemiparetic stroke. J Neurol Phys Ther. doi: 10.1097/NPT.0000000000000085. [DOI] [PMC free article] [PubMed] [Google Scholar]
- 15.Birkenmeier RL, Prager EM, Lang CE. Translating animal doses of task-specific training to people with chronic stroke in 1-hour therapy sessions: A proof-of-concept study. Neurorehab Neural Re. 2010;24:620–635. doi: 10.1177/1545968310361957. [DOI] [PMC free article] [PubMed] [Google Scholar]
- 16.Lang C, Birkenmeier RL. Upper extremity task-specific training after stroke or disability. AOTA Press; 2013. [Google Scholar]
- 17.Van der Lee JH, De Groot V, Beckerman H, Wagenaar RC, Lankhorst GJ, Bouter LM. The intra- and interrater reliability of the action research arm test: A practical test of upper extremity function in patients with stroke. Arch Phys Med Rehab. 2001;82:14–19. doi: 10.1053/apmr.2001.18668. [DOI] [PubMed] [Google Scholar]
- 18.Hsieh CL, Hsueh IP, Chiang FM, Lin PH. Inter-rater reliability and validity of the Action Research arm test in stroke patients. Age Ageing. 1998;27:107–114. doi: 10.1093/ageing/27.2.107. [DOI] [PubMed] [Google Scholar]
- 19.Lyle RC. A performance test for assessment of upper limb function in physical rehabilitation treatment and research. Int J Rehabil Res. 1981;4:483–492. doi: 10.1097/00004356-198112000-00001. [DOI] [PubMed] [Google Scholar]
- 20.Beebe JA, Lang CE. Relationships and responsiveness of six upper extremity function tests during the first six months of recovery after stroke. J Neurol Phys Ther. 2009;33:96–103. doi: 10.1097/NPT.0b013e3181a33638. [DOI] [PMC free article] [PubMed] [Google Scholar]
- 21.Lang CE, Wagner JM, Dromerick AW, Edwards DF. Measurement of upper-extremity function early after stroke: Properties of the action research arm test. Arch Phys Med Rehab. 2006;87:1605–1610. doi: 10.1016/j.apmr.2006.09.003. [DOI] [PubMed] [Google Scholar]
- 22.van der Lee JH, Beckerman H, Lankhorst GJ, Bouter LM. The responsiveness of the action research arm test and the Fugl-Meyer Assessment scale in chronic stroke patients. Journal of Rehabilitation Medicine. 2001;33:110–113. doi: 10.1080/165019701750165916. [DOI] [PubMed] [Google Scholar]
- 23.Stinear CM, Barber PA, Smale PR, Coxon JP, Fleming MK, Byblow WD. Functional potential in chronic stroke patients depends on corticospinal tract integrity. Brain. 2007;130:170–180. doi: 10.1093/brain/awl333. [DOI] [PubMed] [Google Scholar]
- 24.Page SJ, Sisto S, Levine P, McGrath RE. Efficacy of modified constraint-induced movement therapy in chronic stroke: a single-blinded randomized controlled trial. Arch Phys Med Rehabil. 2004;85:14–18. doi: 10.1016/s0003-9993(03)00481-7. [DOI] [PubMed] [Google Scholar]
- 25.Van der Lee JH, De Groot V, Beckerman H, Wagenaar RC, Lankhorst GJ, Bouter LM. The intra- and interrater reliability of the action research arm test: a practical test of upper extremity function in patients with stroke. Arch Phys Med Rehabil. 2001;82:14–19. doi: 10.1053/apmr.2001.18668. [DOI] [PubMed] [Google Scholar]
- 26.Lang CE, Bland MD, Bailey RR, Schaefer SY, Birkenmeier RL. Assessment of upper extremity impairment, function, and activity after stroke: foundations for clinical decision making. J Hand Ther. 2013;26:104–114. doi: 10.1016/j.jht.2012.06.005. [DOI] [PMC free article] [PubMed] [Google Scholar]
- 27.Connell LA, Tyson SF. Clinical reality of measuring upper-limb ability in neurologic conditions: A systematic review. Arch Phys Med Rehab. 2012;93:221–228. doi: 10.1016/j.apmr.2011.09.015. [DOI] [PubMed] [Google Scholar]
- 28.Kazis LE, Anderson JJ, Meenan RF. Effect sizes for interpreting changes in health status. Med Care. 1989;27:S178–S189. doi: 10.1097/00005650-198903001-00015. [DOI] [PubMed] [Google Scholar]
- 29.Koh CL, Hsueh IP, Wang WC, et al. Validation of the Action Research Arm Test using item response theory in patients after stroke. Journal of Rehabilitation Medicine. 2006;38:375–380. doi: 10.1080/16501970600803252. [DOI] [PubMed] [Google Scholar]
- 30.Cohen J. Statistical power analysis for the behavioral sciences. 2. Hillsdale (NJ): L. Erlbaum Associates; 1988. [Google Scholar]
- 31.Bailey RR, Lang CE. Upper-limb activity in adults: Referent values using accelerometry. J Rehabil Res Dev. 2013;50:1213–1222. doi: 10.1682/JRRD.2012.12.0222. [DOI] [PMC free article] [PubMed] [Google Scholar]
- 32.Gebruers N, Truijen S, Engelborghs S, Nagels G, Brouns R, De Deyn PP. Actigraphic measurement of motor deficits in acute ischemic stroke. Cerebrovasc Dis. 2008;26:533–540. doi: 10.1159/000160210. [DOI] [PubMed] [Google Scholar]
- 33.Thrane G, Emaus N, Askim T, Anke A. Arm use in patients with subacute stroke monitored by accelerometry: Association with motor impairment and influence on self dependence. Journal of Rehabilitation Medicine. 2011;43:299–304. doi: 10.2340/16501977-0676. [DOI] [PubMed] [Google Scholar]
- 34.Taub E, Uswatte G, Mark VW, Morris DM. The learned nonuse phenomenon: implications for rehabilitation. Eura Medicophys. 2006;42:241–256. [PubMed] [Google Scholar]
- 35.Beursgens LBF, Markopoulos P, Timmermans A, Seelen H. Us’em: Motivating stroke survivors to use their impaired arm and hand in daily life. CHI; Vancouver, BC, Canada. 2011; pp. 1279–1284. [Google Scholar]
- 36.Markopoulos PTA, Beursgens L, Donselaar R, Seelen H. Us’em: The user-centered design of a device for motivating stroke patients to use their impaired arm-hand in daily life activities. 33rd Annual International Conference of the IEEE EMBS; Boston, Massachusetts. 2011; pp. 5182–5187. [DOI] [PubMed] [Google Scholar]
- 37.Lang CE, Wagner JM, Edwards DF, Dromerick AW. Upper extremity use in people with hemiparesis in the first few weeks after stroke. J Neurol Phys Ther. 2007;31:56–63. doi: 10.1097/NPT.0b013e31806748bd. [DOI] [PubMed] [Google Scholar]