Abstract
The routine tuberculosis (TB) surveillance system in Cambodia has been strengthened under the National TB Programme (NTP). This paper provides an overview of the TB surveillance data for Cambodia at the national level for the period 2000 to 2013 and at the subnational level for 2013.
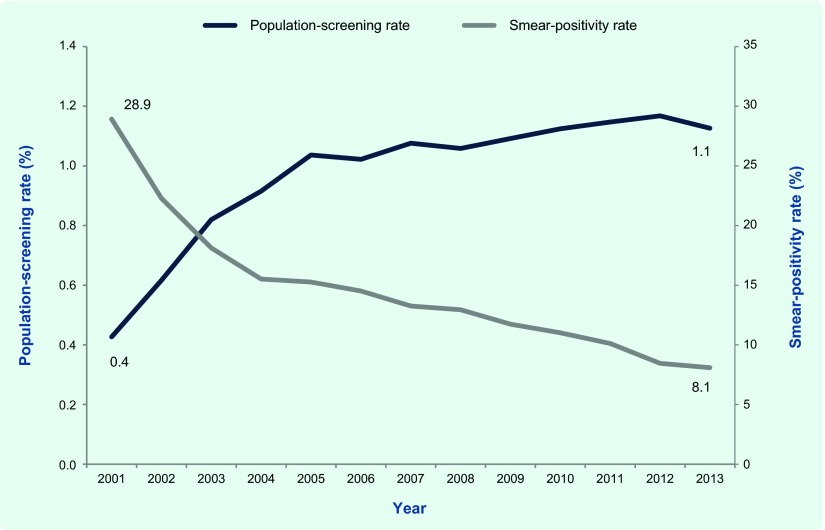
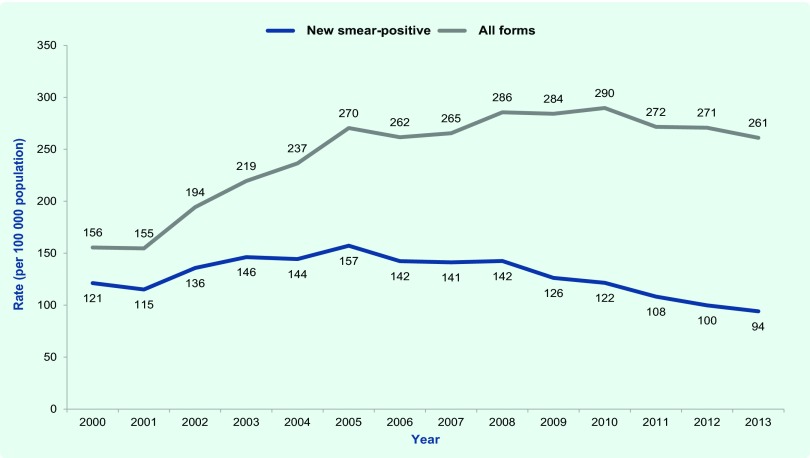
The proportion of the total population that were screened for TB rose from 0.4% in 2001 to 1.1% in 2013, while the smear-positivity rate decreased from 28.9% to 8.1% in the same period. The total number of notified TB cases increased steadily from 2000; this has stabilized in recent years with 39 055 cases notified in 2013. The proportion of all TB cases that were smear-positive decreased from 78% in 2000 to 36% in 2013. Case notification rates (CNRs) for all forms of TB and new smear-positive TB in 2013 were 261 and 94 per 100 000 population, respectively. Higher CNRs were found in the north-western and south-eastern parts of the country and were higher for males especially in older age groups.
The increase in TB screening, decline in the smear-positive rate and decline in notified smear-positive TB cases likely reflect a long-term positive impact of the NTP. A negative correlation between the proportion of the population screened and the smear-positivity rate at the subnational level helped identify where to find undiagnosed cases. Subnational differences in case notification of the elderly and in children provide more specific targets for case-finding and further encourage strategic resource allocation.
Introduction
Surveillance was one of the five core components in the original World Health Organization (WHO) Framework for Effective Tuberculosis Control (the DOTS Strategy).1 Routine surveillance data can be used to assess disease burden and epidemiological trends as well as to identify underserved populations and potential outbreaks.2 Its effective use is essential for informed programmatic decision-making.3 Tuberculosis (TB) programmes establish and maintain a recording and reporting (R&R) system with regular communication between the central and peripheral levels of the health system as its surveillance system.1,2,4
Since the relaunch of the National TB Programme (NTP) in 1994, Cambodia has strengthened its routine TB surveillance system.5,6 As in many other countries, Cambodia’s NTP has adopted a case-based registry and cohort monitoring of treatment outcomes using standardized tools in line with the WHO-recommended R&R framework.4 Recognizing the importance of evidence-based policy and practice in public health, Cambodia’s NTP has invested substantial efforts and resources in quarterly data collection and the periodic analysis of routine surveillance data and its documentation at the national level while intensifying subnational data analysis.5
This paper provides an overview of TB case-finding in Cambodia at the national level for 2000 to 2013 and the subnational level for 2013.
Methods
We performed a retrospective descriptive analysis of TB case-finding in Cambodia using routine TB surveillance data sourced from the national TB database. The data were analysed by disease category, demographic variables and geographical areas.
In the Cambodian health system, the basic organizational and reporting unit is an operational district (OD), which also serves as a basic management unit of the TB programme. Each OD provides services through health centres and district referral hospitals to an average population of 180 000.7
The standardized data collection of the TB surveillance system operates in a stepwise approach in accordance with the WHO-recommended R&R framework.4,8 A TB case register comprising a line listing of individual patient records is kept at the health centre level. This is regularly consolidated into an OD TB register that references all notified cases within the OD. Although provinces play a certain role within the reporting line, the OD TB register is the basis of a quarterly TB report from which data are entered into several national databases including case notification data by age/sex and patient/disease category, treatment outcomes and laboratory data.
The disaggregated national databases, which are maintained in Excel, were consolidated for analysis and producing tables and figures. QGIS 2.2 software (GNU General Public License, 2013) was used to produce maps depicting geographical distribution of case notification rates (CNRs).
We defined a population-screening rate as the number of suspected TB cases examined by smear microscopy divided by the total population in each year. The population-screening rate is used as a proxy to assess case-finding efforts. The smear-positivity rate was defined as the number of positive slides divided by the total number of slides examined for TB diagnosis. The smear-positivity rate is also a useful indicator to assess the impact of the programme in reducing TB prevalence.9
National population data were sourced from the WHO global TB database; subnational population data were sourced from the Cambodian Health Management Information System. Age-specific and province-specific population data were sourced from the projected population in the Census. Pearson’s correlation coefficient was used to determine any correlation between smear-positivity rate and population-screening rate, adult and childhood TB notifications and elderly and non-elderly TB notifications.
Ethics clearance was not required as this report used routinely available data and no personal identifying information was collected.
Results
TB screening and smear-positivity rate
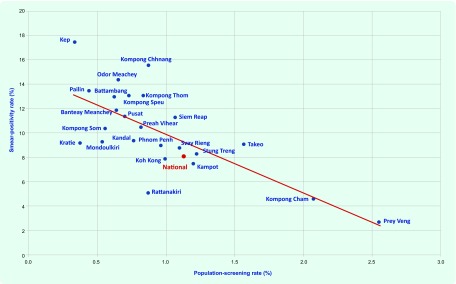
The population-screening rate for TB at the national level rose from 0.4% in 2001 to 1.1% in 2013, while the smear-positivity rate decreased from 28.9% to 8.1% over the same period (Fig. 1). By province, the population-screening rate ranged from 0.3% in Kep to 2.5% in Prey Veng, whereas the smear-positivity rate ranged from 2.7% in Prey Veng to 17.5% in Kep. There was a negative correlation between these two indicators (Pearson’s correlation coefficient –0.71, P < 0.001), suggesting that a higher smear-positivity rate is likely to be reported in provinces with a lower population-screening rate and vice versa (Fig. 2).
Fig. 1.
Population-screening rate and smear-positivity rate for TB, Cambodia, 2001–2013
Note: Population-screening rate: the number of suspected TB cases examined by smear microscopy divided by the total population in each year. Smear-positivity rate: the number of positive slides divided by the total number of slides examined for TB diagnosis.
Fig. 2.
Scatterplot of population-screening rate and smear-positivity rate by province, Cambodia, 2013*
* Population-screening rate = the number of suspected TB cases examined by smear microscopy divided by the total population in each year. Smear-positivity rate = the number of positive slides divided by the total number of slides examined for TB diagnosis.
National TB case notification
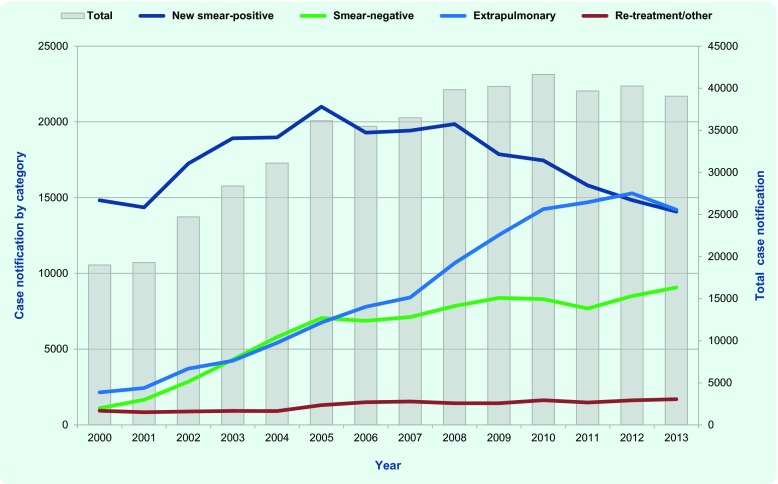
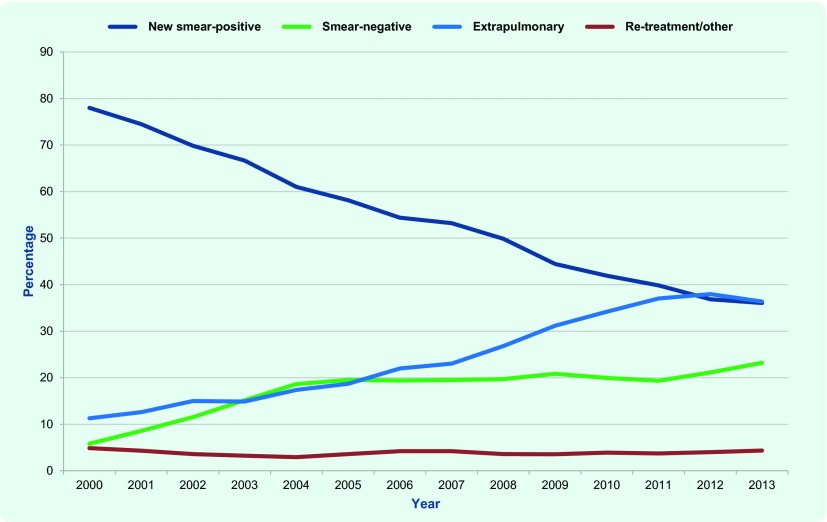
The total number of notified cases increased steadily from 19 007 to 41 628 between 2000 and 2010 (Fig. 3a) and stabilized in recent years with 39 055 cases notified in 2013. Notifications of extrapulmonary and smear-negative cases have increased consistently; since 2005, notifications of smear-positive cases have decreased (Fig. 3a and 3b). The proportion of new smear-positive cases of all TB notifications decreased from 78% in 2000 to 36% in 2013 (Fig. 3b). In 2013, the national CNR for all forms of TB and smear-positive TB were 261 and 94 per 100 000 population, respectively (Fig. 3c).
Fig. 3a.
Number of TB notifications by category, Cambodia, 2000–2013
Fig. 3b.
Proportion of TB notifications by category, Cambodia, 2000–2013
Fig. 3c.
Case notification rates for all forms of TB and smear-positive TB, Cambodia, 2000–2013
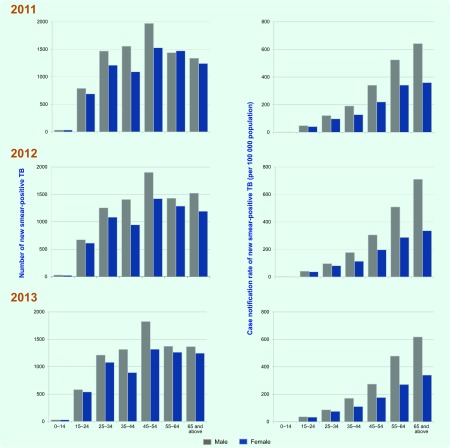
In every year from 2011 to 2013, the highest number of notifications of new smear-positive TB was reported in the 45–54 year age group (Fig. 4). Males had higher sex-specific CNRs compared with females, especially in the older age groups; males had nearly twice the CNR rate as females in the same age group (Fig. 4). The highest rate was found in males aged over 65 years in 2013 at 618 per 100 000 population, more than six times higher than the total CNR for 2013 at 94 per 100 000 population.
Fig. 4.
Number and case notification rate of new smear-positive TB cases by age and sex, Cambodia, 2011–2013
Subnational TB case notification
There are considerable differences between provinces in CNR (Fig. 5). For all forms of TB, Mondolkiri had the lowest CNR at 62 per 100 000 population; Svay Rieng’s CNR was more than seven times higher at 477 per 100 000 population. The percentage of smear-positive cases among new pulmonary cases ranged from 42.2% to 90.0% by province compared with the national figure of 60.8% (Table 1).
Fig. 5.
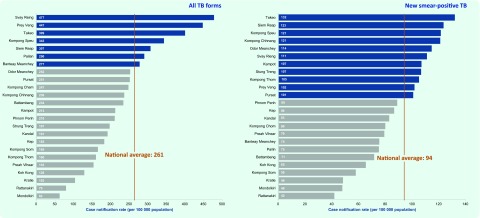
Case notification rates for all forms of TB and new smear-positive TB by province, Cambodia, 2013
Table 1. Number of notified TB cases by category and province, Cambodia, 2013.
| Province | New and relapse | New cases | Relapse | Re-treatment, excluding relapse | Total re-treatment | Other/ history known | % of smear-positive among new pulmonary | ||
|---|---|---|---|---|---|---|---|---|---|
| Smear-positive | Smear-negative | Extra-pulmonary | |||||||
| Banteay Meanchey | 2038 | 584 | 460 | 970 | 24 | 3 | 27 | 110 | 55.9 |
| Battambang | 2651 | 836 | 635 | 1147 | 33 | 9 | 42 | 74 | 56.8 |
| Kampot | 1265 | 661 | 244 | 347 | 13 | 3 | 16 | 42 | 73.0 |
| Kandal | 2635 | 1160 | 550 | 902 | 23 | 5 | 28 | 40 | 67.8 |
| Kep | 78 | 37 | 11 | 30 | 0 | 0 | 0 | 0 | 77.1 |
| Koh Kong | 181 | 92 | 30 | 58 | 1 | 0 | 1 | 0 | 75.4 |
| Kompong Cham | 4233 | 1392 | 1021 | 1766 | 54 | 17 | 71 | 62 | 57.7 |
| Kompong Chhnang | 1226 | 638 | 208 | 374 | 6 | 0 | 6 | 19 | 75.4 |
| Kompong Som | 422 | 150 | 60 | 208 | 4 | 0 | 4 | 7 | 71.4 |
| Kompong Speu | 2621 | 950 | 916 | 739 | 16 | 2 | 18 | 61 | 50.9 |
| Kompong Thom | 1078 | 711 | 157 | 204 | 6 | 0 | 6 | 4 | 81.9 |
| Kratie | 374 | 175 | 77 | 122 | 0 | 0 | 0 | 2 | 69.4 |
| Mondolkiri | 47 | 36 | 4 | 5 | 2 | 0 | 2 | 0 | 90.0 |
| National Hospital | 1310 | 369 | 377 | 488 | 76 | 13 | 89 | 121 | 49.5 |
| Odor Meanchay | 583 | 270 | 78 | 230 | 5 | 0 | 5 | 11 | 77.6 |
| Pailan City | 270 | 73 | 51 | 145 | 1 | 0 | 1 | 12 | 58.9 |
| Phnom Penh | 2107 | 1143 | 383 | 548 | 33 | 9 | 42 | 22 | 74.9 |
| Preah Vihear | 275 | 151 | 66 | 55 | 3 | 2 | 5 | 16 | 69.6 |
| Prey Veng | 4345 | 997 | 863 | 2472 | 13 | 1 | 14 | 41 | 53.6 |
| Pursat | 1075 | 439 | 305 | 321 | 10 | 0 | 10 | 19 | 59.0 |
| Rattanakiri | 132 | 72 | 12 | 44 | 4 | 1 | 5 | 4 | 85.7 |
| Siem Reap | 3067 | 1293 | 707 | 1044 | 23 | 9 | 32 | 137 | 64.7 |
| Stung Treng | 251 | 136 | 19 | 95 | 1 | 0 | 1 | 0 | 87.7 |
| Svay Rieng | 2109 | 556 | 762 | 766 | 25 | 0 | 25 | 284 | 42.2 |
| Takeo | 3370 | 1161 | 1073 | 1123 | 13 | 0 | 13 | 150 | 52.0 |
| Total | 37 743 | 14 082 | 9069 | 14 203 | 389 | 74 | 463 | 1238 | 60.8 |
ODs with high CNRs were found in the north-western and south-eastern parts of the country (Fig. 6); these are areas with major population concentration and movement within the country and high cross-border migration from and into Thailand and Viet Nam.
Fig. 6.
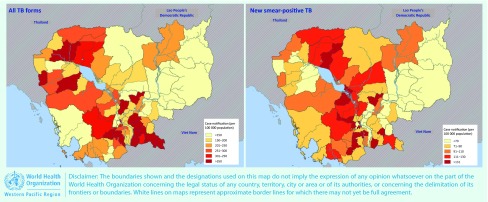
Case notification rates for all forms of TB and new smear-positive TB by operational district, Cambodia, 2013
TB notifications in the elderly
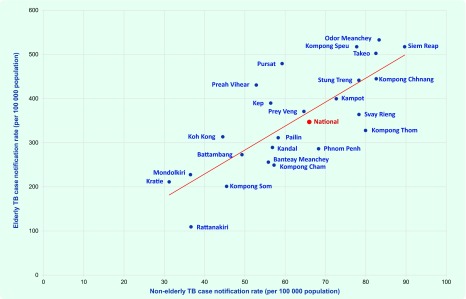
In 2013, elderly people (aged 55 or over) accounted for 37% of new smear-positive TB notifications; CNRs of smear-positive TB in the elderly and non-elderly (people aged 54 or less) were 347 and 66 per 100 000 population, respectively. By province, there was a positive correlation between elderly and non-elderly CNRs (Pearson’s correlation coefficient 0.79, P < 0.001; Fig. 7). There were some provinces that had very different CNRs in these two groups, including Rattanakiri (109 per 100 000 for the elderly and 37 per 100 000 for the non-elderly) and Odor Meanchey (533 per 100 000 for the elderly and 83 per 100 000 for the non-elderly).
Fig. 7.
Scatterplot of elderly and non-elderly case notification rates for new smear-positive TB by province, Cambodia, 2013
Note: Age-specific, province-specific population data were sourced from the projected population for 2013 in the 2008 Census and used for CNR calculation.
TB notifications in children
The NTP has expanded childhood TB services in recent years; in 2013, 13 of the 24 provinces routinely provide childhood TB services including case-finding, case management, contact tracing and provision of isoniazid preventive therapy. In 2013, the total number of TB notifications in children was 6916 (17.7% of all notified TB cases), of which 87.0% and 12.1% were extrapulmonary and smear-negative, respectively. The proportion of TB in children among total notifications ranged from 1.3% to 39.4% across provinces (Table 2). Pailin City had the highest proportion (39.4%) followed by Banteay Meanchey (36.3%) and Battambang (33.5%).
Table 2. Number of notified TB cases in children by province, Cambodia, 2013.
| Province | Total cases | Extrapulmonary | Smear-negative | All other | % of childhood TB among total notifications | Childhood TB service routinely available in 2013 | |||
|---|---|---|---|---|---|---|---|---|---|
| n | % | n | % | n | % | ||||
| Banteay Meanchey | 780 | 682 | 87.4 | 98 | 12.6 | 0 | 0.0 | 36.3 | + |
| Battambang | 915 | 697 | 76.2 | 216 | 23.6 | 2 | 0.2 | 33.5 | + |
| Kampot | 68 | 64 | 94.1 | 3 | 4.4 | 1 | 1.5 | 5.2 | + |
| Kandal | 346 | 324 | 93.6 | 22 | 6.4 | 0 | 0.0 | 12.9 | |
| Kep | 1 | 1 | 100 | 0 | 0.0 | 0 | 0.0 | 1.3 | |
| Koh Kong | 18 | 17 | 94.4 | 1 | 5.6 | 0 | 0.0 | 9.9 | |
| Kompong Cham | 870 | 801 | 92.1 | 59 | 6.8 | 10 | 1.1 | 20.2 | + |
| Kompong Chhnang | 291 | 199 | 68.4 | 85 | 29.2 | 7 | 2.4 | 23.4 | + |
| Kompong Som | 67 | 66 | 98.5 | 0 | 0.0 | 1 | 1.5 | 15.6 | + |
| Kompong Speu | 548 | 361 | 65.9 | 176 | 32.1 | 11 | 2.0 | 20.4 | + |
| Kompong Thom | 47 | 29 | 61.7 | 13 | 27.7 | 5 | 10.6 | 4.3 | + |
| Kratie | 22 | 21 | 95.5 | 1 | 4.5 | 0 | 0.0 | 5.9 | |
| Mondolkiri | 1 | 0 | 0.0 | 1 | 100 | 0 | 0.0 | 2.1 | |
| National Hospital | 138 | 99 | 71.7 | 36 | 26.1 | 3 | 2.2 | 9.6 | |
| Odor Meanchay | 157 | 150 | 96 | 6 | 3.8 | 1 | 0.6 | 26.4 | + |
| Pailan City | 111 | 105 | 94.6 | 5 | 4.5 | 1 | 0.9 | 39.4 | |
| Phnom Penh | 80 | 69 | 86 | 3 | 3.8 | 8 | 10.0 | 3.7 | |
| Preah Vihear | 17 | 16 | 94.1 | 0 | 0.0 | 1 | 5.9 | 5.8 | + |
| Prey Veng | 1433 | 1392 | 97.1 | 37 | 2.6 | 4 | 0.3 | 32.7 | |
| Pursat | 150 | 118 | 78.7 | 31 | 20.7 | 1 | 0.7 | 13.7 | + |
| Rattanakiri | 24 | 22 | 91.7 | 2 | 8.3 | 0 | 0.0 | 17.5 | |
| Siem Reap | 160 | 154 | 96.3 | 4 | 2.5 | 2 | 1.3 | 5.0 | + |
| Stung Treng | 37 | 37 | 100 | 0 | 0.0 | 0 | 0.0 | 14.7 | |
| Svay Rieng | 178 | 150 | 84.3 | 26 | 14.6 | 2 | 11 | 7.4 | + |
| Takeo | 457 | 444 | 97.2 | 9 | 2 | 4 | 0.9 | 13.0 | + |
| Total | 6916 | 6018 | 87.0 | 834 | 12.1 | 64 | 0.9 | 17.7 | |
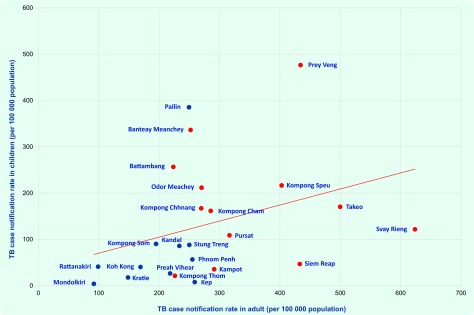
CNRs of adults and children by province were weakly correlated (Pearson’s correlation coefficient 0.34, P < 0.107; Fig. 8), suggesting the scale of case-finding and registration activities for childhood TB relative to those for adult TB varies across provinces. Although provinces such as Siem Reap and Svay Rieng had high CNRs in adults, they had relatively low CNRs in children (Fig. 8).
Fig. 8.
Scatterplot of population-screening rate and smear-positivity rate by province, Cambodia, 2013*
Red dots represent provinces with routine childhood TB services available in 2013, while blue dots represent provinces with routine childhood TB services unavailable in 2013.
Discussion
This analysis of routine TB surveillance data revealed several key findings that demonstrated improved programmatic indicators at the national level while highlighting some subnational gaps.
A decrease in new smear-positive cases provides some indication of the long-term impact of Cambodian’s NTP. Case notifications can be driven by various determinants such as changes in case-finding efforts, laboratory quality and capacity, R&R systems, case notification system as well as underlying TB incidence.10 While recognizing multiple contributors, the decrease of new smear-positive TB in Cambodia is likely due to the continued efforts of the NTP to detect and treat the most infectious cases through nationwide DOTS expansion. The National Prevalence Survey 2011 reported a 38% reduction of smear-positive TB prevalence from 2002 to 2011.11 The decrease in the smear-positivity in spite of rise in population-screening rate could be another indication of the reduced prevalence of smear-positive cases.
The increase in smear-negative and extrapulmonary TB notifications could be explained by multiple epidemiological and operational factors including the expansion of childhood TB services, nationwide implementation of targeted active case-finding using mobile X-ray equipment and improved accessibility to X-ray and biopsy services through the decentralization of TB services. Increases in smear-negative notifications could also indicate a reduction in the most infectious cases in the community. Despite the significant reduction in the prevalence of smear-positive TB, the 2011 National Prevalence Survey found a twofold higher prevalence of smear-negative, culture-positive (SNCP) cases.11 However, the notifications of smear-negative TB in 2013 was less than that of smear-positive TB (9069 vs 14 082), suggesting that many SNCP cases are still undiagnosed within the current routine diagnostic algorithm. To detect these undiagnosed SNCP cases, the existing diagnostic tool should be strengthened, for example, by promoting widespread use of X-ray and Xpert MTB/RIF assay, ensuring cost–effectiveness.
Subnational analysis can help identify areas with possible undiagnosed cases. Wong et al. found a negative association between household poverty rates and smear-positive CNR in Cambodia and highlighted the potential to geo-target areas with high poverty rates for case-finding.7 Our subnational analysis, comparing population-screening rates and smear-positivity rates, provided additional criteria for geo-targeted case-finding. Provinces with a low population-screening rate yet a high smear-positivity rate can still strengthen case-finding to help reduce the smear-positivity rate. Prioritizing these areas may ensure more effective case-finding.
Elderly TB cases accounted for 37% of the total notifications in 2013. This was lower than the 55% of smear-positive cases reported for the elderly during the 2011 National Prevalence Survey,11 suggesting that many elderly cases may still be undiagnosed. We reported on provinces with lower elderly CNRs relative to non-elderly CNRs that may have many undiagnosed elderly TB cases. These provinces may therefore benefit from interventions that systematically screen the elderly for TB.
Internationally, the proportion of TB in children among total notifications varies from 3% to more than 25%.12 Through rapidly expanding childhood TB services in Cambodia’s NTP, the proportion of TB notifications in children in 2013 reached 17.7% of all notifications; however, subnational differences exist. Differences at the subnational level in the proportion of childhood TB, as well as CNRs in children relative to CNRs in adults, may help identify areas with possible over-diagnosis or underreporting. For instance, provinces with high CNR in adults but low CNR in children may have many undiagnosed or unreported childhood TB cases. In Cambodia, where the role of the private sector in public health programmes has been rapidly expanding, engagement of the private sector in national TB surveillance system needs strengthening. Given the complexity in diagnosing childhood TB that requires thorough assessment of all evidence,13 possible over-diagnosis of TB in children should be investigated in provinces with high CNRs in children but relatively low CNRs in adults.
There are some inherent limitations in using surveillance data. Although the NTP has a strengthened R&R system, including training and supervision, the reliability of the data is heavily dependent on local facility and staff capacity. Operational challenges in nationwide data collection using paper-based forms and manual data entry might have led to inconsistencies in some of the data reported. While Public-Private Mix initiatives to control TB have recently expanded, TB patients diagnosed in the private sector may not be notified to the NTP, limiting the capture of all TB cases. TB notification may not be a direct measure or close proxy of TB incidence, particularly when the level of case detection is insufficient.3,7
In many developing countries, TB surveillance data is often underutilized despite substantial resources invested in the data collection and its availability. For effective use of surveillance data, subnational analysis should be strengthened as it can provide robust evidence to set criteria for geo-targeted case-finding. If combined with a demographic-targeted approach, the subnational analysis enables the progamme to target a more specific segment of the population, which further encourages strategic resource allocation. However, strengthening data quality and management is of particular importance at every level to ensure reliability and validity of the analysis. Increasing efforts should be encouraged to create and maintain a well designed database enabling systematic data entry and analysis. Similarly, existing data verification tools and methods to ensure internal/external consistency of surveillance data should be actively employed.14 Development of innovative tools to reproduce graphics and tables could further facilitate the periodic data analysis and dissemination at different operational levels, which helps motivate programme staff in their routine activities. Finally, the ultimate goal of such analyses is to explore reasons behind the findings and inform corrective actions, always involving diverse voices from the field.
Acknowledgements
The authors wish to thank all health-care workers at the front lines of service delivery of TB diagnosis and treatment in Cambodia. The authors extend our thanks to all staff members of the national and subnational tuberculosis programmes of Cambodia for their tremendous efforts in data collection and reporting.
Conflicts of interest
None declared.
Funding
None.
References
- 1.The Stop TB Strategy. Geneva: World Health Organization; 2006. Building on and enhancing DOTS to meet the TB-related Millennium Development Goals. http://www.who.int/tb/publications/2006/stop_tb_strategy.pdf, accessed 28 January 2015. [Google Scholar]
- 2.Nishikiori N, Morishita F. Using tuberculosis surveillance data for informed programmatic decision-making. Western Pacific Surveillance and Response Journal. 2013;4(1):1–3. doi: 10.5365/wpsar.2013.4.1.007. [DOI] [PMC free article] [PubMed] [Google Scholar]
- 3.Castro KG. Tuberculosis surveillance: data for decision-making. Clinical Infectious Diseases. 2007;44:1268–70. doi: 10.1086/514351. [DOI] [PubMed] [Google Scholar]
- 4.Revised TB recording and reporting forms and registers – version 2006. Geneva: World Health Organization; 2006. http://www.who.int/tb/err/rr_final_forms_en.pdf, accessed 28 January 2015. [Google Scholar]
- 5.Tuberculosis Report 2013 – Kingdom of Cambodia. Phnom Penh: National Center for Tuberculosis and Leprosy Control, Ministry of Health; 2014. [Google Scholar]
- 6.Hill PS, Tan Eang M. Resistance and renewal: health sector reform and Cambodia’s national tuberculosis programme. Bulletin of the World Health Organization. 2007;85:631–6. doi: 10.2471/BLT.06.036822. [DOI] [PMC free article] [PubMed] [Google Scholar]
- 7.Wong MK, et al. The association between household poverty rates and tuberculosis case notification rates in Cambodia, 2010. Western Pacific Surveillance and Response Journal. 2013;4:25–33. doi: 10.5365/wpsar.2013.4.1.002. [DOI] [PMC free article] [PubMed] [Google Scholar]
- 8.Revised definitions and reporting framework for tuberculosis. Geneva: World Health Organization; 2013. http://apps.who.int/iris/bitstream/10665/79199/1/9789241505345_eng.pdf, accessed 28 January 2015. [PubMed] [Google Scholar]
- 9.Frieden T, editor. Toman’s tuberculosis case detection, treatment and monitoring: questions and answers, Second edition. Geneva: World Health Organization; 2004. http://whqlibdoc.who.int/publications/2004/9241546034.pdf, accessed 28 January 2015. [Google Scholar]
- 10.Tuberculosis in the region of the Americas – Regional Report 2011 Epidemiology, Control and Financing. Washington, DC: Pan American Health Organization, Regional Office for the Americas of the World Health Organization; 2012. http://www.paho.org/hq/index.php?option=com_docman&task=doc_view&gid=22953&Itemid=, accessed 28 January 2015. [Google Scholar]
- 11.Report: Second National Tuberculosis Prevalence Survey Cambodia, 2011. Phnom Penh: National Center for Tuberculosis and Leprosy Control, Ministry of Health; 2012. [Google Scholar]
- 12.Guidance for national tuberculosis programmes on the management of tuberculosis in children. Geneva: World Health Organization; 2006. http://whqlibdoc.who.int/hq/2006/WHO_HTM_TB_2006.371_eng.pdf, accessed 28 January 2015. [PubMed] [Google Scholar]
- 13.Guidance for national tuberculosis programmes on the management of tuberculosis in children, Second edition. Geneva: World Health Organization; 2014. http://apps.who.int/medicinedocs/documents/s21535en/s21535en.pdf, accessed 28 January 2015. [PubMed] [Google Scholar]
- 14.Standards and benchmarks for tuberculosis surveillance and vital registration systems: checklist and user guide. Geneva: World Health Organization; 2014. http://apps.who.int/iris/bitstream/10665/112673/1/9789241506724_eng.pdf, accessed 28 January 2015. [Google Scholar]


