Abstract
In nanopore sequencing, where single DNA strands are electrophoretically translocated through a nanopore and the resulting ionic signal is used to identify the four DNA bases, an enzyme has been used to ratchet the nucleic acid stepwise through the pore at a controlled speed. In this work, we investigated the ability of αHL nanopores to distinguish the four DNA bases under conditions that are compatible with the activity of DNA-handling enzymes. Our findings suggest that in immobilised strands, the applied potential exerts a force on DNA (~ 10 pN at +160 mV) that increases the distance between nucleobases by about 2.2 Å/V. The four nucleobases can be resolved over wide ranges of applied potentials (from +60 mV to +220 mV in 1 m KCl) and ionic strengths (from 200 mM KCl to 1 M KCl at +160 mV) and nucleobase recognition can be improved when the ionic strength on the side of the DNA-handling enzyme is low, while the ionic strength on the opposite side is high.
Keywords: ionic strength, DNA stretching, electroosmosis, single-molecule DNA sequencing
Introduction
Nanopores have emerged as powerful tools for single-molecule characterisation. One of the most sought after application is label-free, low-cost and rapid DNA sequencing. In nanopore sequencing single stranded DNA (ssDNA) molecules are electrophoretically driven through the nanopore and individual the nucleotides identify by ionic current recordings.
Although the fabrication of nanopores in thin solid-state membranes such as silicon nitride1 or graphene2-4 is constantly improving, it is likely that the initial commercialised devices will use genetically engineered biological nanopores, which can be easily and reproducibly modified to tune the nanopore properties with atomic precision.5 Experimental studies with the alpha-hemolysin (αHL)6 or Mycobacteria smegmatis porin A (MspA)7 using immobilized DNA strands have already demonstrated that biological nanopores are capable of distinguishing all four DNA nucleotides,8-12 including their most common modifications,13,14 in a wide range of pH range15 via ionic current measurements.
A common problem with using nanopores for single-molecule DNA analysis has long been the fast translocation speed of the polymer through a nanopore. Several approaches have been attempted to reduce and control the speed of DNA transport, including lowering the temperature,16 increasing the viscosity17 of the solution or modifying the vestibule of the nanopore by introducing positive charged residues.18 These attempt, however, only had a modest effect as they also reduce the ionic current signal. The coupling with DNA polymerase enzymes that sequentially displace individual nucleobases and feed the DNA through a nanopore has shown to be successful.12,19-21 Such enzymes, however, require specific electrophoretic conditions to keep the DNA processing enzymes operational that might not be compatible with the conditions necessary to recognize individual nucleobases. In this work we first analyse the electrophoretic forces that stretch DNA inside the αHL biological nanopore and then we study the conditions of applied potential and ionic strength that are compatible with the activity of DNA-handling enzymes and allow the recognition of the four DNA nucleobases by ionic current recordings.
Results and discussion
DNA Elongation
We analysed biotinylated ssDNA molecules in complex with streptavidin, where the DNA is allowed to thread through the nanopore and the biotin:streptavidin complex prevents the full translocation of the nucleic acid. This configuration mimics the pauses between base additions in enzymatic nanopore sequencing, during which the DNA strand is held within the pore lumen and stretched in the applied potential. DNA threading is manifested by the reduction of the open pore current (IO) to a blocked pore current (IB), and we quote the residual current (IRES) as a percentage of the open pore current. The ssDNA molecules are captured by the nanopore at +200mV and then the bias is reduced to +40 mV in 20 mV steps by using an automated voltage protocol. At potential lower than +100 mV DNA occasionally retreated out of the nanopore, as observed by stepwise increases of the ionic current.
A DNA molecule with a charge density Q translocating through the nanopore experiences an electrophoretic driving force, FEF = VbiasQ, due to the electric field in the nanopore. For dsDNA inside solid-state nanopores the amplitude of the effective driving force (Feff) on DNA has been measured directly by optical tweezers or indirectly, and has been found to vary between 240 to 100 pN V−1 depending on the nanopore size, geometry and the solution ionic strength.22-25 DNA also experiences forces that oppose DNA translocation, being a stochastic thermal (Brownian) force from random molecular collisions that is strongly influenced by the electroosmotic-induced flow field.26 MD simulations showed that the electroosmotic flow that develops near the DNA surface and is driven by the motion of counterions can reverse the effective electrophoretic force on DNA.27 Interactions between the nanopore surface and the DNA are usually ignored. Hence, the effective force on the DNA inside the pore (Fef) should include the electrical force on DNA’s bare charge (FEF) and the drag force due to electro-osmotic flow (EOM) inside the nanopore (FEOM): Feff = FEF – FEOM.23,24 Therefore, the threaded DNA strands in our experiments will escape the nanopore when FEF ~ FEOM and Feff approaches DNA thermal fluctuations, which for the alpha hemolysin wild type (αHL-WT) nanopore is at potentials lower than 80-100 mV.28-30
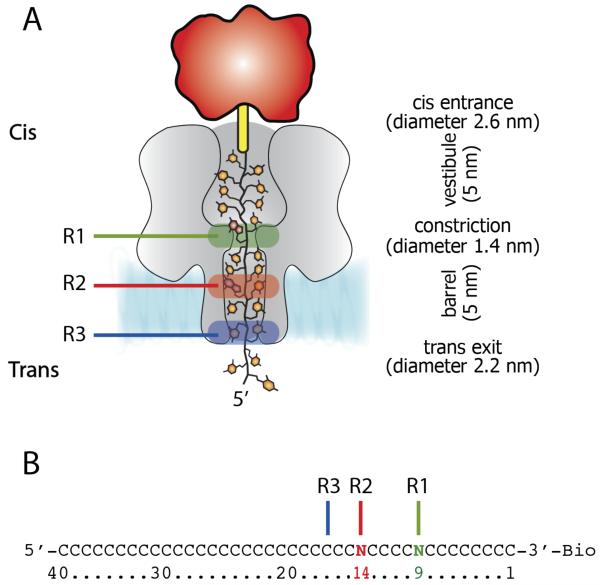
The WT-αHL β-barrel contains three nucleobase recognition points, named R1, R2, and R3 (Figure 1A), which are capable of discriminating between individual bases in immobilized ssDNA molecules. Recognition point R1 is located at the central constriction. At +160 mV and with immobilized DNA strands R1 in the WT pore recognizes bases at positions 8 to 11 in with a peak at position 9 (Figure 1B). R2 is located near the middle of the β-barrel and recognizes bases 13 to 15 (peak at position 14 at +160 mV), and R3 is located near the trans entrance of the pore and recognizes bases 16 to 20 (peak at position 17 at +160 mV, Figure 1B).31 While WT-αHL can discriminate differences between A,T,C and G only at position R2, the 2N-αHL (E111N/K147N) mutant increased the residual current during DNA blockade thus improved nucleobase recognition.8 2N-αHL pores could discriminate differences between all four DNA bases at R2 and R3 but not at R1.9 Among the αHL mutants that are able to recognize the 4 DNA bases at R1, 2N/M113Y (E111N/M113Y/K147N) showed the best characteristics.9
Figure 1.
DNA immobilized within the αHL nanopore. A) Cartoon representation of a homopolymeric DNA oligonucleotide immobilized inside an αHL pore (grey) through the use of a 3′ biotin-TEG (yellow)-streptavidin (red)complex. The green, red and blue boxes represent R1, R2 and R3 recognition sites, respectively. B) The sequences of the oligonucleotides with single nucleobase substitutions at position 9 (green) and 14 (red) that were used to probe R1 and R2, respectively. The recognition site R3 is shown as a blue line.
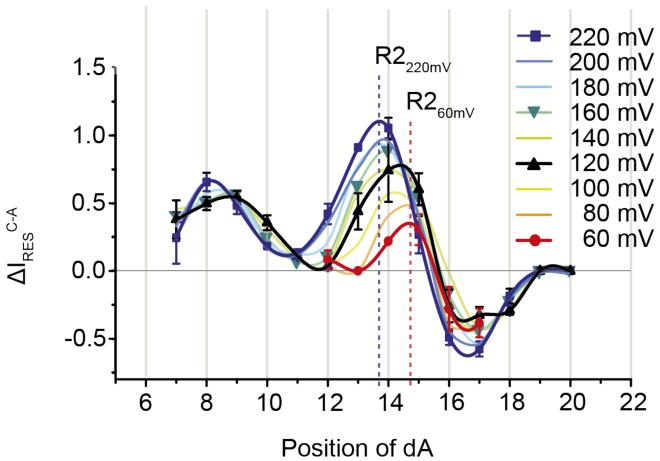
In immobilised DNA strands, Stoddart et al showed that at +160 mV substitutions in about 12 DNA bases changed the ionic output signal of WT-αHL and 2N-αHL nanopores;8 while for freely translocating short oligonucleotides Meller et al found that 12 nucleobases occupy the barrel of WT-αHL nanopores at +120 mV.22 Let be exactly 12 DNA bases in the 5 nm αHL barrel in immobilised strands at +160 mV, than the inter-base distance between nucleobases is ~4.2 Å, which corresponds to the average inter-base distance found in ssDNA molecule stretched by optical tweezers with a force of about 10 pN.32 We investigated the voltage dependent stretching of ssDNA by probing the recognition of the WT-αHL pore with a set of 14 poly(dC) oligos containing a single dA at different positions relative to the biotinylated 3′ end (from position 7 to position 20, Figure 1). ΔIRES [with respect from poly(dC)] from +60, to +220 mV were then plotted against the position of the adenine nucleotide (Figure 2). At +220 mV, the peak of R2 recognition was shown for ssDNA containing dA at position near 14, while at +60 mV the peak of R2 recognition was shifted by almost exactly one nucleobase to the position near 15 (Figure 2). At intermediate applied potentials the peak of R2 recognition lied at intermediate positions, suggesting that over 160 mV the DNA immobilised within the nanopore is stretched by the length of approximately one nucleobase. Therefore, assuming the DNA inside the lumen of the pore is uniformly stretched and exactly 12 nucleobases fill the αHL barrel at +160 mV, the occupancy of the αHL barrel by the DNA changes from ~12.5 to ~11.5 nucleobases from +60 to +220 mV, indicating that the inter-base distance between the nucleobases inside the β-barrel increased by about 2.2 Å/V. It should be noted, however, that it is possible that the DNA inside the pore is stretched less in the β-barrel than in the vestibule, where it is less constrained.
Figure 2.
Voltage dependence of the discrimination of a single adenine nucleotide by αHL-WT nanopores. The graph indicates the differences in residual current (ΔIRES values) between blockades caused by nucleotide blockades caused by poly(dC)40 and a poly(dC) oligonucleotide containing a single adenine for αHL-WT nanopores from +60 to +220 mV. The data at +60 mV (red), +120 mV (Black), +160 mV (green) and +220 mV (Blue) are shown as lines and symbols. For the sake of clarity, the symbols at other potentials are omitted. The data points were connected with a smoothed line function (Microsoft Excel), which provided three peaks corresponding to the three recognition sites. The vertical dotted lines indicate the theoretical peaks for nucleobase recognition at the two extremes of applied potentials.
Nucleobase recognition at different voltages and ionic strengths
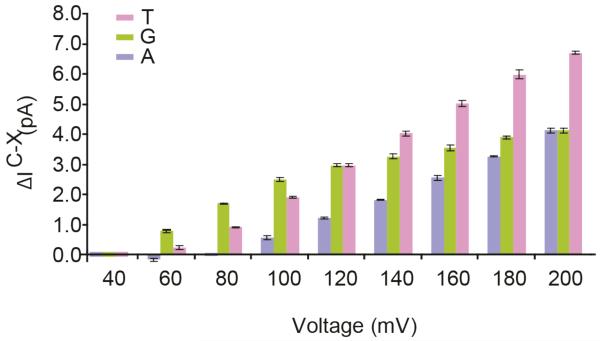
In order to sequence DNA with a nanopore, the rapid translocation of DNA through the pore is controlled by enzymes,12,21,33,34 the activities of which depend on the ionic concentration of the solution and the pulling force applied on the nucleic acid. We tested the voltage dependence of the recognition of individual bases at R1 by using the 2N/M113Y αHL mutant in 1 M KCl (Figure 3) by using four poly dC oligos containing A,C,T and G at position 9 (Figure 1B). The difference between the IB of poly(dC)40 and the oligonucleotides containing A and T (ΔIRESC-A and ΔIRESC-T ) at position 9 increased almost linearly with the applied potential, in parallel with the increase in the ionic current through the DNA blocked pores with the applied potential. By contrast, the voltage dependence of the IB difference of the oligonucleotides containing G (ΔIRESC-G) at position 9 was biphasic (Figure 3): From +60 to +100 mV ΔIRESC-G increased in parallel with ΔIRESC-A and ΔIRESC-T, while at applied potentials higher than +120 mV the increase of ΔIRESC-G was less rapid (Figure 3). As a consequence, the IRES values for the four nucleobases could be separated at voltages higher than +60 mV, with the exception of +120 mV, where T9 and G9 showed the same IRES value and at +200 mV, where G9 and A9 showed identical IRES values. The recognition profile in αHL appears relatively diffused, with multiple contiguous bases showing similar recognition (Figure 2). Therefore, as also observed with MspA nanopores,35 it is likely that each recognition sites in αHL nanopores reads three or four nucleobases simultaneously. Hence, the voltage dependence of nucleobase recognition might be explained by the base at position 9 moving away from the centre of the recognition site to a position where the ΔIRESC-G signal is reduced (but not that of ΔIRESC-A and ΔIRESC-T) as the DNA is stretched in the applied potential.
Figure 3.
Voltage dependence of the discrimination of the four DNA nucleotides at position 9 by αHL-2N/M113Y nanopore. The residual current is between the oligonucleotides containing A, T, and G at position 9 and the oligonucleotide containing a C at position 9 (ΔIRESX-C = IRESX - IRESC).
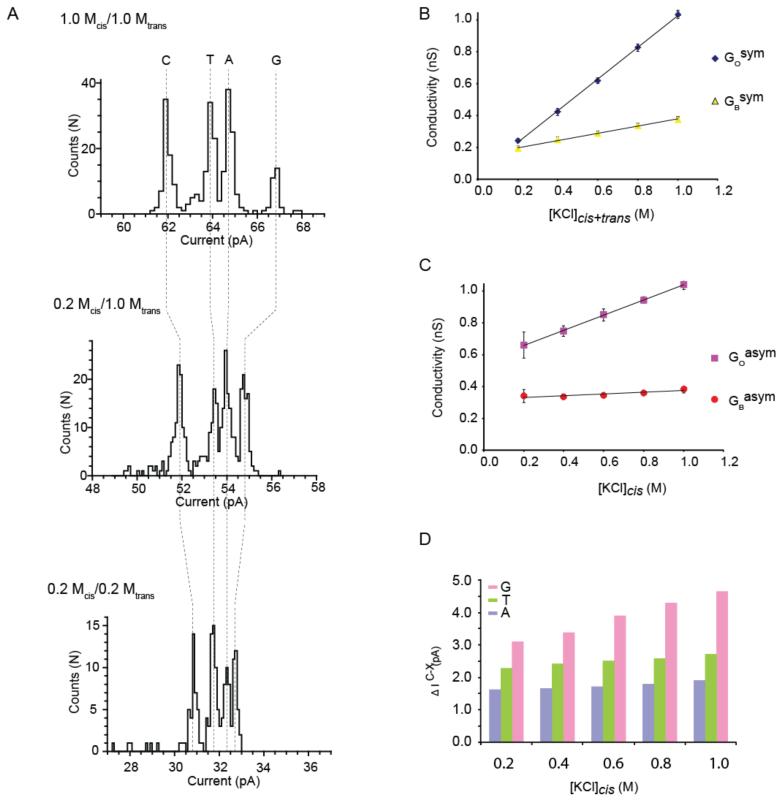
The effect of the ionic strength on nucleobase recognition was tested by sampling 2N-αHL mutant with the four poly(dC) oligos containing A,C,T and G at position 14 (R2) when the ionic strength of the solution was varied from 1 M KCl to 200 mM KCl in both compartments. Although the separation between the nucleobases decreased with the ionic strength of the solution, we found that 2N-αHL pores separated C, T, A, and G nucleobase at all ionic strengths tested (Figure 4A). Both the conductance of the nanopore (GOsym) and the DNA blocked pore (GBsym ) decreased with the ionic strength of the solution. However, while GO correlated linearly with the conductivity of the cis and trans solutions (Figure 4B, blue diamonds), GB decreased less rapidly (Figure 4B, yellow triangles). For example, an 80% reduction of the conductivity of the cis and trans solutions resulted in ~80% reduction in GOsym and ~50% reduction of GBsym. This effect, which has been observed with solid-state nanopores36 and ion channels,37 has been explained in terms of an additional ionic current through DNA blocked pores that is due to counter ions (K+ ions this case) accumulating along the DNA polymer or near the surface charged of the nanopores.36
Figure 4.
Dependency of the blocked pore currents on the ionic strength of cis and trans solutions for the αHL-2N pore at +160 mV. A) histograms of the blocked pore current levels for 4 poly(dC) oligonucleotides each containing either a single C, T, A, G nucleotide at position 14. The solution contained 1 M KCl in both cis and trans chambers (top), 0.2 M KCl in the cis chamber and 1 M in trans chamber (middle) or 0.2 M KCl in cis and trans chambers (bottom). B) the dependence of the open pore conductance (GO) and pore conductance in the presence of threaded poly(dC)40 oligonucleotide (GB) on the ionic strength of cis and trans solutions. C) the relationship of the open and blocked pore conductivities for a poly(dC)40 oligonucleotide on the ionic strength of the cis solution while keeping the ionic strength in the trans solution constant at 1 M KCl. D) Discrimination of the four DNA nucleotides in asymmetric salt conditions. The graph indicates the dependence of the differences in residual current between the oligonucleotides containing A, T, and G at position 14 and the a poly(dC)40 nucleotide (ΔIRESX-C = IRESX - IRESC) on the ionic strength of the cis solution. The trans solution was maintained at 1M KCl.
DNA blocked nanopores are cation selective (PK+/PCl = >100 when the cis and trans sides contain 300 and 500 mM KCl, respectively38), indicating that in DNA blocked nanopores most charge carriers are K+ ions that at positive applied potential translocate through the pore from the trans to the cis compartment.39 Therefore, we tested nucleobase recognition when the ionic strength of the solution was reduced in cis compartment alone. Our reasoning was that the cis compartment is more likely to host a DNA handling enzyme,12,21,33,34 the activity of which is usually sensitive to high ionic strength, while the trans compartment would provide the pool of K+ ions that recognize the nucleobase. As expected, we found that the four nucleobases were better separated when the ionic strength of the trans compartment was maintained at 1 M KCl (Figure 4A). Interestingly, we found that in asymmetric ionic solutions, the GOasym was the average of the values measured in symmetric solutions [i.e. GO0.2M cis/1M trans = (GO1M cis/trans + GO0.2M cis/trans)/2]. By contrast, the IBasym values hardly decreased with the ionic strength of the cis chamber (GB0.2M cis/1M trans = 0.88 GB1M cis/trans, Figure 4C), further suggesting that most of the current through the DNA blocked pore arises from the translocation of K+ from trans to cis. In asymmetric solution the difference between the IB of poly(dC)40 and the oligonucleotides containing A and T at position 14 did not vary significantly with the ionic strength of the cis solution, while the IB difference of the oligonucleotides containing G at position 14 decreased to about 1/3 of the initial value as the ionic strength of the cis solution is reduced to 0.2 M KCl (Figure 4D).
Conclusions
In this work we have investigated the effect of the applied potential and ionic strength on nucleobase recognition for nanopore sequencing applications. Although nucleobase recognition was the strongest when the blocked pore current was high, we found that the four nucleobases could be identified at +60 mV in 1 M KCl or at +160 mV in 200 mM KCl. In addition, if low ionic strengths are required in the cis chamber, for example to employ an enzyme to feed DNA through the pore, nucleobase recognition can be augmented by using high ionic strengths in the trans chamber. The voltage and ionic strength dependence of nucleobase recognition provided other insights that might be useful in nanopore sequencing applications. For example, we estimated that the applied potential stretches the DNA inside the pore by about 2.2 Å/V and that enzymes that ratchet DNA through the pore should be able to withstand a pulling force of at least 10 pN.
Methods
Preparation of αHL pores
Heptameric αHL proteins were prepared in vitro as described in detail.40 In short, proteins were produced by expression in an E. coli in vitro transcription and translation (IVTT) system and assembled into heptamers on rabbit blood cell membranes. The heptamers were run in a 5% SDS-polyacrylamide gel and the region of the dried gel containing αHL heptamers was cut out, rehydrated and crushed in 10 mM Tris.HCl, pH 8.0, containing 100 μM EDTA. Aliquots of the purified proteins were stored at −80°C.
Electrical recordings
Ionic currents were measured by recording from planar bilayers formed from diphytanoyl-sn-glycero-3-phosphocholine (Avanti Polar Lipids, Alabaster, AL). Currents were measured with Ag/AgCl electrodes by using a patch-clamp amplifier (Axopatch 200B, Axon Instruments, Foster City, CA) as described in detail.41 The solution of the cis and trans chambers were exchanged manually from buffered solutions in 1M KCl by replacing aliquots with buffered solutions containing no salt. Amplified electrical signals were low-passed filtered at a corner frequency of 10 kHz and data acquisition was performed at a sampling frequency of 50 kHz.
Acknowledgement
We thank the European Research Council (European Commission’s Seventh Framework Programme, project n° 260884).
References
- (1).Li J, Stein D, McMullan C, Branton D, Aziz MJ, Golovchenko JA. Nature. 2001;412:166. doi: 10.1038/35084037. [DOI] [PubMed] [Google Scholar]
- (2).Merchant CA, Healy K, Wanunu M, Ray V, Peterman N, Bartel J, Fischbein MD, Venta K, Luo Z, Johnson AT, Drndic M. Nano Lett. 2010;10:2915. doi: 10.1021/nl101046t. [DOI] [PubMed] [Google Scholar]
- (3).Schneider GF, Kowalczyk SW, Calado VE, Pandraud G, Zandbergen HW, Vandersypen LM, Dekker C. Nano Lett. 2010;10:3163. doi: 10.1021/nl102069z. [DOI] [PubMed] [Google Scholar]
- (4).Garaj S, Hubbard W, Reina A, Kong J, Branton D, Golovchenko JA. Nature. 2010;467:190. doi: 10.1038/nature09379. [DOI] [PMC free article] [PubMed] [Google Scholar]
- (5).Maglia G, Rincon Restrepo M, Mikhailova E, Bayley H. Proc Natl Acad Sci U S A. 2008;105:19720. doi: 10.1073/pnas.0808296105. [DOI] [PMC free article] [PubMed] [Google Scholar]
- (6).Song L, Hobaugh MR, Shustak C, Cheley S, Bayley H, Gouaux JE. Science. 1996;274:1859. doi: 10.1126/science.274.5294.1859. [DOI] [PubMed] [Google Scholar]
- (7).Faller M, Niederweis M, Schulz GE. Science. 2004;303:1189. doi: 10.1126/science.1094114. [DOI] [PubMed] [Google Scholar]
- (8).Stoddart D, Heron AJ, Mikhailova E, Maglia G, Bayley H. Proc Natl Acad Sci U S A. 2009;106:7702. doi: 10.1073/pnas.0901054106. [DOI] [PMC free article] [PubMed] [Google Scholar]
- (9).Stoddart D, Heron AJ, Klingelhoefer J, Mikhailova E, Maglia G, Bayley H. Nano Lett. 2010;10:3633. doi: 10.1021/nl101955a. [DOI] [PMC free article] [PubMed] [Google Scholar]
- (10).Stoddart D, Maglia G, Mikhailova E, Heron AJ, Bayley H. Angew. Chem. Int. Ed. 2010;49:556. doi: 10.1002/anie.200905483. [DOI] [PMC free article] [PubMed] [Google Scholar]
- (11).Derrington IM, Butler TZ, Collins MD, Manrao E, Pavlenok M, Niederweis M, Gundlach JH. Proc Natl Acad Sci U S A. 2010;107:16060. doi: 10.1073/pnas.1001831107. [DOI] [PMC free article] [PubMed] [Google Scholar]
- (12).Manrao EA, Derrington IM, Laszlo AH, Langford KW, Hopper MK, Gillgren N, Pavlenok M, Niederweis M, Gundlach JH. Nat. Biotechnol. 2012;30:349. doi: 10.1038/nbt.2171. [DOI] [PMC free article] [PubMed] [Google Scholar]
- (13).Wallace EV, Stoddart D, Heron AJ, Mikhailova E, Maglia G, Donohoe TJ, Bayley H. Chem Commun (Camb) 2010;46:8195. doi: 10.1039/c0cc02864a. [DOI] [PMC free article] [PubMed] [Google Scholar]
- (14).Schibel AE, An N, Jin Q, Fleming AM, Burrows CJ, White HS. J Am Chem Soc. 2010;132:17992. doi: 10.1021/ja109501x. [DOI] [PMC free article] [PubMed] [Google Scholar]
- (15).Franceschini L, Mikhailova E, Bayley H, Maglia G. Chem Commun (Camb) 2012;48:1520. doi: 10.1039/c1cc16124e. [DOI] [PMC free article] [PubMed] [Google Scholar]
- (16).Meller A, Nivon L, Brandin E, Golovchenko J, Branton D. Proc Natl Acad Sci U S A. 2000;97:1079. doi: 10.1073/pnas.97.3.1079. [DOI] [PMC free article] [PubMed] [Google Scholar]
- (17).Kawano R, Schibel AE, Cauley C, White HS. Langmuir. 2009;25:1233. doi: 10.1021/la803556p. [DOI] [PubMed] [Google Scholar]
- (18).Rincon-Restrepo M, Mikhailova E, Bayley H, Maglia G. Nano Lett. 2011;11:746. doi: 10.1021/nl1038874. [DOI] [PMC free article] [PubMed] [Google Scholar]
- (19).Chu J, Gonzalez-Lopez M, Cockroft SL, Amorin M, Ghadiri MR. Angew Chem Int Ed Engl. 2010;49:10106. doi: 10.1002/anie.201005460. [DOI] [PMC free article] [PubMed] [Google Scholar]
- (20).Cockroft SL, Chu J, Amorin M, Ghadiri MR. J. Am. Chem. Soc. 2008;130:818. doi: 10.1021/ja077082c. [DOI] [PMC free article] [PubMed] [Google Scholar]
- (21).Olasagasti F, Lieberman KR, Benner S, Cherf GM, Dahl JM, Deamer DW, Akeson M. Nat Nanotechnol. 2010;5:798. doi: 10.1038/nnano.2010.177. [DOI] [PMC free article] [PubMed] [Google Scholar]
- (22).Meller A, Nivon L, Branton D. Phys. Rev. Lett. 2001;86:3435. doi: 10.1103/PhysRevLett.86.3435. [DOI] [PubMed] [Google Scholar]
- (23).Lu B, Hoogerheide DP, Zhao Q, Yu D. Physical Review E. 2012;86:011921. doi: 10.1103/PhysRevE.86.011921. [DOI] [PubMed] [Google Scholar]
- (24).Lu B, Albertorio F, Hoogerheide DP, Golovchenko JA. Biophys J. 2011;101:70. doi: 10.1016/j.bpj.2011.05.034. [DOI] [PMC free article] [PubMed] [Google Scholar]
- (25).Keyser UF, van der Does J, Dekker C, Dekker NH. Rev. Sci. Instrum. 2006;77:105105. [Google Scholar]
- (26).Luan B, Aksimentiev A. Phys Rev E Stat Nonlin Soft Matter Phys. 2008;78:021912. doi: 10.1103/PhysRevE.78.021912. [DOI] [PMC free article] [PubMed] [Google Scholar]
- (27).Luan B, Aksimentiev A. Journal of physics. Condensed matter: an Institute of Physics journal. 2010;22:454123. doi: 10.1088/0953-8984/22/45/454123. [DOI] [PMC free article] [PubMed] [Google Scholar]
- (28).Henrickson SE, Misakian M, Robertson B, Kasianowicz JJ. Phys Rev Lett. 2000;85:3057. doi: 10.1103/PhysRevLett.85.3057. [DOI] [PubMed] [Google Scholar]
- (29).Mathé J, Aksimentiev A, Nelson DR, Schulten K, Meller A. Proc Natl Acad Sci US A. 2005;102:12377. doi: 10.1073/pnas.0502947102. [DOI] [PMC free article] [PubMed] [Google Scholar]
- (30).Wiggin M, Tropini C, Tabard-Cossa V, Jetha NN, Marziali A. BiophysJ. 2008;95:5317. doi: 10.1529/biophysj.108.137760. [DOI] [PMC free article] [PubMed] [Google Scholar]
- (31).Stoddart D, Heron A, Mikhailova E, Maglia G, Bayley H. Proc. Natl. Acad. Sci. USA. 2009;106:7702. doi: 10.1073/pnas.0901054106. [DOI] [PMC free article] [PubMed] [Google Scholar]
- (32).Bustamante C, Smith SB, Liphardt J, Smith D. Curr Opin Struct Biol. 2000;10:279. doi: 10.1016/s0959-440x(00)00085-3. [DOI] [PubMed] [Google Scholar]
- (33).Hornblower B, Coombs A, Whitaker RD, Kolomeisky A, Picone SJ, Meller A, Akeson M. Nat Methods. 2007;4:315. doi: 10.1038/nmeth1021. [DOI] [PubMed] [Google Scholar]
- (34).Lieberman KR, Cherf GM, Doody MJ, Olasagasti F, Kolodji Y, Akeson M. J. Am. Chem. Soc. 2010 doi: 10.1021/ja1087612. null. [DOI] [PMC free article] [PubMed] [Google Scholar]
- (35).Manrao EA, Derrington IM, Pavlenok M, Niederweis M, Gundlach JH. PLoS One. 2011;6:e25723. doi: 10.1371/journal.pone.0025723. [DOI] [PMC free article] [PubMed] [Google Scholar]
- (36).Smeets RMM, Keyser UF, Krapf D, Wu MY, Dekker NH, Dekker C. Nano Lett. 2006;6:89. doi: 10.1021/nl052107w. [DOI] [PubMed] [Google Scholar]
- (37).Chung SH, Hoyles M, Allen T, Kuyucak S. Biophys. J. 1998;75:793. doi: 10.1016/S0006-3495(98)77569-1. [DOI] [PMC free article] [PubMed] [Google Scholar]
- (38).Sanchez-Quesada J, Saghatelian A, Cheley S, Bayley H, Ghadiri MR. Angew. Chem. Int. Ed. 2004;43:3063. doi: 10.1002/anie.200453907. [DOI] [PMC free article] [PubMed] [Google Scholar]
- (39).Bhattacharya S, Derrington IM, Pavlenok M, Niederweis M, Gundlach JH, Aksimentiev A. ACS Nano. 2012;6:6960. doi: 10.1021/nn3019943. [DOI] [PMC free article] [PubMed] [Google Scholar]
- (40).Cheley S, Braha O, Lu X, Conlan S, Bayley H. Protein Sci. 1999;8:1257. doi: 10.1110/ps.8.6.1257. [DOI] [PMC free article] [PubMed] [Google Scholar]
- (41).Maglia G, Heron AJ, Stoddart D, Japrung D, Bayley H. Methods in Enzymology, Vol 475: Single Molecule Tools, Pt B. 2010;474:591. doi: 10.1016/S0076-6879(10)75022-9. [DOI] [PMC free article] [PubMed] [Google Scholar]


