

Abstract
We study hurricane risk on the U.S. Gulf Coast during 1950–2005, estimating the wind damage and storm surge from every hurricane in this extended period. Wind damage is estimated from the known path and wind speeds of individual storms and calibrated to fit actual damage reports for a sample of Gulf Coast storms. Storm surge is estimated using the SLOSH model developed by NOAA. These models provide the first comprehensive overview of the hurricane storm hazard as it has been experienced over a fifty-six-year period. We link the estimated damage with information on the population and specific socio-demographic components of the population (by age, race, and poverty status). Results show that white, young adult, and nonpoor populations have shifted over time away from zones with higher risk of wind damage, while more vulnerable population groups–the elderly, African Americans, and poor—have moved in the opposite direction. All groups have moved away from areas with high risk of storm surge since 1970. But in this case, perhaps because living near the water is still perceived as an amenity, those at highest risk are whites, elderly, and nonpoor households. Here exposure represents a trade-off between the risk and the amenity.
Keywords: disaster, vulnerability, resilience, risk assessment
In the United States, major hurricanes have caused more damage to human society and ecosystems than any other natural disasters (Pielke and Landsea 1998; Pielke and others 2008). Our purpose is to determine to what extent there has been differential vulnerability to this damage for different segments of the population. Social scientists distinguish two dimensions of potential harm. The first is risk by virtue of residential location (broadly related to proximity to the coast), which we refer to as locational vulnerability. The second is capacity to deal with disaster, which we call social vulnerability. This dichotomy is well established in the literature. For example Robert Chambers defined vulnerability as having “two sides: an external side of risks, shocks and stress to which an individual or household is subject; and an internal side which is defenselessness, meaning a lack of means to cope without damaging loss” (1989, 1; see also Hewitt 1997).
Our approach is to focus first on locational vulnerability, which requires an intensive effort to catalogue hurricanes over a long period of time (Gulf Coast hurricanes during 1950–2005) and determine how much damage they caused and where. Simply mapping the storm track of these hurricanes is only one step in the process, because storms have been widely scattered all across the coast. What is needed is to calibrate and apply models of the spatial extent of damage from each hurricane, taking into account both wind damage (which often covers a wide territory, but at varying intensities) and storm surge (limited to a more narrow coastal band, but sometimes with extreme impact). We do this here, producing the first estimates of where hurricanes hit and how hard they hit in this fifty-six-year period.
We then link these hazard data with census information on the residential population at the beginning of each decade. We intend the analysis of population data primarily as a description of which population groups have been more exposed to hurricane damage over the decades, illustrating the usefulness of being able to estimate the spatial extent of damage. Comparing the locations of white and black populations, older persons and young adults, and poor and nonpoor in relation to hazards offers an overview of the distribution of social vulnerability. The trends over time are interesting in themselves, and they merit interpretation in relation to major theories of disaster.
There is a “general consensus within the social science community about some of the major factors that influence social vulnerability… Among the generally accepted are age, gender, race, and socioeconomic status” (Cutter, Boruff, and Shirley 2003, 244). As Gordon McGranahan, Deborah Balk, and Bridget Anderson point out “affluent settlements and groups are in a better position to take protective measures and to adapt or escape when flooding does occur (as media coverage and research on hurricane Katrina and New Orleans amply demonstrated)” (2007, 20). From this perspective, certain groups have the ability to minimize the harm caused by hurricanes, allowing them to be relatively indifferent to the damage. If this were the case, we might expect these groups to be indifferent to hurricane experience, and we would see little change in their locational pattern over time. If, for example, people perceive coastal locations as a desirable amenity, it is the populations with the most resources who will locate there. For this reason in coastal South Carolina, areas most exposed to hazards—located along the coast and waterways—are populated by more-advantaged groups (Cutter, Mitchell and Scott 2000). In contrast, we might expect less-advantaged groups to suffer more permanent loss from hurricanes, which might cause them over time to be pushed away from vulnerable locales. These processes may be tied to personal resources such as savings, insurance, or the ability to negotiate with public agencies and insurers. They may also be tied to collective resources that affect the resilience of a community. In this vein, Billie Turner and others conclude that “vulnerability is registered not by exposure to hazards (perturbations and stresses) alone but also resides in the sensitivity and resilience of the system experiencing such hazards” (2003, 8074). For this reason, they argue for a place-based approach: “The strong variation in vulnerability by location, even to hazards created by global-scale processes and phenomena … elevates the role of ‘place-based’ analysis. The term ‘place based’ implies a spatially continuous distinctive ‘ensemble’ of human and biophysical conditions or coupled human–environment systems” (8076).
Another perspective emphasizes whether people have options. Gordon McGranahan, Deborah Balk, and Bridget Anderson acknowledge this as the quote above continues: “On the other hand, the poorest residents of the cities of low-income countries are often forced (implicitly or explicitly) to settle in flood plains or other hazard-prone locations, as they cannot afford more suitable alternatives” (2007, 20). Much work has demonstrated that measures of social capital are correlated with the likelihood of being proximate to certain hazardous sites and other indicators of neighborhood well-being (Diez-Roux 1997; Sampson, Morenoff and Earls 1999; Buka and others 2003; Morenoff 2003). Bob Bolin argues that the processes of marginalization, which could take many forms, result in inequalities in exposure to hazards and access to opportunities (2006). Advantaged groups may be more able over time to adjust to the costs of hurricane exposure by moving to less vulnerable locations, while those with less resources remain trapped in areas of high vulnerability.
Both points of view are found in posthurricane studies. Blacks were most heavily impacted by Hurricane Katrina (Logan 2008), in large part because historically they were segregated into low-lying areas known to be vulnerable to flooding (Colten 2005). There was a racial disparity in return migration—whites returned more quickly than blacks—though this could be explained by the fact that the blacks’ neighborhoods suffered greater damage (Fussell, Sastry, and Van Landingham 2010). After Hurricane Andrew, the wealthy returned more quickly to their prior locations, but middle-income households moved away and were replaced by lower-income households (Smith and others 2006).
RESEARCH DESIGN: ESTIMATING LOCATIONAL VULNERABILITY
Within our period of study, we treat hurricane risk as a constant, although recent research on Atlantic tropic cyclone activity (Mann and others 2009) and global mean temperature (Emanuel 2005) suggests a long-term trend of increasing frequency and intensity. In the near term it is more difficult to discern trends. There is a random component to where, when, and with what intensity hurricanes actually occur. To smooth out the random events we aggregate damage from all storms in the period and treat the result as a single spatial profile of hurricane risk for the region making the assumption that the experience of over five decades provides a reasonable reflection of the underlying pattern. The analysis includes 320 counties within 200 miles from the coastline in an area from Texas through the Florida Panhandle (Figure 1). We selected this zone in order to balance two concerns: 1) to include most of the area that was at risk of hurricanes, while 2) leaving out areas with no risk, so that changes in their composition over time would not influence our analysis of population vulnerability. We omitted the Florida peninsula because we suspect that the many hurricanes crossing the state may have different spatial patterns than those that hit the coastline and are never again over open water. The results presented here are based on all forty-three hurricane-strength storms in the period 1950–2005; similar results are found in analyses including all ninety-three tropical storms. (Maps and shapefiles for these wind and storm surge damage estimates are provided at the authors’ webpage, www.s4.brown.edu/hurricane).
FIG. 1.
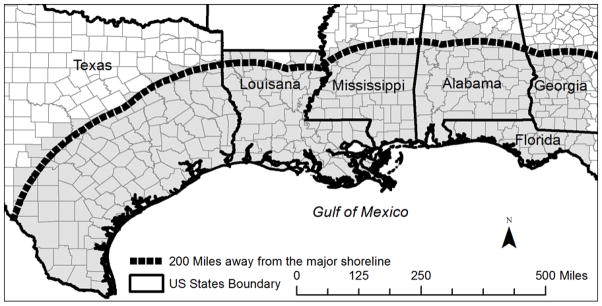
The study area in the U.S. Gulf Coast.
On the population side, we take advantage of time-series data to track population movements. We begin with the spatial distribution of population and trace it decade by decade through 2000. Then, in order to capture the impact of Hurricanes Katrina and Rita in 2005, we provide annual population estimates for 2000–2010. Hence we can discover not only who is in the path of storms in general, but how that pattern may have shifted over several decades. Data through 2000 are from decennial censuses; subsequent data are annual population estimates made by the Census Bureau and poverty figures from the American Community Survey. The analysis of wind damage is done at the county level. Counties are the preferable unit of analysis, because wind damage estimates are more reliable at this scale. Hurricanes typically cover very large areas, and they have a regular gradient from higher winds near the storm track and lower winds at the periphery. But there is likely variability at very local scales. Prior to 1980, most of the region was not tracted, and there are no data on the within-county distribution of population. Therefore when only part of a county is within a given damage zone we use areal interpolation to estimate the population at risk (adjusting for areas covered by water that have no population). Storm surge is much more localized, and we analyze population vulnerability at the finer level of census tracts when these data are available: in urban areas in each decade from 1950 onwards and in the whole study area by 1980. Nontracted areas prior to 1980 are assigned the value for the whole county less the population in the tracted area of the county. The measures used are: race (comparing whites to blacks), age (comparing young adults aged 20–34 to people of age 65 and above), and social class (comparing people above and below the official poverty line).
For only a few recent storms are there detailed records of what areas were damaged and to what extent. Therefore in the first phase of this research our task was to reconstruct estimates of the land area that was affected by every hurricane, the gradient from higher to lower intensity of wind, and the implied level of damage on the ground. The available data maintained by NOAA are the hurricane-track records that can be represented as a series of line segments. Storm-surge models also require information on land elevation and tide levels at the time that the hurricane reached the coast. Elevation data are drawn from a Digital Elevation Model (DEM) provided in the National Elevation Dataset (http://ned.usgs.gov). Tide data are based on the water high at the nearest tidal station to the hurricane track as recorded in the eighteen hours prior to landfall, as recommended by the model developers.
THE SPATIAL EXTENT OF WIND DAMAGE
We apply a meteorological model of wind damage (HURRECON) that has been parameterized and applied to the analysis of the Great New England Hurricane in 1938 and Hurricane Hugo in Puerto Rico as well as numerous other storms (Boose, Chamberlin, and Foster 2001; Boose, Serrano, and Foster 2004). Although the wind velocity and direction in a hurricane is very dynamic, analysis of the aerial reconnaissance transects data for many hurricanes reveals common macrostructures in hurricane wind fields (Neumann 1987; Boose, Foster, and Fluet 1994; Vickery, Skerlj, and Twisdale 2000). These common structures include: in the northern hemisphere, wind rotates around the hurricane center in a counter clock wise direction as the hurricane eye moves along the track; and wind velocity increases from the eye outward until reaching its maximum at the hurricane eye wall and then decaying exponentially.
HURRECON models the shape and extent of the hurricane’s surface wind field (sustained wind speed, peak gust speed, and wind direction) based on meteorological data (location of the eye and intensity at every six hours along the track) and surface type (land or water).1 It requires setting two parameters that describe how the wind velocity and direction change with the radial distance away from the hurricane eye to the eye wall and beyond. These are the Radius of Maximum Wind (RMW, or the size of the hurricane eye wall), and a wind profile exponent b. These two parameters together describe how the wind velocity and direction change with the radial distance away from the hurricane eye to the eye wall and outward (Figure 2). Wind damage can also be affected by landscape factors, such as elevation and topography, and by characteristics of the built environment, such as quality of housing construction, which are not taken into account by this model. For these reasons, the estimates are more reliable on a large spatial scale. Although we map results in a smooth surface, the estimated damage at any given point is only an approximation, and caution is necessary when using these estimates for small areas like census tracts.
FIG. 2.

The estimated wind speed at a given location is a function of the distance to the storm center. The function is characterized by the Radius of Maximum Wind (RMW) and the wind speed decay exponent, b. RMW could be measured through aerial reconnaissance and b could be measured from weather station or aerial reconnaissance transects, but these are most often not available and must be estimated.
Following the methodology employed by Emery Boose and others (2001), we calibrated RMW and b for the HURRECON model using actual damage reports. We collected data on twenty hurricanes in five states (Table 1) selected to represent cases with varying intensity from H1 to H5 on the Saffir/Simpson scale, which is a categorization based on hurricane’s sustained wind speed (http://www.nhc.noaa.gov/aboutsshws.php). H1 refers to wind speeds of 74–95 mph, while H5 involves winds of over 157 mph. In general, damage associated with increased wind rises by about a factor of four for every category increase.
TABLE 1.
HURRICANES SELECTED FOR GATHERING DAMAGE REPORTS FOR CALIBRATION AND VERIFICATION OF THE HURRECON MODEL
| HURRICANE | YEAR | LANDFALL STATE | IINTENSITY AT LANDFALL | IMPACT STATES | NUMBER OF WIND DAMAGE REPORTS |
|---|---|---|---|---|---|
| Calibration sample: | |||||
| Baker | 1950 | AL | H1 | Alabama | 32 |
| Betsy | 1965 | LA | H4 | Louisiana/Mississippi | 65 |
| Camille | 1969 | MS | H5 | Mississippi/Louisiana/Alabama | 178 |
| Erin | 1995 | FL | H1 | FL Panhandle/Alabama/Mississippi | 53 |
| Opal | 1995 | FL | H3 | FL Panhandle/Alabama | 147 |
| Georges | 1998 | MS | H2 | Mississippi/Alabama | 72 |
| Lili | 2002 | LA | H1 | Louisiana/Mississippi | 43 |
| Ivan | 2004 | AL | H3 | Alabama | 100 |
| Katrina | 2005 | LA | H3 | Louisiana/Mississippi/Alabama | 128 |
| Verification sample: | |||||
| Hilda | 1964 | LA | H2 | Louisiana | 15 |
| Beulah | 1967 | TX | H5 | Texas | 28 |
| Eloise | 1975 | FL | H3 | FL Panhandle/Alabama | 80 |
| Frederic | 1979 | AL | H4 | Alabama/Mississippi | 156 |
| Alicia | 1983 | TX | H3 | Texas | 21 |
| Elena | 1985 | MS | H3 | Mississippi/Louisiana/Alabama | 63 |
| Kate | 1985 | FL | H2 | Florida | 6 |
| Danny | 1985 | LA | H1 | Louisiana | 11 |
| Chantal | 1989 | TX | H1 | Texas | 7 |
| Claudette | 2003 | TX | H1 | Texas | 12 |
| Dennis | 2005 | FL | H3 | FL Panhandle/Alabama | 59 |
Local newspapers in Texas, Louisiana, and Mississippi were reviewed for the week of each hurricane that passed near their area of coverage (not necessarily in-state). Reports of damage were collected and coded for damage level on the Fujita scale as modified by Boose (Fujita 1971, 1987; Boose and others 2001).2 For example, it was reported in the Daily Corinthian (Corinth, Mississippi) on August 19, 1969, that “the destructive force of Camille was felt this far inland as this tree in City Park was the victim of high winds and heavy rain which moved to this end of the state.” The damage was coded on the Fujita scale (http://www.spc.noaa.gov/faq/tornado/f-scale.html) as F0 at this location. We obtained a total of 1276 damage reports, including some reports coded as no damage. Media reports are subject to many sources of error, and as we note below, we have reason to believe that they are often exaggerated, and selectively reporting more extreme damage. However, they offer the only available source of information below the level of the county against which we can assess the performance of the HURRECON model. Damage reports from nine hurricanes were used to select the model parameters that provided the best fit between reported and estimated damage. Five measures of fit were used; for example, the average correlation between estimated and observed damage at the county level for the validation hurricanes is 0.68. The best fitting model choice is based on a composite of all five measures. Reports from the remaining eleven hurricanes were used to verify the selected parameters. For example, the average correlation of estimated and observed damage for the verification hurricanes is 0.59; discounting two hurricanes with a perfect match but observations in only four counties the average correlation is 0.50. The model was then applied uniformly to all forty-three hurricanes in the period.
To reduce the effect of random error in measurement and spatial location for the newspaper reports, we created a measure of the maximum-reported damage in every county in the following way. Damage reports were converted to a continuous damage surface using Kriging interpolation, which was overlaid with counties, and the maximum damage from this surface was used as the measure for the county. For hurricanes without enough damage reports to support such interpolation, we simply assigned the maximum-reported damage to each county and made no estimate for neighboring counties.
We used reports from nine hurricanes for a detailed exploratory study to determine the parameter or range of parameters that provide the best fit between the spatial extent of maximum estimated wind damage (from HURRECON) and reported damage at the county level. For each of these nine hurricanes, we tested every combination of the following parameters as suggested from prior research: RMW (25, 50, 75, and 100km) and b (1.1, 1.2, 1.3, 1.4, 1.5, and 1.6). For a given combination of RMW and b, the HURRECON model can be executed on an equally divided raster space in IDRISI raster file format, which is converted from a model extent defined in GIS. For individual hurricanes, ten kilometers is used as the resolution. For the whole Gulf Coast, twenty kilometers is used as the resolution. Having determined the best fitting combination, we applied those parameters to the remaining eleven hurricanes and again tested the fit between the model and damage reports. Judging that the fit was acceptable, we then applied this calibrated model to all hurricanes in the Gulf Coast between 1950 and 2005.
Evaluation of alternative parameters was based on the performance of five different measures of fit. Several indices have been proposed in the literature (Wilmott and others 1985). We calculated the following measures: Spearman’s rank order coefficient(r), index of determination (r2), root mean square error (RMSE), mean square error (MSE), and index of agreement (d). Each index has slightly different characteristics; for example, the correlation coefficients can measure collinearity, but are insensitive to the additive and proportional differences between predicted and observed values. High values of correlation (r), index of agreement (r2), and index of determination (d) indicate good correspondence and agreement between modeled and reported damages in terms of variability and magnitude. Low values of RMSE and MSE indicate a good overall agreement with a large age of error being random. The model with the best overall performance should have high correlation measures and low difference measures.
We calculated all five indices for every combination of values of RMW and b. In order to evaluate results on a common scale, we developed a standardized measure of fit on each index. For each of the initial nine hurricanes we determined which combination was the best fit on each index (i.e., the highest value of correlation measures or the lowest value of difference measures). That value was then used as the basis for assessing the fit for other combinations of parameters. More precisely the standardized measure was defined as Rstd = R – Rbestfit|/Rbestfit, where Rstd denotes the standardized value; R is the calculated index value; and Rbestfit is the value for the best-fit model. Then in order to select a single “best” combination of parameters, we take the average of the five standardized indices for all nine hurricanes (this implies that we weight each index equally). Figure 3 presents a graph of these averages, showing that the model with RMW of twenty-five kilometers and b of 1.4 has the best overall performance.
FIG. 3.

Comparison of the performance of HURRECON models of different parameters.
We illustrate the procedure followed for the nine calibration hurricanes with the case of Camille (1969). Figure 4 shows visually the close correspondence between reported damage and estimates based on the calibrated HURRECON model. The pattern is consistent with meteorological expectations as the intensity of damages lessened and the extension of damage narrowed along the storm track from the shoreline to the north, and there is typically greater damage on the east side of the track. However, there exists a significant amount of spatial heterogeneity in the point-based damage reports that might reflect either biased reporting or unexplained local variation in actual damage. The values at the county level are more reliable, leading us to prefer to analyze results at this scale.
FIG. 4.

Comparison of reported damage (a) and damage estimated from the best fitting model (c) for Camille (1969), showing interpolation (b) and conversion to the county level (d).
Having calibrated the model with data from the initial nine hurricanes, we then verified the results by applying the best-fit parameters of RMW (twenty-five kilometers) and b (1.4) to eleven additional hurricanes for which we had gathered damage reports from local media (results are shown for nine calibration hurricanes and eleven verification hurricanes in Table 2). For each hurricane we calculated the number of counties for which the estimated damage was the same as the reported damage, and the number where there were differences of one or two points in either direction. For all hurricanes there is a tendency for reported damage to be greater than estimated damage, which is consistent with Boose’s observations (Boose and others 2001). But in two of the verification cases there appears to be a poor model fit. In the case of Frederick (1979) there is exact agreement for only five of sixty-two counties, and twenty-five counties have reports of damage that are two points higher than estimated by the model. Further analysis shows that many reported damage locations are farther to the north than anticipated by the model. Boose and others dealt with a similar situation by increasing wind speed along the hurricane track, but this solution would not generally be satisfactory for Gulf Coast hurricanes (2001, 1994). Hurricane Dennis generated many damage reports in east and central Alabama that are quite far away from the hurricane track, which veered quickly westward toward Mississippi after landfall (2005). In this case we interpret the discrepancy as mainly due to error in reported damage. In the remaining nine cases, exact correspondence ranged from 23.1 percent to 100 percent of counties, and discrepancies of one or less in the Fujita scale ranged from 62.5 percent to 100 percent of cases.
TABLE 2.
SUMMARY OF THE DIFFERENCE BETWEEN THE ESTIMATED AND REPORTED COUNTRY-LEVEL DAMAGE (using RMW=25 Km and b=1.4)
| HURRICANE | YEAR | SAFFIR-SIMPOSON | MODELED MINUS REPORTED DAMAGE | TOTAL COUNTIES AFFECTED | % COUNTIES WITH EXACT AGREEMENT | % COUNTIES WITH DIFFERENCE OF 1 POINT OR LESS ON F SCALE | ||||
|---|---|---|---|---|---|---|---|---|---|---|
| −2 | −1 | 0 | 1 | 2 | ||||||
| Calibration sample: | ||||||||||
| Georges | 1998 | H2 | 0 | 14 | 46 | 6 | 0 | 66 | 69.7 | 100.0 |
| Erin | 1995 | H1 | 0 | 20 | 42 | 3 | 0 | 65 | 64.6 | 100.0 |
| Betsy | 1965 | H4 | 0 | 18 | 52 | 17 | 0 | 87 | 59.8 | 100.0 |
| Baker | 1950 | H1 | 0 | 19 | 49 | 5 | 0 | 73 | 67.1 | 100.0 |
| Katrina | 2005 | H3 | 2 | 67 | 108 | 12 | 2 | 191 | 56.5 | 97.9 |
| Ivan | 2004 | H3 | 4 | 49 | 107 | 3 | 0 | 163 | 65.6 | 97.6 |
| Lili | 2002 | H1 | 1 | 8 | 19 | 4 | 0 | 32 | 59.4 | 96.9 |
| Opal | 1995 | H3 | 12 | 61 | 188 | 5 | 0 | 266 | 70.7 | 95.5 |
| Camille | 1969 | H5 | 0 | 29 | 129 | 22 | 10 | 190 | 67.9 | 94.7 |
| Verification sample: | ||||||||||
| Alicia | 1983 | H3 | 0 | 2 | 6 | 1 | 0 | 9 | 66.7 | 100.0 |
| Chantal | 1989 | H1 | 0 | 2 | 2 | 0 | 0 | 4 | 50.0 | 100.0 |
| Claudette | 2003 | H1 | 0 | 5 | 2 | 0 | 0 | 7 | 28.6 | 100.0 |
| Kate | 1985 | H2 | 0 | 0 | 4 | 0 | 0 | 4 | 100.0 | 100.0 |
| Elena | 1985 | H3 | 2 | 12 | 9 | 1 | 0 | 24 | 37.5 | 91.7 |
| Hilda | 1964 | H2 | 2 | 6 | 3 | 2 | 0 | 13 | 23.1 | 84.6 |
| Danny | 1985 | H1 | 2 | 2 | 3 | 0 | 0 | 7 | 42.9 | 71.4 |
| Beulah | 1967 | H5 | 3 | 1 | 6 | 1 | 1 | 12 | 50.0 | 66.7 |
| Eloise | 1975 | H3 | 9 | 9 | 6 | 0 | 0 | 24 | 25.0 | 62.5 |
| Frederick | 1979 | H4 | 25 | 31 | 5 | 1 | 0 | 62 | 8.1 | 59.7 |
| Dennis | 2005 | H3 | 13 | 13 | 2 | 1 | 0 | 29 | 6.9 | 55.2 |
It is natural that the fit for verification cases would be somewhat lower than for the calibration cases, and we conclude that the HURRECON model as applied here provides reasonable estimates of the spatial extent of wind damage.
Our estimates of the spatial pattern of cumulative risk of hurricane damage on the Gulf Coast are presented here in four ways (Figure 5).3 Panel (a) maps the 270 counties with at least an F0 level of damage experienced over the fifty-six-year period and shows the number of such hurricanes in the county. As expected the incidence is greater near the coast, but there is considerable additional variation—less along the Texas coast than in Louisiana, Mississippi, and the Florida Panhandle. Panel (b) maps the 170 counties with at least F1 level of damage. It is considerably reduced in extent compared to F0 impacts and more closely hugs the coastline. Panel (c) considers only damage of F2 or above, and is even more clearly geographically restricted, including sixty-seven counties mostly on the coast and again especially in Louisiana and Mississippi. Finally, panel (d) identifies the maximum damage level from any hurricane over the fifty-six years examined. F3 or F4 intensity is found only in eight landfall counties at the Mexican-Texas border and in Louisiana and Mississippi, but there are 162 counties that at some point experienced F1 or F2 damage, and many of these are inland.
FIG. 5.

Modeled damage frequency and intensity, using best-fit values for the radius of maximum winds (RMW=25km) and wind-profile exponent (b=1.4): (a) F0 + damage; (b) F1+ damage; (c) F2+ damage; (d) maximum damage experienced since 1950.
THE SPATIAL EXTENT OF STORM SURGE
We compute the hurricane storm surge by using the Sea, Lake and Overland Surges from Hurricanes (SLOSH) model, which is the model used by the National Hurricane Center to predict hurricane storm surge for emergency management (Jelesnianski and others 1984; Shaffer, Jelesnianski, and Chen 1986; Jelesnianski, Chen, and Shaffer 1992). The National Hurricane Center has published surge maps for several more recent hurricanes, but not for the majority of storms in this analysis. Fortunately, the methodology for applying this model is well developed. SLOSH is a two-dimensional, finite element implementation of the equations of fluid motion in water basins (modeling areas along the coast that have been defined by NOAA—see http://www.nhc.noaa.gov/surge/faq.php). Most basins are polar grids that have increasingly finer resolution as they approach the coast. They are defined taking into consideration the geomorphology near the coast that affect water flow, such as the coastal sand dunes, natural ridges, levees, and other manmade structures. For each hurricane, we selected the basin that would contain the modeled surge, and in some cases we combined more than one basin. For every basin NOAA has developed algorithms to link the pattern of storm surge to the intensity of winds, central pressure, forward speed, size, and angle of approach of a particular hurricane. These algorithms take into account the width and slope of the continental shelf and local features such as concavity of coastlines, bays, and rivers.
The variable inputs to SLOSH are the storm track in a sequence of six-hourly positions, plus the radius of maximum wind (RMW) and central pressure. Unlike our treatment of wind fields after landfall, where we wished to adjust RMW to improve fit to reported wind damage, we adopt a standard estimator of RMW for the surge analysis based on the latitude and intensity of the hurricane center as reported by NOAA (Neumann 1987).
A final consideration is the relation of water level to ground level, which depends on land elevation (DEM). We use the elevation data provided by the National Elevation Dataset (NED, http://ned.usgs.gov/). For each hurricane the depth of inundation—what we refer to as “storm surge”—is the difference between the modeled storm surge surface and the land elevation for a specific SLOSH grid cell. For some basins the NED uses an older vertical datum (the NGVD29—National Geodetic Vertical Datum of 1929) than the standard NAVD88 (North American Vertical Datum of 1988), and we convert the NGVD29 to the NAVD88. SLOSH does not automatically take into account the astronomical tide. To include the tide effect in the storm surge, we find the nearest tidal station to the hurricane track. As recommended by the creators of SLOSH, we determine the water height eighteen hours before the landfall; we then add the height of the tide to the predicted base estimated surge height.
Given these inputs, the SLOSH model provides at every grid cell in the basin the changing surge heights over the hurricane’s life course, and the maximum surge height. We use the maximum surge height, plus height of tide, as the modeled storm surge. We then interpolate a raster storm surge surface by using a nearest neighbor interpolation.
Figure 6 presents a summary of the results aggregated at a 30 X 30 meter spatial resolution: the number of times since 1950 that there has been storm surge inundation of one foot or higher at some point in the tract. The whole coastline has been affected at least once, and the highest frequency is found along the coast. In the area shown in panel B that is centered on Louisiana storm surge has been experienced more than ten times. Note that there is occasional storm surge even in some inland areas. This mainly reflects river and creek beds, bays, and wetlands that allow water to flow from the coast.
FIG. 6.

Modeled frequency of storm surge inundation of one foot or higher, based on hurricanes from 1950 to 2005.
WHO WAS AT RISK FOR WIND DAMAGE?
These damage estimates make it possible for the first time to address questions about how population shifts over the last half-century have changed people’s risk from hurricanes. As noted above, our assumptions are that hurricanes in this period are an exogenous phenomenon with random variation across time and space, and that the aggregated observed result for 1950–2005 is an unbiased estimate for any period in the recent past or near future.
We used decennial census figures and annual population estimates to calculate the number and composition of persons living in areas with differing risks of wind damage and storm surge in each decade. In many cases counties are divided into two or more zones of estimated wind damage, and we have allocated population to each zone according to its share of the county’s land area. The total population of the Gulf Coast region as defined here grew between 1950 and 2010, from under 11.5 million to over 27 million (up 134 percent). (In the same period the U.S. population increased by 104 percent.) Consequently the number of persons at risk also grew in absolute terms. However our focus is not on overall population growth, but on how the share of the population exposed to various levels of damage changed over time.
We find that about three-quarters of the population in the study region in 2010 lived in areas that experienced at least one hurricane with wind damage of F0 or higher in a fifty-six-year period. More telling, more than a third of the population lived in areas that experienced five or more hurricanes, an average of at least one per decade. There was a curvilinear trend in exposure to five or more hurricanes, rising from 34.0 percent in 1950 to a high of 39.2 percent in 1980, then falling to 36.1 percent by 2010. Nearly one person in six was in an area with an exposure of F2 damage or greater, which would involve buildings blown down and destroyed, roofs lost from masonry buildings, and stationary cars or railroad boxcars pushed over. Exposure to F2 or above followed a curvilinear trend, rising during 1950–1970 (from 16.5 percent to 18.1 percent), but declining again to only 14.9 percent in 2010. These data suggest some turning away from areas with the greatest locational vulnerability in favor of areas with risks in a more moderate range, a process that ecologists might interpret as adaptation rather than resilience.
Figure 7 examines exposure over time to F2 or greater damage for subgroups of the population defined by age, race and poverty status as well as different trend lines. The selected age categories are persons twenty to thirty-four, the prime early adulthood period that most distinguishes areas that are losing or gaining population through migration, and persons over sixty-five, who are considered to have the most difficulty coping with natural disasters. Most of the population in this region is white or black, and reliable population estimates are not possible prior to 1980 for Hispanics. Therefore we limit our comparison to whites and blacks (counting only non-Hispanic whites and blacks in 1980–2010, when census reports make this possible, but all persons of white or black race in 1950–1970). Poverty is based on the official federal poverty level in each year.
FIG. 7.

Trends in the exposure of different population groups on the Gulf Coast during 1950–2010. The Y-axis is the age of each groups’ members who lived in areas at risk of F2 damage or higher. A larger share of older, black, and poor residents were at risk in 2010 compared to 1950, while vulnerability declined for younger, white, nonpoor residents.
There was a reversal in relative risk for young adults and older residents. In 1950, a higher share of young adults than older persons lived in risky areas (17.3 percent vs. 15.0 percent). The share of young adults at risk peaked in 1960 and began a steady decline, while the over aged sixty-five+ population shifted toward higher risk areas through 1990. By then older persons were more exposed than young adults at the F2 damage level. Differences were maintained through 2010.
Initial differences by race were greater. In 1950, 17.7 percent of whites but only 12.9 percent of blacks were in areas of F2 or greater damage. White exposure increased slightly in 1960, but then began a continued decline. Black exposure increased substantially through 1980, almost reaching the same level as whites, and was virtually the same as whites in 1990 and 2000. But between 2000 and 2010 there was a sharp reduction in black exposure—related, as suggested below, to black displacement due to Katrina and Rita.
The pattern by poverty status is similar to the pattern by race. Nonpoor persons were at much higher risk of F2 damage in 1950 (19.2 percent vs. 13.6 percent). But by 1960 this exposure had peaked and it fell steadily to 14.7 percent by 2010. In contrast, exposure of poor residents increased steadily through 1990, when it exceeded the nonpoor exposure. Despite falling after that, in 2010 it was still nearly one age point higher (at 15.8 percent) than nonpoor exposure.
These findings show a shifting relationship between locational vulnerability to wind damage and social vulnerability on the Gulf Coast. Immediately after World War II, the least socially vulnerable residents lived disproportionately in the areas closer to the coast, where there was greater exposure to the highest levels of potential wind damage. Within two decades, their residential pattern was shifting toward areas of moderate risk, while socially more vulnerable seniors, blacks, and poor residents shifted toward areas of higher risk. We are not yet able to explain why these changes took place, and we have shown no causal link. But certainly the net effect raises a concern about whether the most exposed Gulf Coast communities may have become less resilient as a result.
WHO WAS AT RISK FOR STORM SURGE?
We turn now to exposure to storm surge, where we analyze data at the finer scale of census tracts. Figure 8 shows the age of each social category living in tracts that experienced a one foot or deeper storm surge. Here we find a different pattern—every group increased exposure through 1960 or 1970, but then declined to end up near or below the 1950 level in 2010.
FIG. 8.

Trends in the exposure to storm surge of one foot or more of different population groups on the Gulf Coast during 1950–2010.
There is a reversal of relative exposure by age: those sixty-five and older were less exposed than young adults in 1950, but since 1990 they have been more exposed. Whites have consistently been more at risk than blacks. Nonpoor also have been consistently more at risk than poor persons, though recently the gap between them has been reduced. In terms of race and poverty, unlike the case of wind damage, the more socially vulnerable population groups have been less exposed to storm surge than less vulnerable groups. This pattern matches the perceived amenity of beachfront property that has the highest risk of surge, but in many locales commands the highest prices. More intensive research is needed to sort out the shifting pattern of residential settlement. Possibly some combination of perceived hazard and rising insurance costs is tending to push development away from the coast, while the social desirability of being near the water also keeps prices high.
POPULATION IMPACTS OF EXTRAORDINARY EVENTS
Although there were several major hurricanes during the period of study, their impacts seem to have been cumulative and to show up in relatively modest but continuing shifts in the population pattern. Most changes from decade to decade (see Table 3 for details) are one percentage point or less. Yet the experience in 2005 of Hurricanes Katrina and Rita at the end of our study period allows us to see the possibility of much larger and more sudden shifts. As is well known, these hurricanes (and associated flooding of New Orleans) displaced very large numbers of people. We can track changes on an annual basis at the county level using the Census Bureau’s county population estimates and poverty estimates from the American Community Survey.
TABLE 3.
NUMBER (IN THOUSANDS) AND PERCENTAGES OF PERSONS LIVING IN ZONES WITH ABOVE AVERAGE HURRICANE RISK IN GULF COAST COUNTIES FOR SELECTED POPULATION GROUPS, 1950–2005
| DAMAGE 1950–2005: | 1950 | 1960 | 1970 | 1980 | 1990 | 2000 | 2010 | ||||||||
|---|---|---|---|---|---|---|---|---|---|---|---|---|---|---|---|
| F2 Damage or higher | Age 20–34 | 467 | 17.3% | 485 | 18.7% | 524 | 18.0% | 851 | 17.4% | 828 | 16.3% | 792 | 15.3% | 826 | 14.2% |
| Age 65+ | 112 | 15.0% | 160 | 15.6% | 198 | 16.1% | 296 | 16.3% | 378 | 17.0% | 443 | 17.1% | 491 | 15.9% | |
| White | 1,442 | 17.7% | 1,869 | 19.0% | 2,092 | 18.4% | 2,114 | 17.9% | 2,128 | 17.1% | 2,211 | 16.8% | 2,164 | 16.0% | |
| Black | 441 | 12.9% | 570 | 15.5% | 636 | 17.1% | 739 | 17.4% | 781 | 17.1% | 876 | 16.7% | 828 | 14.4% | |
| Nonpoor | 280 | 19.2% | 413 | 20.0% | 2,209 | 18.5% | 2,678 | 17.7% | 2,671 | 16.6% | 3,193 | 15.9% | 3,223 | 14.7% | |
| Poor | 181 | 13.6% | 169 | 14.6% | 533 | 16.6% | 576 | 17.3% | 761 | 17.9% | 661 | 17.7% | 808 | 15.8% | |
| One foot or deeper inundation | Age 20–34 | 251 | 9.3% | 268 | 10.3% | 304 | 10.5% | 412 | 8.4% | 420 | 8.3% | 381 | 7.4% | 387 | 6.7% |
| Age 65+ | 62 | 8.2% | 90 | 8.8% | 119 | 9.6% | 147 | 8.1% | 195 | 8.8% | 223 | 8.6% | 238 | 7.7% | |
| White | 785 | 9.7% | 1,036 | 10.5% | 1,154 | 10.2% | 1,151 | 9.8% | 1,176 | 9.5% | 1,210 | 9.2% | 1,145 | 8.5% | |
| Black | 230 | 6.7% | 313 | 8.5% | 370 | 9.9% | 398 | 9.4% | 411 | 9.0% | 450 | 8.6% | 433 | 7.6% | |
| Nonpoor | 167 | 11.5% | 249 | 12.1% | 1,227 | 10.3% | 1,311 | 8.7% | 1,383 | 8.6% | 1,571 | 7.8% | 1,592 | 7.3% | |
| Poor | 114 | 8.6% | 134 | 11.5% | 305 | 9.5% | 253 | 7.6% | 355 | 8.3% | 320 | 7.7% | 305 | 6.0% | |
Note: The absolute numbers for poverty in 1950 and 1960 are for families, not persons. The absolute numbers for White and Black are based on the decennial censuses from 1950 to 2010, and they are White and Non-white in 1950 and 1960 censuses, and White and Black or African American (single race) in 1970 census, and non-Hispanic White and Black (single race) in 1980 to 2010 censuses.
The relevant data are displayed in Figure 9, tracing population changes since 2000 for areas of F2 damage or higher. Between 2000 and 2005 the only changes for any of the population groups that we tracked were toward slightly lower exposure. There was, however, a substantial population shift between 2005 and 2006. In a single year the share of the total population in areas of F2 damage or greater dropped from 15.9 percent to 14.6 percent (a loss of nearly 300,000 people in this zone). The decline was similar for both young adults and seniors and for poor and nonpoor. However it was particularly sharp for blacks (down by 3.1 points, from 16.4 percent to 13.3 percent) compared to whites (from 16.6 percent to 15.7 percent). This divergence is consistent with what is known about the highly localized and racially disparate impacts of flooding in New Orleans (Logan 2008).
FIG. 9.

Trends in the exposure of different population groups on the Gulf Coast during 2000–2010.
Through 2010, the total population shifted back slowly toward the prior level, and a very partial return was the experience of most population subgroups that we have tracked. Two population groups stand out. One is the black population, who experienced the most extreme decline in the first year (a drop of over three age points). Despite a sharp rebound after 2006, the net loss by blacks remained the largest of any group. The other exceptional case is residents below the poverty line. Their population share dropped less than blacks, but more than the remaining categories. More disturbing, there was almost no return of poor residents (the share in F2 areas grew only from 15.7 percent in 2006 to 15.8 percent in 2010). In fact, the number of poor residents in this zone dropped by 85,000 between 2005 and 2006 and by another 19,000 in the following year. From 2007 to 2008 the number increased by a mere 1,000. These results suggest a differential pattern of vulnerability after Katrina and Rita—the black population was most heavily impacted in the first year, while poor residents were least likely to return. The more general point made by Figure 9 is that tracking population changes by decade can sometimes mask larger short-term impacts of major storms.
DISCUSSION
Estimates of the spatial extent of wind damage and storm surge from historical hurricanes are a valuable tool for understanding climate-based hazards, differential population vulnerability, and community impacts and resilience. We have shown that the HURRECON model of wind damage can be calibrated to fit the Gulf Coast and combined with SLOSH models of storm surge. The essential ingredients are data on the storm track and wind velocity of each hurricane at successive time points, which are readily available. Similar estimates could be made for all sections of the coastal U.S. We found that hurricane impacts along the Gulf Coast from 1950 to 2005 were spatially skewed. The maximum damage experienced at some point since 1950 is fairly similar for the whole coast, but areas of Louisiana and Mississippi are more likely to have experienced multiple hurricanes than those on the Texas coast or Florida Panhandle. The inland reach of wind damage and storm surge is also variable.
Progress in modeling damage for historical hurricanes creates a potential for better estimates of their impacts. For example time-series models that take into account spatial dependence can evaluate whether individual hurricanes have effects, or whether only the most severe storms make a difference, or whether it is the cumulative effect over many years that matters. Are effects temporary or lasting? Such models can also be used to compare a range of outcomes, such as demographic (such as population displacement), economic (employment shifts), or environmental (forest cover changes). A central question for theories of disaster and resilience is how effects may differ between human and natural systems—for example, are effects on human communities effectively buffered through public assistance and insurance systems, is the extent and timing of recovery similar in each domain, and is there evidence of greater adaptation to vulnerability over time in one domain or the other? Estimation of parallel models for both social and physical characteristics of the landscape is a feasible method for addressing such questions and is a useful direction for future research.
We have taken a small step toward understanding population vulnerability by linking storm data with information about population size and composition at the county and census tract levels. The at-risk population in the Gulf region has grown substantially in absolute numbers but has declined as a share of the total population in the region. Our focus has been on whether some subgroups of the population faced disproportionate risk. The changing pattern of population distribution in the Gulf Coast region tended to move black, poor, and older residents toward locations with high risk of wind damage for several decades after 1950. Because these groups are likely to have fewer personal resources to cope with displacement or damage, their disproportionate movement over time to areas of higher risk—until the massive displacement after 2005—is disturbing. The continuous movement of white, nonpoor, and young adult residents away from higher-risk areas beginning in 1960 offers a strong contrast. Studying the impacts of Katrina and Rita offers additional clues to which groups may be least resilient, since blacks and poor people were more heavily affected or for a longer duration than others. It would be valuable to investigate whether there are also differences based on other characteristics such as education, home ownership, and family composition, all of which have been shown to be related to people’s ability to recover from natural disasters. Being aware of these patterns will be key to averting the manmade disaster of placing vulnerable people in harm’s way.
In terms of the population, this is a purely descriptive study, an accounting of who lived where and how that changed over time. However, the results merit more interpretation. One view, already mentioned above, is that the relative shift of population out of areas that have proved more risky in the last sixty years represents a successful adaptation of population to its environment. It is possible that communities are becoming more aware of risk, that the costs of hurricane damage are being factored into decisions about where to live by families and by insurance companies and that government has also begun to favor living in more secure locations. An alternative view is that the economy adjacent to the Gulf Coast is being restructured over time, favoring a low-wage second-home, tourist, and casino economy along with offshore oil production that employs few workers, but suffers intermittent environmental risks. By this reasoning one might expect some abandonment of the coastal zone by those population groups who are most mobile and/or are most interested in employment opportunities (white, young, and nonpoor). There is likely some truth to both scenarios. Either way, the result is clearly a trend toward greater confluence of locational and social vulnerability.
Supplementary Material
Acknowledgments
This research was supported by National Science Foundation through grant CMMI-0624088. Rima Wahab Twibell provided research assistance on application and validation of damage models with supervision by Steve Hamburg. Emory Boose provided technical advice on the application of HURRECON. Wilson Shaffer, Arthur Taylor, and Bobby Louangsaysongkham at the NOAA provided advice on the application of SLOSH. Timmons Roberts, Michael White, Andrew Foster, Osvaldo Sala, and David Foster offered comments on the manuscript.
Footnotes
Code for running HURRECON is available at: http://harvardforest.fas.harvard.edu:8080/exist/xquery/data.xq?id=hf025. As described in Emery Boose and others (2001, 32–33):
| (1) |
| (2) |
| (3) |
In a series of publications Emery Boose and others (1994, 2001, 2004) have described a modification of the original Fujita scale that is used in their HURRECON model. This is the scale that we employ here. In addition, there is now an “enhanced Fujita scale” that is recommended for studies of tornados but not for hurricanes (Womble and others 2009).
A list of the forty-three hurricanes and a map of the estimated extent of wind damage and storm surge in each event is provided here: http://www.s4.brown.edu/hurricane/HurricaneMaps.html.
Contributor Information
Dr. JOHN R. LOGAN, Email: John_logan@brown.edu, Professor in the sociology department of Brown University, Providence, Rhode Island 02910
Dr. ZENGWANG XU, Email: xuz@uwm.edu, Professor in the geography department of the University of Wisconsin, Milwaukee, Wisconsin 53201
References
- Bolin B. Race, Class, Ethnicity, and Disaster Vulnerability. In: Rodríguez H, Quarantelli EL, Dynes RR, editors. Handbook for Disaster Research. New York: Springer Press; 2006. pp. 113–129. [Google Scholar]
- Boose ER, Foster DR, Fluet M. Hurricane Impacts to Tropical and Temperate Forest Landscapes. Ecological Monographs. 1994;64(4):369–400. [Google Scholar]
- Boose ER, Chamberlin KE, Foster DR. Landscape and Regional Impacts of Hurricanes in New England. Ecological Monographs. 2001;71(1):27–48. [Google Scholar]
- Boose ER, Serrano MI, Foster DR. Landscape and Regional Impacts of Hurricanes in Puerto Rico. Ecological Monographs. 2004;74(2):335–352. [Google Scholar]
- Buka S, Brennan RT, Janet W, Edwards R, Raudenbush SW, Earls F. Neighborhood Support and the Birth Weight of Urban Infants. American Journal of Epidemiology. 2003;157(1):1–8. doi: 10.1093/aje/kwf170. [DOI] [PubMed] [Google Scholar]
- Chambers R. Vulnerability, Coping and Policy. IDS Bulletin. 1989;20(2):1–7. [Google Scholar]
- Colten CE. An Unnatural Metropolis: Wresting New Orleans from Nature. Baton Rouge, La: Louisiana State University Press; 2005. [Google Scholar]
- Cutter SL, Boruff BJ, Shirley WL. Social Vulnerability to Environmental Hazards. Social Science Quarterly. 2003;84(2):242–261. [Google Scholar]
- Cutter SL, Mitchell JT, Scott MS. Revealing the Vulnerability of People and Places: A Case Study of Georgetown County, South Carolina. Annals of the Association of American Geographers. 2000;90(4):713–37. [Google Scholar]
- Diez-Roux A. Neighborhood Environments and Coronary Heart Disease: A Multilevel Analysis. American Journal of Epidemiology. 1997;146(1):48–63. doi: 10.1093/oxfordjournals.aje.a009191. [DOI] [PubMed] [Google Scholar]
- Emanuel K. Increasing Destructiveness of Tropical Cyclones over the Past 30 years. Nature. 2005;436(7051):686–688. doi: 10.1038/nature03906. [DOI] [PubMed] [Google Scholar]
- Fujita TT. Proposed Characterization of Tornadoes and Hurricanes by Area and Intensity. Chicago, Ill: Univeristy of Chicago; 1971. [Google Scholar]
- Fujita TT. US Tornadoes: Part One, 70-year Statistics. Chicago, Ill: University of Chicago; 1987. [Google Scholar]
- Fussell E, Sastry N, VanLandingham M. Race, Socioeconomic Status, and Return Migration to New Orleans after Hurricane Katrina. Population and Environment. 2010;31(1):20–42. doi: 10.1007/s11111-009-0092-2. [DOI] [PMC free article] [PubMed] [Google Scholar]
- Hewitt K. Regions of Risk: A Geographical Introduction to Disasters. Essex, U.K: Longman Pub. Group; 1997. [Google Scholar]
- Jelesnianski CP, Chen J, Shaffer WA. SLOSH: Sea, Lake, and Overland Surges from Hurricanes. Silver Spring, Md: US Department of Commerce, National Oceanic and Atmospheric Administration, National Weather Service; 1992. [Google Scholar]
- Jelesnianski C, Chen J, Shaffer WA, Gilad A. SLOSH-a Hurricane Storm Surge Forecast Model. Paper read at OCEANS 1984; Washington, D.C.. 1984. [Google Scholar]
- Logan JR. Unnatural Disaster: Social Impacts and Policy Choices after Katrina. In: Richardson HW, Gordon P, Moore JE, editors. Natural Disaster Analysis After Hurricane Katrina: Risk Assessment, Economic Impacts and Social Implications. London, U.K: Edward Elgar Publications; 2008. pp. 279–297. [Google Scholar]
- Mann ME, Woodruff JD, Donnelly JP, Zhang Z. Atlantic Hurricanes and Climate Over the Past 1,500 Years. Nature. 2009;460(7257):880–883. doi: 10.1038/nature08219. [DOI] [PubMed] [Google Scholar]
- McGranahan G, Balk D, Anderson B. The Rising Tide: Assessing the Risks of Climate Change and Human Settlements in Low Elevation Coastal Zones. Environment and Urbanization. 2007;19(1):17–37. [Google Scholar]
- Morenoff J. Neighborhood Mechanisms and the Spatial Dynamics of Birth Weight. American Journal of Sociology. 2003;108(5):976–1017. doi: 10.1086/374405. [DOI] [PubMed] [Google Scholar]
- Neumann CJ. NOAA Technical Memorandum NWS NHC 38. Coral Gables, Fla: National Hurricane Center; 1987. [accessed April 23, 2014]. The National Hurricane Center Risk Analysis Program (HURISK) http://www.nhc.noaa.gov/pdf/NWS-NHC-1987-38.pdf. [Google Scholar]
- Pielke RA, Landsea CW. Normalized Hurricane Damages in the United States: 1925–1995. Weather and Forecasting. 1998;13(3):621–631. [Google Scholar]
- Pielke RA, Gratz J, Landsea CW, Collins D, Saunders MA, Musulin R. Normalized Hurricane Damages in the United States: 1900–2005. Natural Hazards Review. 2008;9(1):29–42. [Google Scholar]
- Sampson RJ, Jeffrey M, Earls F. Beyond Social Capital: Spatial Dynamics of Collective Efficacy for Children. American Sociological Review. 1999;64(5):633–660. [Google Scholar]
- Shaffer W, Jelesnianski C, Chen J. Hurricane Storm Surge Forecasting. Paper read at OCEANS’86; Washington, D.C.. 1986. [Google Scholar]
- Smith V, Carbone J, Pope J, Hallstrom D, Darden M. Adjusting to Natural Disasters. Journal of Risk and Uncertainty. 2006;33(1):37–54. [Google Scholar]
- Turner BL, Kasperson RE, Matson APA, McCarthy JJ, Corell RW, Christensen L, Eckley N, Kasperson JX, Luers A, Martello ML, Polskya C, Pulsiphera A, Schiller A. A Framework for Vulnerability Analysis in Sustainability Science. Proceedings of National Academy of Science of USA. 2003;100(14):8074–8079. doi: 10.1073/pnas.1231335100. [DOI] [PMC free article] [PubMed] [Google Scholar]
- Vickery PJ, Skerlj PF, Twisdale LA. Simulation of Hurricane Risk in the U.S. Using Empirical Track Model. Journal of Structural Engineering. 2000;126(10):1222–1237. [Google Scholar]
- Willmott CJ, Ackleson SG, Davis RE, Feddema JJ, Klink KM, Legates DR, O’Donnell J, Rowe CM. Statistics for the Evaluation and Comparison of Models. Journal of Geophysical Research. 1985;90(C5):8995–9005. [Google Scholar]
- Womble J, Arn DA, Mehta KC, McDonald JR. The Enhanced Fujita Scale: For Use Beyond Tornadoes? In: Chen Shen-en, Diaz deLeon Alicia, Dolhon Anthony M, Drerup Michael J, Kevin Parfitt M., editors. Proceedings of the American Academy of Civil Engineers. Washington D.C: 2009. pp. 699–708. [DOI] [Google Scholar]
Associated Data
This section collects any data citations, data availability statements, or supplementary materials included in this article.