

Abstract
Social instability can adversely affect endocrine, immune and health outcomes, and recent evidence suggests that the sympathetic nervous system (SNS) might mediate these effects. We conducted two studies with adult male rhesus monkeys (Macaca mulatta) to understand how social conditions affect measures of SNS activity and immune function. In Experiment 1, animals were socialized in stable social conditions, then were switched to unstable (stressful) social conditions, then were returned to stable conditions. Analysis revealed quadratic effects for measures of behaviour, urinary metabolites of epinephrine and norepinephrine, and expression of immune response genes: as expected, social instability adversely impacted most measures, and the effects remediated upon re-imposition of stable conditions. Cortisol levels were unaffected. In Experiment 2, we used the sympathomimetic drug methamphetamine to challenge the SNS; animals also underwent socialization in stable or unstable groups. Surprisingly, while methamphetamine elevated plasma catecholamines, responses in lymph nodes tracked the social, and not the drug, condition: social instability upregulated the density of SNS fibres in lymph nodes and downregulated Type I interferon gene expression. Together, these results indicate that the SNS is extremely sensitive to social conditions; full understanding of the adverse effects of social instability on health should therefore incorporate measures of this health-relevant system.
Keywords: social stress, psychoneuroimmunology, lymph nodes, rhesus monkeys, stress hormones, sympathetic nervous system
1. Introduction
The order Primates is a remarkably social taxon, with the majority of species exhibiting year-round associations between adult members of both sexes. This degree of sociality stands in contrast to the typical associations found in other mammals, whose sociality largely involves females associating with immature young; adult male and female associations typically occur only when females are receptive [1]. The fact that primate sociality has evolved over tens of millions of years [2] suggests that their sociality is embedded in a basic way in their biology. This is, perhaps, most evident in central nervous system organization, in which areas of the brain appear specialized for processing explicitly social information (e.g. [3]).
Primates' sociality is also integral to their physical health. In humans, for example, bereavement, resulting from the loss of a significant social relationship through death, is associated with increased risk for morbidity and mortality [4]. Similarly, loneliness, which typically reflects a discrepancy between an individual's actual and desired social network, is also associated with health-related problems, including poor sleep quality, elevated blood pressure and cardiovascular disease [5,6]. Finally, there is considerable evidence from a variety of species that social isolation increases physiological dysregulation and morbidity [7] and that the presence of a valued social partner can buffer the negative effects of stressful situations [8].
There are two principal mechanisms by which the social environment has been found to get ‘under the skin’ to affect health. One involves stress-induced activation of the hypothalamic–pituitary–adrenal (HPA) axis, resulting in release of glucocorticoids (GCs) into circulation. Cortisol is the principal GC in primates. GCs play a variety of key physiological roles including stimulation of gluconeogenesis and inhibition of inflammation, both of which have obvious implications for health [9]. In immune cells, GC binding to the glucocorticoid receptor (GR) induces it to translocate to the nucleus where it can bind to GC response elements in promoter regions of genes and thereby affects gene transcription. In addition to stimulating transcription of anti-inflammatory genes, activated GRs can also repress transcription of pro-inflammatory genes by antagonizing pro-inflammatory transcription factors such as nuclear factor kappa B (NF-κB) and activator protein 1 (AP-1). Several studies with humans have identified reductions in GR signalling efficiency (GC resistance) as a potential mechanism for relationships between social stress and increased inflammation [10–14].
A second, much less studied pathway through which social processes can regulate health-relevant biology involves the sympathetic nervous system (SNS), that branch of the autonomic nervous system most responsible for the ‘fight or flight’ response. Activation of the SNS can regulate physiological processes via release of norepinephrine from sympathetic nerve terminals that innervate most visceral organs (including lymphoid tissues) and via release of epinephrine from the adrenal medulla. Immune cells bear β-2-adrenergic receptors, which transduce epinephrine and norepinephrine signals into activation of the cAMP/PKA signalling pathway. cAMP/PKA signalling activates several transcription factors that modulate expression of immune response genes, and thereby upregulate pro-inflammatory cytokines and downregulate Type I interferons involved in antiviral responses [15,16]. Pharmacological blockade of these receptors has been shown to blunt the negative immune effects of stress [17,18].
Our earlier studies [19,20] have documented significant harmful consequences of chronic social stress for rhesus monkeys infected by the simian immunodeficiency virus (SIV). Our model of social stress involves forming social groups of adult male rhesus monkeys for 100 min per day, with number and identity of partners randomly selected each day from a pool of 9–12 animals (depending on the study)—on any given day, group sizes range from two to four animals. Animals in these ‘unstable’ social groups are compared with adult males that meet for an equivalent amount of time per day, but who always meet in the same three-animal configuration and with the same partners. As might be expected, monkeys in the Unstable condition showed significantly higher levels of aggression and conflict, and significantly lower levels of affiliation, compared with monkeys in the Stable condition. Monkeys in Unstable conditions also survived for a significantly shorter time, showed evidence of GC desensitization and demonstrated higher densities of SNS nerve fibre innervation in lymph nodes [12,19,20]. With respect to the latter result, molecular analyses implicated increased expression of nerve growth factor (NGF) in mediating the lymph node neo-innervation observed under Unstable social conditions. Consistent with results from molecular analyses in vitro [15,21], increased nerve fibre density in vivo was associated with reduced expression of the Type I interferon genes that play a key role in innate antiviral responses [20]. These dynamics were likely a major part of the mechanism by which SIV replicated preferentially in the vicinity of catecholaminergic fibres in lymph nodes [22], a result that confirmed previous in vitro work showing that norepinephrine accelerates HIV-1 replication [23].
Because monkeys are randomly assigned to social conditions in our studies, these data suggest considerable environmental plasticity in SNS function. Here we report on new studies designed to further understand this plasticity and its implications for gene regulation in the primate immune system. In our first study, we examine immune gene expression changes during a change from Stable to Unstable social conditions. Inasmuch as our earlier studies [19] demonstrated that several weeks are necessary for the full impact of shifts in HPA axis regulation to occur in response to Unstable conditions, we selected for the present study a five-week duration for this condition, and quantified both plasma concentrations of cortisol and urinary metabolites of norepinephrine and epinephrine. Our hypothesis was that cortisol would not be affected, but the catecholamines would be. In addition, after animals had been shifted from Stable to Unstable conditions for five weeks, we shifted them back to Stable conditions in order to test the hypothesis that our measures would return to pre-stress levels; there is some evidence in the human literature that psychological interventions can impact disease-relevant measures of immunity [24], but to the best of our knowledge no such studies have examined measures of SNS activity.
In our second study, we examine how molecular mechanisms associated with viral replication are affected by administration of a known sympathomimetic drug, namely methamphetamine. Can this drug affect circulating levels of catecholamines, and if so, will this impact significantly the antiviral biology of lymph nodes? In a previous study [20], we demonstrated that Unstable social conditions for 37 weeks increased the density of SNS innervation of lymph nodes, which had implications for SIV replication [22]. Animals in our second study also experienced Stable or Unstable social conditions, but lymph node sampling occurred much sooner (two and ten weeks after SIV inoculation), so that we could determine whether the expected changes were evident early in the disease process.
2. General methods
In this section, we describe methods and procedures that were common to both studies; study-specific procedures are described later.
(a). Animals and apparatus
Subjects were adult male rhesus monkeys (Macaca mulatta), born and reared in 0.2 hectare outdoor enclosures at the California National Primate Research Center, each of which contained up to 150 monkeys of all age/sex classes. Mean (range) age was 7.8 (6.0–11.0) years, and 6.1 (5.6–6.9) years at the start of Studies 1 (n = 24) and 2 (n = 21), respectively. Animals were relocated to indoor housing at least three months prior to enrollment in the study [25]. Health screening, living conditions, socialization cages and procedures for daily transport from housing to socialization cage are described in [19]. Two socialization cages, situated 0.7 m apart and separated by an opaque barrier, were located in the test room.
(b). Stable and Unstable social conditions
Animals in Studies 1 and 2 were assigned randomly to either the Stable or Unstable social group conditions, with the proviso that Sociability (a personality characteristic that is known to influence biobehavioural functioning in these conditions: [26]) was approximately balanced across conditions. Animals in the Stable condition met daily in groups of three and membership in each Stable group did not change across the experiment. Animals in the Unstable social condition met for an equivalent time each day, although group size and membership varied daily: 2-, 3- and 4-member groups were formed each day from among the pool of animals assigned to this condition. Groups were formed 3–5 days/week, and each socialization session was 100 min in duration. Two socialization sessions were always run simultaneously (one in each socialization cage); during experimental periods when Stable and Unstable groups were being formed daily, each socialization session included one Stable and one Unstable group. All monkeys in either social condition were unfamiliar with each other prior to the first Stable or Unstable social group formation.
(c). Basal blood sampling
Basal blood samples were always drawn between 15.00 and 15.30 h, from animals while they were in their housing cage, on days when they did not experience socialization. Animals were trained to extend their arms for phlebotomy; chemical restraint was not used.
(d). Cortisol assay
During basal bleeds, 2 ml of blood were placed in tubes containing EDTA, which were spun in a refrigerated (4°C) centrifuge at 1900g for 10 min. Plasma was removed and aliquoted into tubes for storage at –80°C and was later assayed in duplicate using commercially available radioimmunoassay kits (Diagnostics Products Corporation, Los Angeles, CA, USA). Inter- and intra-assay coefficients of variation were 8.7% and 6.7%, respectively, for Experiment 1, and 5.3% and 5.2%, respectively, for Experiment 2.
(e). Simian immunodeficiency virus inoculation
At specified time points for each Experiment (see §§3(a)i and 4(a)i) each animal was anaesthetized with ketamine hydrochloride (10 mg kg−1) and was inoculated intravenously with SIVmac251 virus (grown in rhesus peripheral blood mononuclear cells (PBMCs) and diluted in phosphate-buffered saline to final dilution of 500 TCID50) in a 0.5 ml volume.
(f). Simian immunodeficiency virus-specific vRNA and IgG
For Experiment 1, plasma was assayed for viral RNA copy number using a branched DNA signal amplification assay [27] and for SIV-specific IgG using ELISA [28]. For Experiment 2, the same ELISA was used for IgG, but viral copy number was assessed using real-time RT-PCR according to published procedures [29].
(g). Euthanasia
Animals were euthanized either at the end of each study, or if they showed signs of endstage SIV disease. Criteria for euthanasia included non-response to therapy for opportunistic disease, weight loss or presence of neurological signs. Euthanasia was accomplished by i.v. overdose of pentobarbital, a method consistent with recommendations of the American Veterinary Medical Association. Decisions about euthanasia were made by California National Primate Research Center (CNPRC) staff veterinarians who were unfamiliar with the experimental assignment of the animals.
3. Experiment 1: effects of social instability, and return to social stability, on endocrine and immune responses
The goal of Experiment 1 was to determine whether a change from Stable to Unstable conditions affected immune and disease-relevant measures, and whether a return to Stable conditions reversed the changes seen. All animals experienced Stable social conditions for 12 weeks preceding, and 10 weeks following, inoculation with SIV. Starting at 10 weeks post-inoculation (p.i.), sets of animals either remained in Stable conditions, or were switched to Unstable conditions for five-week periods, after which they were returned to Stable conditions (see below). We assessed cortisol in this study, but we were most interested in determining whether the social manipulation affected measures of SNS activity. We also assessed two disease-specific measures: SIV-specific IgG and viral copy number in plasma. Finally, we tested hypotheses about three specific immune mechanisms that have been shown to be affected by stressful manipulations: (i) Type I interferons (specifically interferon-α and its effector proteins), which generally serve antiviral functions and which are typically suppressed by stress [15,20]; (ii) inflammatory cytokines, such as interferon-γ (IFNG), tumour necrosis factor-α (TNFA) and interleukin-6 (IL6), the synthesis and release of which are elevated by stress [15,30], and (iii) natural killer (NK) cells, important components of the innate immune response that target virally infected cells, and which are usually suppressed by stress [31]. Our aim was to determine whether our social stress manipulation led to parallel changes in these mechanisms, and whether reversal of the social condition reversed the stress-induced changes.
(a). Methods
(i). Experimental design
Twenty-four animals were randomly assigned to 12-member cohorts, and experienced daily Stable and Unstable conditions in a crossover design. The experiment comprised six Phases across 42 weeks (table 1a). For Phase 1, all animals were placed into three-member Stable social groups for 12 weeks, after which they were inoculated with SIV. Animals in each cohort continued in their familiar Stable groups for an additional 10-week period (Phase 2, p.i.). The remaining four Phases were each five weeks in duration. For Phase 3, members of cohort 1 experienced Unstable social conditions daily for five weeks, while members of cohort 2 continued in their Stable groups; for Phase 4, the cohort 1 animals were returned to their original Stable groups. For Phase 5, animals in cohort 2 were changed to Unstable conditions, while members of cohort 1 remained in Stable conditions, after which cohort 2 animals were returned to their familiar Stable conditions (Phase 6).
Table 1.
Diagram of experimental design (a) and analytic strategy (b) for Experiment 1.
| (a) experimental design | ||||||
| Phase 1 | Phase 2 | Phase 3 | Phase 4 | Phase 5 | Phase 6 | |
| twelve weeks | ten weeks | five weeks | five weeks | five weeks | five weeks | |
| cohort 1 | Stable | Stable | Unstable | Stable | Stable | Stable |
| cohort 2 | Stable | Stable | Stable | Stable | Unstable | Stable |
| (b) analysis | ||||||
| Stable | Unstable | Post-Stable | ||||
| cohort 1 | Phase 2 | Phase 3 | Phase 4 | |||
| cohort 2 | Phase 4 | Phase 5 | Phase 6 | |||
(ii). Behavioural data collection
Behavioural data were collected during all socialization sessions by trained observers using The OBSERVER software [32]. Behaviour categories used were those commonly used for this species [33], and behavioural observers demonstrated at least 85% agreement on behaviour categories prior to the start of the study. Frequency of aggression was recorded during the first 30 min and last 10 min of each observation session using all-occurrences sampling [34], and durations of grooming and non-social behaviour (time spent out of arm's reach of another animal) were obtained between minutes 55 and 90 using focal animal sampling [34]. Each all-occurrences and focal session was 5-min in duration, and observers alternated 5-min sessions of data collection between the two cages in the test room. Behavioural data were used principally as a manipulation check. For aggression, we counted the number of 5-min sessions in which aggression was seen. For durations of grooming and non-social, weekly means (in seconds per day) were computed for each individual, and weekly data were averaged for each Phase.
(iii). Urine and blood collection and processing
Details of these procedures are given in electronic supplementary material. Briefly, urine was obtained by placing stainless steel pans under each animal's housing cage prior to 18.00 h where they remained until 07.00 the next morning. Overnight urines were obtained on specific Monday nights during all Phases, and baseline blood samples were drawn via armpull, as described earlier, on each Tuesday following urine collection. Values examined for urine and blood measures were those obtained during the last week of the Stable condition that preceded the Unstable condition, and during week 2 of the Unstable and Post-Stable conditions (see below and table 1b). PBMCs (used for assays of NK cell function and immune gene expression) were obtained for each animal during the final week of each Phase.
(iv). Urinary nephrines assay
Concentrations of metanephrine and normetanephrine (urinary metabolites of epinephrine and norepinephrine, respectively) were assayed using a commercially available radioimmunoassay kit (Labor Diagnostika Nord GmbH, Nordhorn, Germany), which was validated for rhesus monkeys. Inter- and intra-assay coefficients of variation were 12.5% and 8.4% for metanephrine, and 9.3% and 5.6% for normetanephrine, respectively. Urine was also assayed for creatinine using a commercially available colorimetric kit, QuantiChrom Creatinine Assay Kit, DICT-500 (BioAssay Systems, Hayward, CA, USA). Values for metanephrine and normetanephrine reflect nanogram nephrines/milligram creatinine.
(v). Natural killer cell assay
NK cell activity was measured using a standard chromium release assay, as described in the electronic supplementary material. Cytotoxicity is measured as lytic units.
(vi). Cytokine mRNA expression
Frozen PBMCs were thawed and lysed immediately in Trizol, and real-time RT-PCR was performed using previously published procedures [35,36]. Gene expression was quantified using the ΔΔ CT method: for each sample, gene expression was normalized to a housekeeping gene (GAPDH), and gene expression responses to the social manipulations were expressed as a fold-change from expression levels measured from a pre-experiment blood sample (also normalized to GAPDH) drawn from each animal. Gene expression was quantified for interferon-α (IFNA), three genes stimulated by Type 1 interferons (OAS, Mx, IP-10/CXCL10), and inflammatory cytokines interferon-γ (IFNG), tumour-necrosis factor (TNF) α and interleukin-6 (IL6).
(vii). Statistical analysis
The statistical analysis focused on changes resulting from a shift from Stable to Unstable social conditions, as well as the shift back again to Stable conditions. Because of the crossover design, we combined data for cohorts 1 and 2 to reflect Stable (Phase 2 for cohort 1, Phase 4 for cohort 2), Unstable (Phases 3 and 5, respectively) and Post-Stable (Phases 4 and 6, respectively) conditions (table 1b). Because of disease-related mortality, sample size was reduced to n = 16 for most analyses (nine animals in cohort 1, seven animals in cohort 2), though for the analyses examining data from the cryopreserved PBMC, complete data were available for n = 12 (mRNA expression) or n = 7 (NK assay) of the 16 animals. All animals completed their Post-Stable condition except for one cohort 2 animal that completed three of the five-week Phase 6 period. Thus, these analyses reflect the effects of social conditions on largely healthy (though SIV-infected) monkeys. Analysis of the aggression data (number of 5-min intervals in which aggression was recorded) used binomial tests to contrast the social conditions. Repeated measures univariate analysis of variance was used for all other data analyses, with specific planned tests for quadratic effects (which assess whether values rise and then fall (or vice versa) over the three social conditions). Data not meeting assumptions of parametric tests were transformed as needed.
(b). Results
(i). Manipulation check: behaviour
Unstable conditions led to a reduction in grooming duration and an increase in time spent non-social, as well as increased occurrences of aggression; all effects were reversed when Stable conditions were re-imposed. This was indicated by (i) significant binomial tests showing that the proportion of 5-min periods during which aggression was seen increased from 0.78% of periods (Stable) to 3.10% of periods (Unstable) (p < 0.001), and subsequently declined to 0.36% of periods (Post-Stable) (p < 0.001) and (ii) highly significant quadratic effects for duration of grooming (F1,15 = 9.82, p = 0.007), and duration of time non-social (F1,15 = 22.02, p < 0.001; figure 1).
Figure 1.
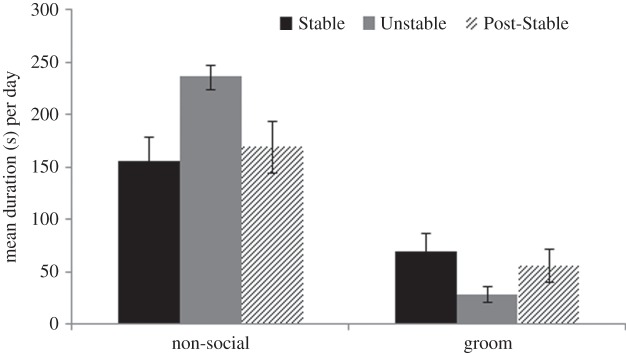
Mean (s.e.) duration (in seconds) per day of time spent non-social, and time spent grooming under Stable, Unstable and Post-Stable social conditions. All quadratic effects are significant (p < 0.01).
(ii). Urinary catecholamine metabolites and plasma cortisol
Social conditions resulted in changes in urinary concentrations of metabolites of epinephrine and norepinephrine, as indicated by a significant quadratic effect for metanephrine (F1,15 = 4.51, p = 0.05), and a trend for normetanephrine (F1,15 = 3.59, p = 0.077). No effect was found for cortisol (p = 0.69; figure 2).
Figure 2.
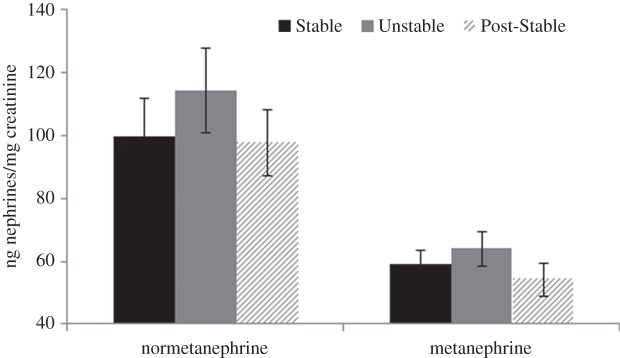
Mean concentrations (corrected for creatinine) of urinary metabolites of epinephrine (i.e. metanephrine) and norepinephrine (i.e. normetanephrine) under Stable, Unstable and Post-Stable social conditions. Quadratic effect for metanephrine is significant (p = 0.05) and effect for normetanophrine is near-significant (p = 0.077).
(iii). Natural killer activity
Unstable social conditions led to a nearly significant impairment in NK function compared to the Pre- and Post-Stable social conditions (quadratic: F1,6 = 5.69, p = 0.054; figure 3).
Figure 3.
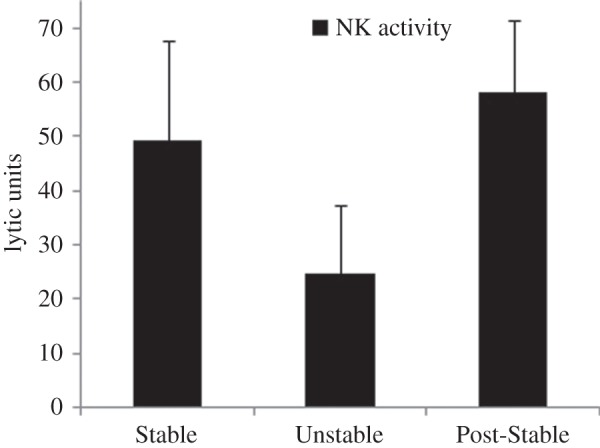
Mean number of lytic units of NK cell activity under Stable, Unstable and Post-Stable social conditions. Quadratic effect is near-significant (p = 0.054).
(iv). Cytokine mRNA expression
Significant quadratic effects were seen for the three inflammation-associated genes IFNG (F1,11 = 14.51, p = 0.003), IL6 (F1,11 = 6.46, p = 0.027) and (log-transformed) TNF (F1,11 = 7.42, p = 0.02). As shown in figure 4, Unstable social conditions resulted in greater expression of these pro-inflammatory genes. By contrast, no effect of social condition was found for gene expression of IFNA and its associated effector proteins (Mx, OAS, IP-10).
Figure 4.
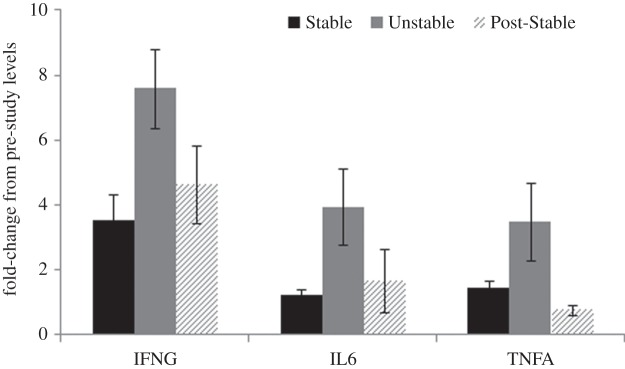
Mean fold-change (from pre-study levels) in mRNA expression in PBMCs for IFNG, IL6 and TNFA across Stable, Unstable and Post-Stable social conditions. All quadratic effects are significant (p < 0.05).
(v). Simian immunodeficiency virus-related measures
No effects were found that could be attributed to the changes in the social conditions; the SIV-specific antibody response showed a significant linear increase across the three conditions (F1,15 = 12.74, p = 0.003), while SIV RNA expression was unchanged across the three conditions (p > 0.90). Mean (s.e.) numbers (log-transformed) of SIV RNA copies per millilitre were 6.205 (0.229), 6.214 (0.226) and 6.216 (0.256) for Stable, Unstable and Post-Stable conditions, respectively.
(c). Discussion
This study demonstrated that endocrine, molecular and immune measures are plastic within a period of weeks in response to both positive and negative social conditions: social stress increased SNS activity, upregulated pro-inflammatory gene expression and suppressed NK cell function, and these measures largely returned to pre-stress levels when stable social conditions were re-imposed. These effects were likely tied to the behavioural differences observed: as expected, social instability resulted in less affiliation, more time alone and higher measures of conflict. As we have found in other studies, however, the social manipulations did not have a significant impact on SIV-specific measures [19].
No effects of social instability were found for plasma cortisol concentrations, as expected. Although cortisol concentrations were likely elevated during Unstable social group formations, our earlier work with this model of social stress [19] revealed that the stress-induced regulatory shift in the HPA axis, which results in significantly lower basal concentrations and enhanced negative feedback for all animals in Unstable conditions, takes about eight weeks to develop; in this study, concentrations were assessed after only two weeks of social instability. Nevertheless, this time period was sufficient to influence concentrations of catecholamine metabolites in urine, suggesting a more rapid impact on the SNS response than on the HPA response.
To explore in more detail the role played by SNS activity in our social stress model, in the next study, we altered activity of the SNS using methamphetamine, a sympathomimetic drug, while animals were in Stable or Unstable conditions. We also examined the effects of stress and drug in two compartments: the circulation and in lymph nodes. As described earlier, our previous work showed that 37 weeks of Unstable social conditions resulted in higher densities of SNS nerve fibre innervation of lymph nodes, which seemed to be mediated by upregulation of NGF [19]. This was associated with reduced expression of antiviral Type I interferon genes, such as IFNA. Direct examination of lymphoid tissue can provide a more accurate understanding of immune–pathogen dynamics, and the role that social factors can play in disease, than can measures obtained from peripheral blood [37].
4. Experiment 2: effects of social instability and methamphetamine challenge on lymph node biology
(a). Methods
(i). Experimental design
We employed a 2 × 2 factorial design, in which animals were randomly assigned to Stable versus Unstable conditions, and Methamphetamine versus Saline treatment. Initially, six animals per cell were assigned, but data from three animals were dropped owing to health problems unrelated to social or drug conditions—a foot injury in the animal's living cage (Unstable, Saline), an inflamed prostate requiring steroid treatment that would compromise our study (Stable, Methamphetamine) and a complication from a lymph node biopsy (Stable, Saline). One to three weeks prior to start of the social conditions, animals experienced two basal bleeds one week apart, and a cisterna magna puncture to obtain cerebrospinal fluid (not described here). Stable or Unstable social group formations began as described above. After six social sessions, animals began to receive either Methamphetamine or Saline (see below), and four weeks later animals were inoculated with SIV.
(ii). Methamphetamine/saline administration
We followed the procedure described in [38]. d-Methamphetamine hydrochloride (Sigma, #M8750) was diluted in sterile saline to a concentration of 20 mg ml−1. A four-week ramp-up period was used: animals began with an intramuscular injection of 0.1 mg kg−1 once per day, and over the four-week period received escalating doses until reaching the final dose of 0.75 mg kg−1 twice per day (at 06.30–07.00 and 14.00–14.30), a dose that is similar to those used by humans [38]. Following the ramp-up period, animals were maintained on the regimen of 0.75 mg kg−1 twice per day, five days per week, throughout the study. Animals in the Saline condition received an equivalent volume of vehicle only.
(iii). Lymph node biopsies
Biopsies were performed at three time points: prior to SIV inoculation (midway through the meth ramp-up), at week 2 p.i., and at week 10 p.i. Animals were sedated and an incision was made in the axillary area. Lymph nodes were located manually, and 1–3 nodes were removed by dissection. The surgical site was closed with sutures and the animals were given pain medication per veterinary recommendation during recovery.
(iv). Analysis of sympathetic nervous system nerve fibre density
Sixteen micro-sections of fresh frozen lymph nodes were assayed for catecholaminergic nerve fibre density using glyoxylic acid chemofluorescence, as previously described [20,22]. Unbiased stereological analyses quantified the frequency of catecholaminergic varicosities per 250 µ2 tissue quadrat within the lymph node parenchyma. The log-density of varicosities was analysed in the context of a drug × social condition factorial design using mixed effect linear models treating multiple quadrat density values from each tissue sample as repeated measures, with potential correlation among observations modelled using a compound symmetry covariance matrix.
(v). Gene expression
mRNA from adjacent lymph node sections was assayed using real-time RT-PCR to quantify a conserved region of the IFNA gene family and transcripts for IFNB, IFNG, NGF, IL6, TNF and SIV env as described for previous studies [20–22]. Assays were performed using commercially available reagents (enzymes: Quantitect RT-PCR, Qiagen Inc.; primers/probes: ABI Gene Expression Assays, Applied Biosystems Inc.). Replicate determinations from each sample were normalized to parallel determinations of actin β (ACTB) mRNA and analysed using standard threshold cycle analyses in the context of a mixed effect linear model involving a Drug × Social condition factorial design. Parallel RT-PCRs analysed the same transcripts in PBMC.
(vi). Epinephrine/norepinephrine
Plasma concentrations of epinephrine and norepinephrine were assayed in duplicate using commercial radioimmunoassay kits (ALPCO Diagnostics, Salem, NH). Intra- and inter-assay coefficients of variation were 8.38% and 11.91%, respectively, for epinephrine, and 8.25% and 10.01%, respectively, for norepinephrine. Values are picograms per millilitre.
(vii). Statistical analyses
Plasma concentrations of epinephrine, norepinephrine and cortisol were assessed at three time points: preinoculation (midway through the drug ramp-up phase) and at weeks 4 and 8 p.i. from basal blood samples using analysis of variance to examine effects of drug, social condition and time. Anti-SIV IgG was assessed at week 8 p.i., and SIVRNA (vRNA) levels were examined at weeks 2 and 10 p.i. using ANOVA. Measures were log-transformed as needed.
(b). Results
(i). Manipulation check: plasma catecholamine concentrations
Across the three time points sampled, animals receiving Methamphetamine displayed significantly higher concentrations of plasma catecholamines. Concentrations of both norepinephrine and epinephrine were more than twice as high in the Methamphetamine group starting in the ramp-up period and extending across the first eight weeks p.i. Analyses were significant for norepinephrine (F1,17 = 17.16, p = 0.001) and epinephrine (F1,17 = 8.34, p = 0.010; both were log-transformed for analysis; figure 5 shows untransformed concentrations). There were no effects of social condition or interactions with time.
Figure 5.

Mean plasma concentrations of epinephrine and norepinephrine prior to SIV inoculation (mid-way through methamphetamine ramp-up; see text), at four weeks p.i., and at eight weeks p.i. for animals receiving methamphetamine or saline (vehicle) injections. Concentrations for the methamphetamine group were significantly greater than for the control group.
(ii). Effects of methamphetamine
Despite successful manipulation of SNS activity, we found little evidence of significant immunoregulatory impacts. In RT-PCR analyses of lymph nodes and PBMCs sampled at the three time points, analyses showed no significant main effect of methamphetamine treatment on mRNA for the SNS neurotrophic factor NGF or key immunoregulatory genes such as Type I interferons IFNA and IFNB, the pro-inflammatory Type II interferon IFNG, or other pro-inflammatory cytokine transcripts IL6 and TNF (all p > 0.05 at each time point). Finally, we found no effect of methamphetamine on either plasma concentrations of cortisol, plasma SIV viral load, SIV-specific IgG or lymph node concentrations of mRNA for the SIV env gene (an indicator of active SIV replication).
(iii). Effects of social stress
Consistent with previous studies [20], analyses of lymph node tissues harvested at two weeks post-infection showed that unstable social conditions significantly upregulated the density of catecholaminergic nerve fibres (p = 0.027). These effects were not qualified by methamphetamine (i.e. no significant main drug × social condition interaction), so we pooled over drug-exposed and -unexposed animals for analyses examining the potential molecular causes and consequences of social effects. RT-PCR analyses confirmed that social stress increased gene expression for the SNS neurotrophic factor NGF (p = 0.028; figure 6a). Analyses also documented immunoregulatory alterations similar to those previously observed, including reduced expression of genes encoding Type I interferons involved in innate antiviral responses (IFNA: p = 0.038; IFNB: p = 0.031) and increased expression of the pro-inflammatory Type II interferon IFNG (p = 0.011). While plasma cortisol concentrations showed a significant social condition by time interaction (F2,34 = 3.77, p = 0.033; members of both groups showed a decline from preinoculation to week 4, but only animals in Stable conditions rebounded by week 8), measures of SIV-specific IgG and plasma SIV viral load were unaffected. (For example, week 2 log-transformed values for viral load were 5.842 (0.247) and 6.085 (0.224) copies ml−1 for animals in the Stable and Unstable conditions, respectively; comparable values at week 10 were 4.200 (0.280) and 4.235 (0.228) copies ml−1; see figure 6b).
Figure 6.
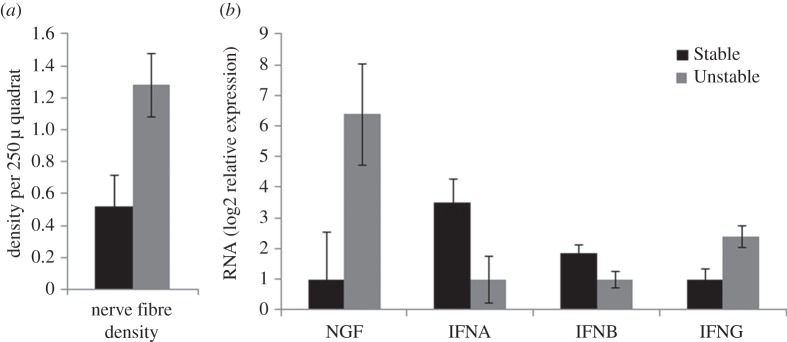
(a) Mean density of catecholamine-containing varicosities in lymph node sections of animals in Stable or Unstable social conditions. (b) Mean levels of gene expression for the SNS neurotrophin NGF, as well as for genes encoding Type I interferons (IFNA, IFNB) and the pro-inflammatory Type II interferon IFNG. All group differences are significant (p < 0.05).
(c). Discussion
Although methamphetamine clearly elevated plasma concentrations of epinephrine and norepinephrine, we found no effects on lymph node biology relevant to viral infection; rather, the effects that we saw were explained by social factors—animals in Unstable social conditions had a greater density of catecholaminergic nerve fibres in lymph nodes, which was associated with an upregulation of gene expression for NGF. Moreover, the environment created within these tissues was one that favours replication of immunodeficiency viruses—genes associated with innate antiviral responses were downregulated while inflammation-associated genes were upregulated. While these results are very similar to those seen in our earlier work [20], which was conducted 37 weeks after the start of the Unstable social condition, the present results demonstrate that these socially induced changes in lymph node biology occur within eight weeks after experiencing social instability (i.e. animals had been in Stable or Unstable conditions for nearly six weeks prior to SIV inoculation; consequently, results from week 2 p.i. biopsies reflect eight weeks of social experience).
Plasma concentrations of catecholamines did not appear to be affected by our social manipulation. It is possible that our study was under-powered to detect such an effect, particularly with the huge effect on these measures resulting from methamphetamine administration—there were only 10 animals altogether in the non-drug group, half of which were in each social condition. It is also possible that urine may provide a better medium to identify SNS changes owing to social conditions (as in Experiment 1), inasmuch as concentrations of catecholamines (or their metabolites) in urine reflect a broader time-frame for accumulation, compared to plasma. We did, however, see that, as in our earlier study [19], but unlike in Experiment 1, plasma concentrations of cortisol were responsive to the social manipulation. Our earlier study showed that basal cortisol concentrations in plasma take several weeks to reflect a socially induced regulatory shift. Although the measures described above for cortisol are described as having been obtained at weeks 4 and 8 p.i., the additional six weeks of social experience prior to SIV inoculation reflect that our data were actually obtained 10–14 weeks after the initiation of the social conditions, sufficient time for the regulatory shift to occur.
5. General discussion
Converging lines of evidence indicate that, for social species, our basic biology is highly responsive to the qualities of our social relationships [39]. This responsiveness probably arose in evolutionary time owing to the fitness consequences of being embedded in an affiliative social network—fitness advantages can accrue in the basic areas of resource acquisition, protection from predators and access to potential mates. It is clear that the quality of one's social relationships can also impact one's health [13,19,39,40]. The principal mechanisms by which this can happen involve changes in functioning of major stress–response systems, like the HPA axis and the SNS, and through the impact that these changes have on other tissues, such as those of the immune system. While the HPA axis has received considerable attention in the past few decades, the goal of our studies was to examine in more detail how social processes can affect the SNS. Using our well-characterized model of social stress in adult male rhesus monkeys [16,23], we contrasted how social instability might affect catecholamine metabolite levels and immune function during a period when the HPA axis is likely to be minimally impacted (Experiment 1), and how these systems might be affected through pharmacological manipulation (Experiment 2).
Our results show considerable plasticity in these systems. That social stress can have an impact on various measures of immune function has long been known [15,20,30,31]. What has been studied far less, and what our data from Experiment 1 demonstrate, is that a return to stable social conditions can reverse these effects within a relatively short time-frame. These results add to the small, but growing literature that is focused on identifying psychological interventions that can positively affect immune function in ill patients [24]. Our results also show (Experiment 2), rather remarkably, that plasticity in lymphoid tissue innervation and immune biology is more associated with the social environment than with pharmacological manipulation of catecholamine levels by methamphetamine administration, at least within the range of doses that humans are likely to encounter. Exactly why this happens remains unclear, but our data suggest that stimulation of the SNS by social means (as demonstrated in Experiment 1) leads to different consequences from stimulation through pharmacological means. From a psychological perspective, of course, ingestion of a drug and experiencing conflictual social interactions probably have different meanings to a member of a social species; social relationships are likely to exert more tonic effects, in contrast to the more phasic effects resulting from acute drug administration. To be sure, the question of how drug administration might affect lymph node biology remains open.
Finally, we note that while the effects of our social manipulation had substantial impact on immune function and immune biology within lymphoid tissue, these effects failed to have an effect on SIV-related measures, specifically, viral RNA and virus-specific IgG measured in peripheral blood at 10 weeks p.i. The circulation represents an easily accessible compartment diagnostically, but it is an imperfect window into processes occurring in lymphoid tissue [37], which is largely where pathogen–immune system interactions take place. In fact, our previous study has demonstrated that SIV replication occurs in lymph nodes in proximity to catecholaminergic fibres which, as we have demonstrated in Experiment 2, are increased in density by social stress [20,22]. Ultimately, processes occurring in the microenvironment of lymph nodes will be reflected in the periphery, but we are aware of no studies investigating the relative time course of measures of viral replication in these two compartments.
In conclusion, measures of endocrine activity, immune function and lymph node biology demonstrate remarkable plasticity in response to social conditions, showing changes in response to conditions becoming stressful, and, at least for plasma and urine measures, changes back to pre-stress levels when unstable social conditions end. Our data provide strong evidence for the role played by social relationships in regulating health-relevant immunological processes in social species.
Supplementary Material
Supplementary Material
Acknowledgements
We thank K. Abel, J. Arevalo, B. Beaman, C. Brennan, N. Capitanio, S. Dandekar, L. Del Rosso, K. Farkas, E. Ferrer, N. Maninger, M. Marthas, M. McChesney, S. P. Mendoza, A. Rosenthal, S. Sankaran-Walters, A. Spinner, E. Tarara, K. van Rompay, G. Vicino, J. Yee and Animal Care, Research Services, and Veterinary staff at CNPRC for technical assistance.
Ethics statement
All procedures were conducted according to the Guidelines for Use and Care of Laboratory Animals of the National Research Council and according to CNPRC SOPs. The CNPRC is accredited by the Association for the Assessment and Accreditation of Laboratory Animal Care. Experimental protocols were approved prior to implementation by the University of California, Davis IACUC.
Data accessibility
The datasets supporting this article have been uploaded as part of the electronic supplementary material.
Author contributions
J.P.C. conceived and conducted the studies, performed data collection and analysis, and drafted the manuscript. S.W.C. participated in design of the studies, conducted all lymph node work and data analysis, and edited the manuscript. Both authors give final approval for publication.
Funding statement
J.P.C. and S.W.C. were supported by NIH grant nos. MH049033 and DA024441. J.P.C. was also supported by NIH grant no. OD011107 and S.W.C. was also supported by NIH grant no. AI52737.
Conflict of interests
We have no competing interests.
References
- 1.van Schaik CP, Kappeler PM. 1997. Infanticide risk and the evolution of male–female association in primates. Proc. R. Soc. Lond. B 264, 1687–1694. ( 10.1098/rspb.1997.0234) [DOI] [PMC free article] [PubMed] [Google Scholar]
- 2.Di Fiore A, Rendall D. 1994. Evolution of social organization: a reappraisal for primates by using phylogenetic methods. Proc. Natl Acad. Sci. USA 91, 9941–9945. ( 10.1073/pnas.91.21.9941) [DOI] [PMC free article] [PubMed] [Google Scholar]
- 3.Frith CD. 2007. The social brain? Phil. Trans. R. Soc. B 362, 671–678. ( 10.1098/rstb.2006.2003) [DOI] [PMC free article] [PubMed] [Google Scholar]
- 4.Stroebe M, Schut H, Stroebe W. 2007. Health outcomes of bereavement. Lancet 370, 1960–1973. ( 10.1016/S0140-6736(07)61816-9) [DOI] [PubMed] [Google Scholar]
- 5.Cacioppo S, Capitanio JP, Cacioppo JT. 2015. Toward a neurology of loneliness. Psychol Bull. 140, 1464–1504. ( 10.1037/a0037618) [DOI] [PMC free article] [PubMed] [Google Scholar]
- 6.Luo Y, Hawkley LC, Waite LJ, Cacioppo JT. 2012. Loneliness, health, and mortality in old age: a national longitudinal study. Soc. Sci. Med. 74, 907–914. ( 10.1016/j.socscimed.2011.11.028) [DOI] [PMC free article] [PubMed] [Google Scholar]
- 7.Cacioppo JT, Cacioppo S, Cole SW, Capitanio JP, Goossens L, Boomsma DI. 2015. Loneliness across phylogeny and a call for comparative studies and animal models. Perspect. Psychol. Sci. ( 10.1177/1745691614564876) [DOI] [PMC free article] [PubMed] [Google Scholar]
- 8.Hennessy MB, Kaiser S, Sachser N. 2009. Social buffering of the stress response: diversity, mechanisms, and functions. Front. Neuroendocrinol. 30, 470–482. ( 10.1016/j.yfrne.2009.06.001) [DOI] [PubMed] [Google Scholar]
- 9.Cavigelli SA, Caruso MJ. 2015. Sex, social status and physiological stress in primates: the importance of social and glucocorticoid dynamics. Phil. Trans. R. Soc. B 370, 20140103 ( 10.1098/rstb.2014.0103) [DOI] [PMC free article] [PubMed] [Google Scholar]
- 10.Cacioppo JT, Cacioppo S, Capitanio JP, Cole SW. 2015. The neuroendcrinology of social isolation. Annu. Rev. Psychol. 66, 733–767. ( 10.1146/annurev-psych-010814-015240) [DOI] [PMC free article] [PubMed] [Google Scholar]
- 11.Cole SW. 2008. Social regulation of leukocyte homeostasis: the role of glucocorticoid sensitivity. Brain Behav. Immun. 22, 1049–1055. ( 10.1016/j.bbi.2008.02.006) [DOI] [PMC free article] [PubMed] [Google Scholar]
- 12.Cole SW, Mendoza SP, Capitanio JP. 2009. Social stress desensitizes lymphocytes to regulation by endogenous glucocorticoids: insights from in vivo cell trafficking dynamics in rhesus macaques. Psychosom. Med. 71, 591–597. ( 10.1097/PSY.0b013e3181aa95a9) [DOI] [PMC free article] [PubMed] [Google Scholar]
- 13.Cole SW, Hawkley LC, Arevalo JM, Sung CY, Rose RM, Cacioppo JT. 2007. Social regulation of gene expression in human leukocytes. Genome Biol. 8, R189 ( 10.1186/gb-2007-8-9-r189) [DOI] [PMC free article] [PubMed] [Google Scholar]
- 14.Miller GE, Cohen S, Ritchey AK. 2002. Chronic psychological stress and the regulation of pro-inflammatory cytokines: a glucocorticoid-resistance model. Health Psychol. 21, 531–541. ( 10.1037/0278-6133.21.6.531) [DOI] [PubMed] [Google Scholar]
- 15.Irwin MR, Cole SW. 2011. Reciprocal regulation of the neural and innate immune systems. Nat. Rev. Immunol. 11, 625–632. ( 10.1038/nri3042) [DOI] [PMC free article] [PubMed] [Google Scholar]
- 16.Padro CJ, Sanders VM. 2014. Neuroendocrine regulation of inflammation. Semin. Immunol. pii, S1044–S5323. ( 10.1016/j.smim.2014.01.003) [DOI] [PMC free article] [PubMed] [Google Scholar]
- 17.Hanke ML, Powell ND, Stiner LM, Bailey MT, Sheridan JF. 2012. Beta adrenergic blockade decreases the immunomodulatory effects of social disruption stress. Br. Behav. Immun. 26, 1150–1159. ( 10.1016/j.bbi.2012.07.011) [DOI] [PMC free article] [PubMed] [Google Scholar]
- 18.Powell ND, et al. 2013. Social stress up-regulates inflammatory gene expression in the leukocyte transcriptome via β-adrenergic induction of myelopoiesis. Proc. Natl Acad. Sci. USA 110, 16 574–16 579. ( 10.1073/pnas.1310655110) [DOI] [PMC free article] [PubMed] [Google Scholar]
- 19.Capitanio JP, Mendoza SP, Lerche NW, Mason WA. 1998. Social stress results in altered glucocorticoid regulation and shorter survival in simian acquired immune deficiency syndrome. Proc. Natl Acad. Sci. USA 95, 4714–4719. ( 10.1073/pnas.95.8.4714) [DOI] [PMC free article] [PubMed] [Google Scholar]
- 20.Sloan EK, Capitanio JP, Tarara RP, Mendoza SP, Mason WA, Cole SW. 2007. Social stress enhances sympathetic innervation of primate lymph nodes: mechanisms and implications for viral pathogenesis. J. Neurosci. 27, 8857–8865. ( 10.1523/JNEUROSCI.1247-07.2007) [DOI] [PMC free article] [PubMed] [Google Scholar]
- 21.Collado-Hidalgo A, Sung C, Cole SW. 2006. Adrenergic inhibition of innate antiviral response: PKA blockade of Type I interferon gene transcription mediates catecholamine support for HIV-1 replication. Brain Behav. Immun. 20, 552–563. ( 10.1016/j.bbi.2006.01.005) [DOI] [PubMed] [Google Scholar]
- 22.Sloan EK, Tarara RP, Capitanio JP, Cole SW. 2006. Enhanced SIV replication adjacent to catecholaminergic varicosities in primate lymph nodes. J. Virol. 80, 4326–4335. ( 10.1128/JVI.80.9.4326-4335.2006) [DOI] [PMC free article] [PubMed] [Google Scholar]
- 23.Cole SW, Korin YD, Fahey JL, Zack JA. 1998. Norepinephrine accelerates HIV replication via protein kinase A-dependent effects on cytokine production. J. Immunol. 161, 610–616. [PubMed] [Google Scholar]
- 24.Antoni MH. 2013. Psychosocial intervention effects on adaptation, disease course and biobehavioral processes in cancer. Br. Behav. Immun. 30, S88–S98. ( 10.1016/j.bbi.2012.05.009) [DOI] [PMC free article] [PubMed] [Google Scholar]
- 25.Capitanio JP, Kyes RC, Fairbanks LA. 2006. Considerations in the selection and conditioning of Old World Monkeys for laboratory research: animals from domestic sources. ILAR J. 47, 294–306. ( 10.1093/ilar.47.4.294) [DOI] [PubMed] [Google Scholar]
- 26.Capitanio JP, Abel K, Mendoza SP, Blozis SA, McChesney MB, Cole SW, Mason WA. 2008. Personality and serotonin transporter genotype interact with social context to affect immunity and viral set-point in simian immunodeficiency virus disease. Brain Behav. Immun. 22, 676–689. ( 10.1016/j.bbi.2007.05.006) [DOI] [PMC free article] [PubMed] [Google Scholar]
- 27.Pachl C, et al. 1995. Rapid and precise quantification of HIV-1 RNA in plasma using a branched DNA signal amplification assay. J. Acquir. Immune Defic. Syndr. Hum. Retrovirol. 8, 446–454. ( 10.1097/00042560-199504120-00003) [DOI] [PubMed] [Google Scholar]
- 28.Lu X, et al. 1998. Targeted lymph-node immunization with whole inactivated simian immunodeficiency virus (SIV) or envelope and core subunit antigen vaccines does not reliably protect rhesus macaques from vaginal challenge with SIVmac251. AIDS 12, 1–10. ( 10.1097/00002030-199801000-00001) [DOI] [PMC free article] [PubMed] [Google Scholar]
- 29.Leutenegger CM, Higgins J, Matthews TB, Tarantal AF, Luciw PA, Pedersen NC, North TW. 2011. Real-time TaqMan PCR as a specific and more sensitive alternative to the branched-chain DNA assay for quantitation of simian immunodeficiency virus RNA. AIDS Res. Hum. Retroviruses 17, 243–251. ( 10.1089/088922201750063160) [DOI] [PubMed] [Google Scholar]
- 30.Maes M, et al. 1998. The effects of psychological stress on humans: increased production of pro inflammatory cytokines and A Th1-like response in stress-induced anxiety. Cytokine 10, 313–318. ( 10.1006/cyto.1997.0290) [DOI] [PubMed] [Google Scholar]
- 31.Irwin M. 1994. Stress-induced immune suppression: role of brain corticotropin releasing hormone and autonomic nervous system mechanisms. Adv. Neuroimmunol. 4, 29–47. ( 10.1016/S0960-5428(06)80188-9) [DOI] [PubMed] [Google Scholar]
- 32.Noldus LPJJ. 1991. The Observer: a software system for collection and analysis of observational data. Behav. Res. Methods Instrum. Comput. 23, 415–429. ( 10.3758/BF03203406) [DOI] [Google Scholar]
- 33.Capitanio JP. 1985. Early experience and social processes in rhesus macaques (Macaca mulatta): II. Complex social interaction. J. Comp. Psychol. 99, 133–144. ( 10.1037/0735-7036.99.2.133) [DOI] [PubMed] [Google Scholar]
- 34.Altmann J. 1974. Observational study of behavior: sampling methods. Behaviour 49, 227–265. ( 10.1163/156853974X00534) [DOI] [PubMed] [Google Scholar]
- 35.Abel K, Alegria-Hartman MJ, Rothaeusler K, Marthas M, Miller CJ. 2002. The relationship between simian immunodeficiency virus RNA levels and the mRNA levels of alpha/beta interferons (IFN-α/β) and IFN-α/β-inducible Mx in lymphoid tissues of rhesus macaques during acute and chronic infection. J. Virol. 76, 8433–8445. ( 10.1128/JVI.76.16.8433-8445.2002) [DOI] [PMC free article] [PubMed] [Google Scholar]
- 36.Abel K, et al. 2004. Gamma interferon-mediated inflammation is associated with lack of protection from intravaginal simian immunodeficiency virus SIVmac239 challenge in simian-human immunodeficiency virus 89.6-immunized rhesus macaques. J. Virol. 78, 841–854. ( 10.1128/JVI.78.2.841-854.2004) [DOI] [PMC free article] [PubMed] [Google Scholar]
- 37.Westermann J, Pabst R. 1990. Lymphocyte subsets in the blood: a diagnostic window on the lymphoid system? Immunol. Today 11, 406–410. ( 10.1016/0167-5699(90)90160-B) [DOI] [PubMed] [Google Scholar]
- 38.Madden LJ, Flynn CT, Zandonatti MA, May M, Parsons LH, Katner SN, Henriksen SJ, Fox HS. 2005. Modeling human methamphetamine exposure in nonhuman primates: chronic dosing in the rhesus macaque leads to behavioral and physiological abnormalities. Neuropsychopharmacology 30, 350–359. ( 10.1038/sj.npp.1300575) [DOI] [PubMed] [Google Scholar]
- 39.Capitanio JP. 2011. Health and social relationships in nonhuman primates: toward a comparative health psychology. In Oxford handbook of health psychology (ed. Friedman HS.), pp. 860–883. New York, NY: Oxford University Press. [Google Scholar]
- 40.Akinyi MY, Tung J, Jeneby M, Patel NB, Altmann J, Alberts SC. 2013. Role of grooming in reducing tick load in wild baboons (Papio cynocephalus). Anim. Behav. 85, 559–568. ( 10.1016/j.anbehav.2012.12.012) [DOI] [PMC free article] [PubMed] [Google Scholar]
Associated Data
This section collects any data citations, data availability statements, or supplementary materials included in this article.
Supplementary Materials
Data Availability Statement
The datasets supporting this article have been uploaded as part of the electronic supplementary material.